Abstract
Euchresta horsfieldii (Lesch) Benn. is a highly demanded medicinal plant with many benefits. In vitro propagation through callus induction is an effective method for rapid multiplication in a short time. This research aimed to evaluate the effective concentration of Benzyl Amino Purine and 2,4-Dichlorophenoxiacetic acid on callus induction and organogenesis for in vitro propagation and secondary metabolite production of E. horsfieldii. The design used in this research was a Complete Randomized Design in 2 factors: Benzyl Amino Purine and 2,4-Dichlorophenoxiacetic acid with 5 levels for each concentration. Parameters observed are the percentage of inducted calluses, callus appearance time, the weight of fresh calluses, the weight of dry calluses, the texture of callus, the color of callus, percentage of the formed shoot, shoot appearance time, the height of shoots, the number of leaves, flavonoid compounds of callus, and bioactive compounds. The result showed that the single treatment of Benzyl Amino Purine and 2,4-Dichlorophenoxiacetic was significantly affecting the shoots forming. The concentration of 2,4-Dichlorophenoxiacetic 0 ppm gave the highest average plantlet height by 2.67 cm, increasing the number of shoots by 2.00, and the number of leaves by 5.60. E. horsfieldii cultured in vitro without additional growth regulators had a higher flavonoid content.
-
Key words: Euchresta horsfieldii, Gas chromatography-mass spectroscopy, Flavonoids, Tissue culture
INTRODUCTION
Euchresta horsfieldii is an Indonesian medicinal plant. E. horsfieldii is a shrubs plant in the family Fabaceae with a 45 cm average height. Branches and branchlets are glab-rous and striate lengthwise. It has thickly papery leaves with a length of 3-5 cm. Calyx 5-6 mm in diameter, 5-lobed at the tip, obliquely nearly truncated, with very tiny ap-pressed hairs (Wu and Raven, 2010). E. horsfieldii has many medicinal benefits in each of its parts. The fruit of E. horsfieldii is commonly used as an aphrodisiac and as a cure to snake poison by Bali’s native villagers (Sutomo and Mukaromah, 2010). Its seeds and fruits also can be used to treat lung diseases such as asthma, and TBC (Heyne 1987; Kloppenburgh 2006; Tirta et al. 2010; Kim et al. 2011). With those huge potentials and high demand, in vitro propagation is urgently needed to preserve the population of E. horsfieldii.
In vitro propagation, is a biotechnological technique that aids humans in the production of plants. Because of its ability to generate material in a short amount of time, this technology is extremely beneficial to plant breeding. Many types of plants, including decorative plants and forest trees, have been propagated by this method.
In vitro propagation has also aided in the conservation of rare and endangered plants that are found in endemic environments or under other unique conditions (
Chokeli et al. 2020). This appro-ach, however, has never been used to increase
E. horsfieldii population. As a result, we investigated an effective callus induction approach using the shoot of
E. horsfieldii as an explant for bulk replication of this medicinal plant. The in vitro technique entails some procedures in order to produce the desired output, which in this case is optimum
E. horsfieldii calluses and shoots. The outcome of an in vitro procedure is impacted by some factors, including media composition and plant growth regulators (
Bidabadi and Jain, 2020). A particular amount of auxin and cytokinin can be combined to produce optimal calluses. BAP and 2,4-D are cytokinins and auxins that have been successfully used as plant growth regulators in optimum conditions (
Gul et al. 2020). This research aimed to evaluate the effective concentration of BAP and 2,4-D on callus induction and organogenesis for in vitro propagation of
E. horsfieldii, which could lead to a future investigation of in vitro regeneration of this medicinal plant.
MATERIALS AND METHODS
Plant material and seed germination
This research was conducted from August to November 2021 in the Laboratory of Plant Physiology and Biotechno-logy Faculty of Agriculture, Sebelas Maret University. The study began with the sterile germination of E. horsfieldii seeds, followed by medium preparation, initiation, and observation. This study used a completely randomized design (CRD) with 25 treatment combinations that were duplicated three times. Explants of a month-old E. horsfieldii shoots, fungicide, Murashige and Skoog (MS) medium with BAP (0; 0.5; 1; 1.5; 2 ppm) and 2,4-D (0; 0.5; 1; 1.5; 2 ppm), aquadest, 70% alcohol, spirtus, tween 80 percent, and chlorox were employed. Parameters observed are the percentage of inducted calluses, callus appearing time, the weight of fresh calluses, the color of callus, the texture of callus, percentage of formed shoots, shoots appearing time, the height of shoots, and the number of leaves.
Tools and explants sterilization
Sterilization was done for the tools and seeds. For the tools sterilization, tweezers, culture knife (scalpel), and petri dish are among the dissection equipment that is cleaned. The instruments were then disinfected in an autoclave for 30 minutes at 121℃ and 1 atm pressure before being stored in the oven to retain their sterility. The seeds were sterilized twice. E. horsfieldii seeds were removed from their seed coat. The peeled seeds were properly washed under running tap water, steeped in a detergent and aquadest solution (20 mL detergent for 100 mL aquadest) for 1 minute, cleaned on aquadest, then soaked in a fungicide (0.1 g for 100 mL aquadest) for 30 minutes, then cleaned on aquadest for four times. Further sterilization was carried out in an aseptic environment under a laminar air flow cabinet by soaking the seeds in a chlorox 2.5% solution for 30 seconds, followed by soaking in alcohol 35% for 30 seconds, then washing twice with sterile aquadest.
Culture medium
The medium was produced by adding varying concen-trations of BAP and 2,4-D to Murashige & Skoog (MS) based medium. Medium making starts with 30 g of sugar, 50 mL of MS macronutrients, 10 mL of MS micro-nutrients, 50 mL of Fe-EDTA, 50 mL of vitamins, 6.25 mL of BAP (0 ppm (B0); 0.5 ppm (B1); 1 ppm (B2); 1.5 ppm (B3); 2 ppm (B4)) and 6.5 mL of 2,4-D (0 ppm (D0); 0.5 ppm (D1); 1 ppm (D2); 1.5 ppm (D3); 2 ppm (D4)), followed by 1,000 mL of distilled water and pH control up until 6.2. As a controller, NaOH was used to lower pH while HCl was used to raise it. Furthermore, 8 grams of agar powder was added, heated with a magnetic stirrer until it boiled, then transferred to a culture bottle and autoclaved. The best treatment for callus induction and organogenesis was determined using a controlled media without the addition of plant growth regulators.
Explant initiation and maintenance
Explants were made by growing E. horsfieldii seeds in a sterile environment. The seeds were planted in a cotton medium and germinated in an aseptic environment. After one month, the explants were harvested. The second shoot of the germinated seeds was used as an explant in this study. Scissors were used to separate the shoot from the main plant. The shoot’s leaves were trimmed to reduce their weight and allow it to stand in the medium. Tweezers were used to plant the shoots in the medium, one for each culture bottle. The explants in this study were kept in a growing environment with a temperature of 25℃ for 24 hours under white fluorescent light. To keep the bottles aseptic and prevent contamination, they were sprayed with 70% alcohol regularly.
Data collection and analysis
The color and texture of calluses data are described and the rest parameters were analyzed by ANOVA (Analysis of Variance) 5% then continued by DMRT (Duncan Multiple Range Test) 5% if the data showed a significant result. The design used in this research was a Complete Ran-domized Design in 2 factors: Benzyl Amino Purine and 2,4-Dichlorophenoxiacetic acid with 5 levels for each concentration: 0; 0.5; 1; 1.5; and 2 ppm. 25 combinations were obtained and repeated 3 times producing 75 experi-ment units.
RESULTS
Induction of callus
The percentage of inducted calluses demonstrates that BAP and 2,4-D had a considerable impact on
E. horsfieldii callus growth.
Table 1 demonstrates that practically all 2,4-D treatments were able to generate calluses 100% of the time. It reveals that the treatment with 2,4-D 0 ppm concentration was considerably different from the other treatments, while 2,4-D treatments of 0.5; 1; 1.5; and 2 ppm had similar results. However, treatment with a 0 ppm concentration of BAP was completely different from treatment with a 1; 1.5; and 2 ppm concentration of BAP. Thus, it can be seen that treatments 1 to 3 ppm in both BAP and 2,4-D were the more optimal concentration because the percentage of inducted callus at that concentration was 100% (
Table 1).
Callus developments are marked by the appearance of a bulge or swelling at the base of the explant. However, the result of the ANOVA analysis of callus appearance time showed an insignificant number (
P > 0.05). Therefore, the DMRT test is unlikely to be done.
Fig. 1 displayed the complete data of the callus appearance time for each treatment. Treatment B2D2 or the combination of BAP 1 ppm + 2,4-D 1 ppm had the quickest average callus appear-ance time, along with BAP 1.5 ppm + 2,4-D 1 ppm (B3D2), 1.5 ppm + 2,4-D 1.5 ppm (B3D3), and 1.5 ppm + 2,4-D 2 ppm (B3D4), with a 5-day appearance time. Treatment B4D1 consists of a combination of BAP 2 ppm + 2,4-D 0.5 ppm, with a 9-day appearing seed, which had the slowest average appearing time. It can be concluded that B2D2 is the best treatment to induce callus fast. The time it takes for a callus to form is mostly controlled by the amount of exogenous auxin present.
Table 2 displayed the complete data of callus texture that is divided into 2 groups: friable and compact calluses. Compact calluses predominated among inducted calluses. When a callus was exposed to lignification, the callus consolidated, forming compact calluses. The cytokine that operates as nutrition transporters has an impact on this occurrence.
Castro et al. (2016) also found that on a medium with a greater BAP concentration, compact calluses can be formed.
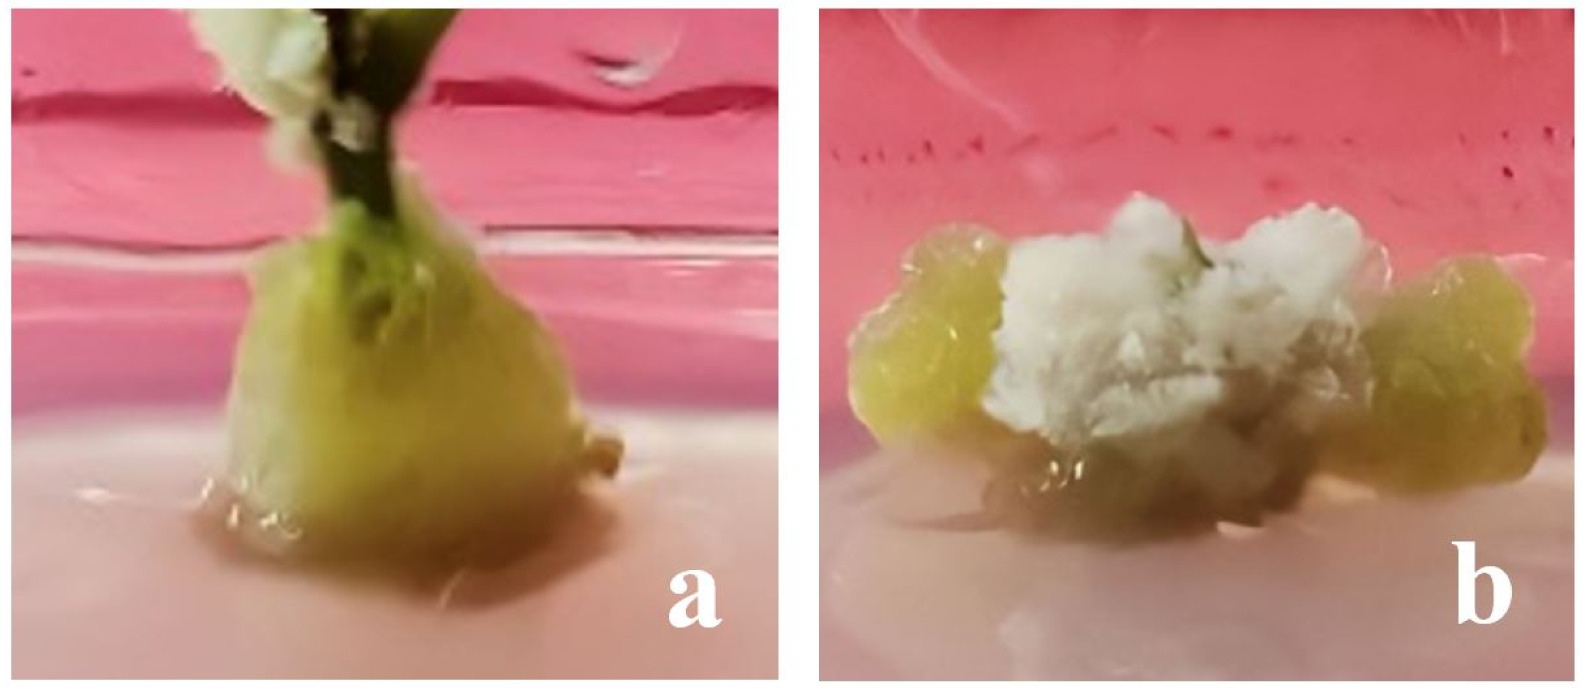
Fig. 2 displayed the visualization of friable and compact calluses. Friable calluses were obtained on treatment 0 ppm + 2,4-D 0.5 ppm (B0D1), 0 ppm + 2,4-D 1 ppm (B0D2), 0 ppm + 2,4-D 1.5 ppm (B0D3), 0 ppm + 2,4-D 2 ppm (B0D4), 0.5 ppm + 2,4-D 1 ppm (B1D2), 1 ppm + 2,4-D 0.5 ppm (B2D1), 1 ppm + 2,4-D 1.5 ppm (B2D3), and 1 ppm + 2,4-D 1 ppm (B2D2). Endogenous auxin hormones found in the explant stimulate the formation of friable calluses.
Callus color is a parameter that can be an indicator of the compounds contained in the callus. The color of the callus ranged from green to whitish green, white, yellowish green, green, and brownish green (
Fig. 3). According to Rasud and Bustaman (2018), callus color change is an indicator of the growth of cells in callus tissue. Based on the data in
Table 3, it can be seen that the most common callus color found was green. Furthermore, white callus was found in B3D0 and B4D0 treatments. The white color of the callus indicates the lack of pigment in the callus cells. Yellowish green callus found in the 1.5 ppm + 2,4-D 2 ppm (B3D4) and 2 ppm + 2,4-D 0.5 ppm (B4D1) treatments were suspected as a potential embryogenic callus.
Wu et al. (2020) stated that proper handling such as the application of the subculture process was able to induce embryogenic callus that had the potential to form buds.
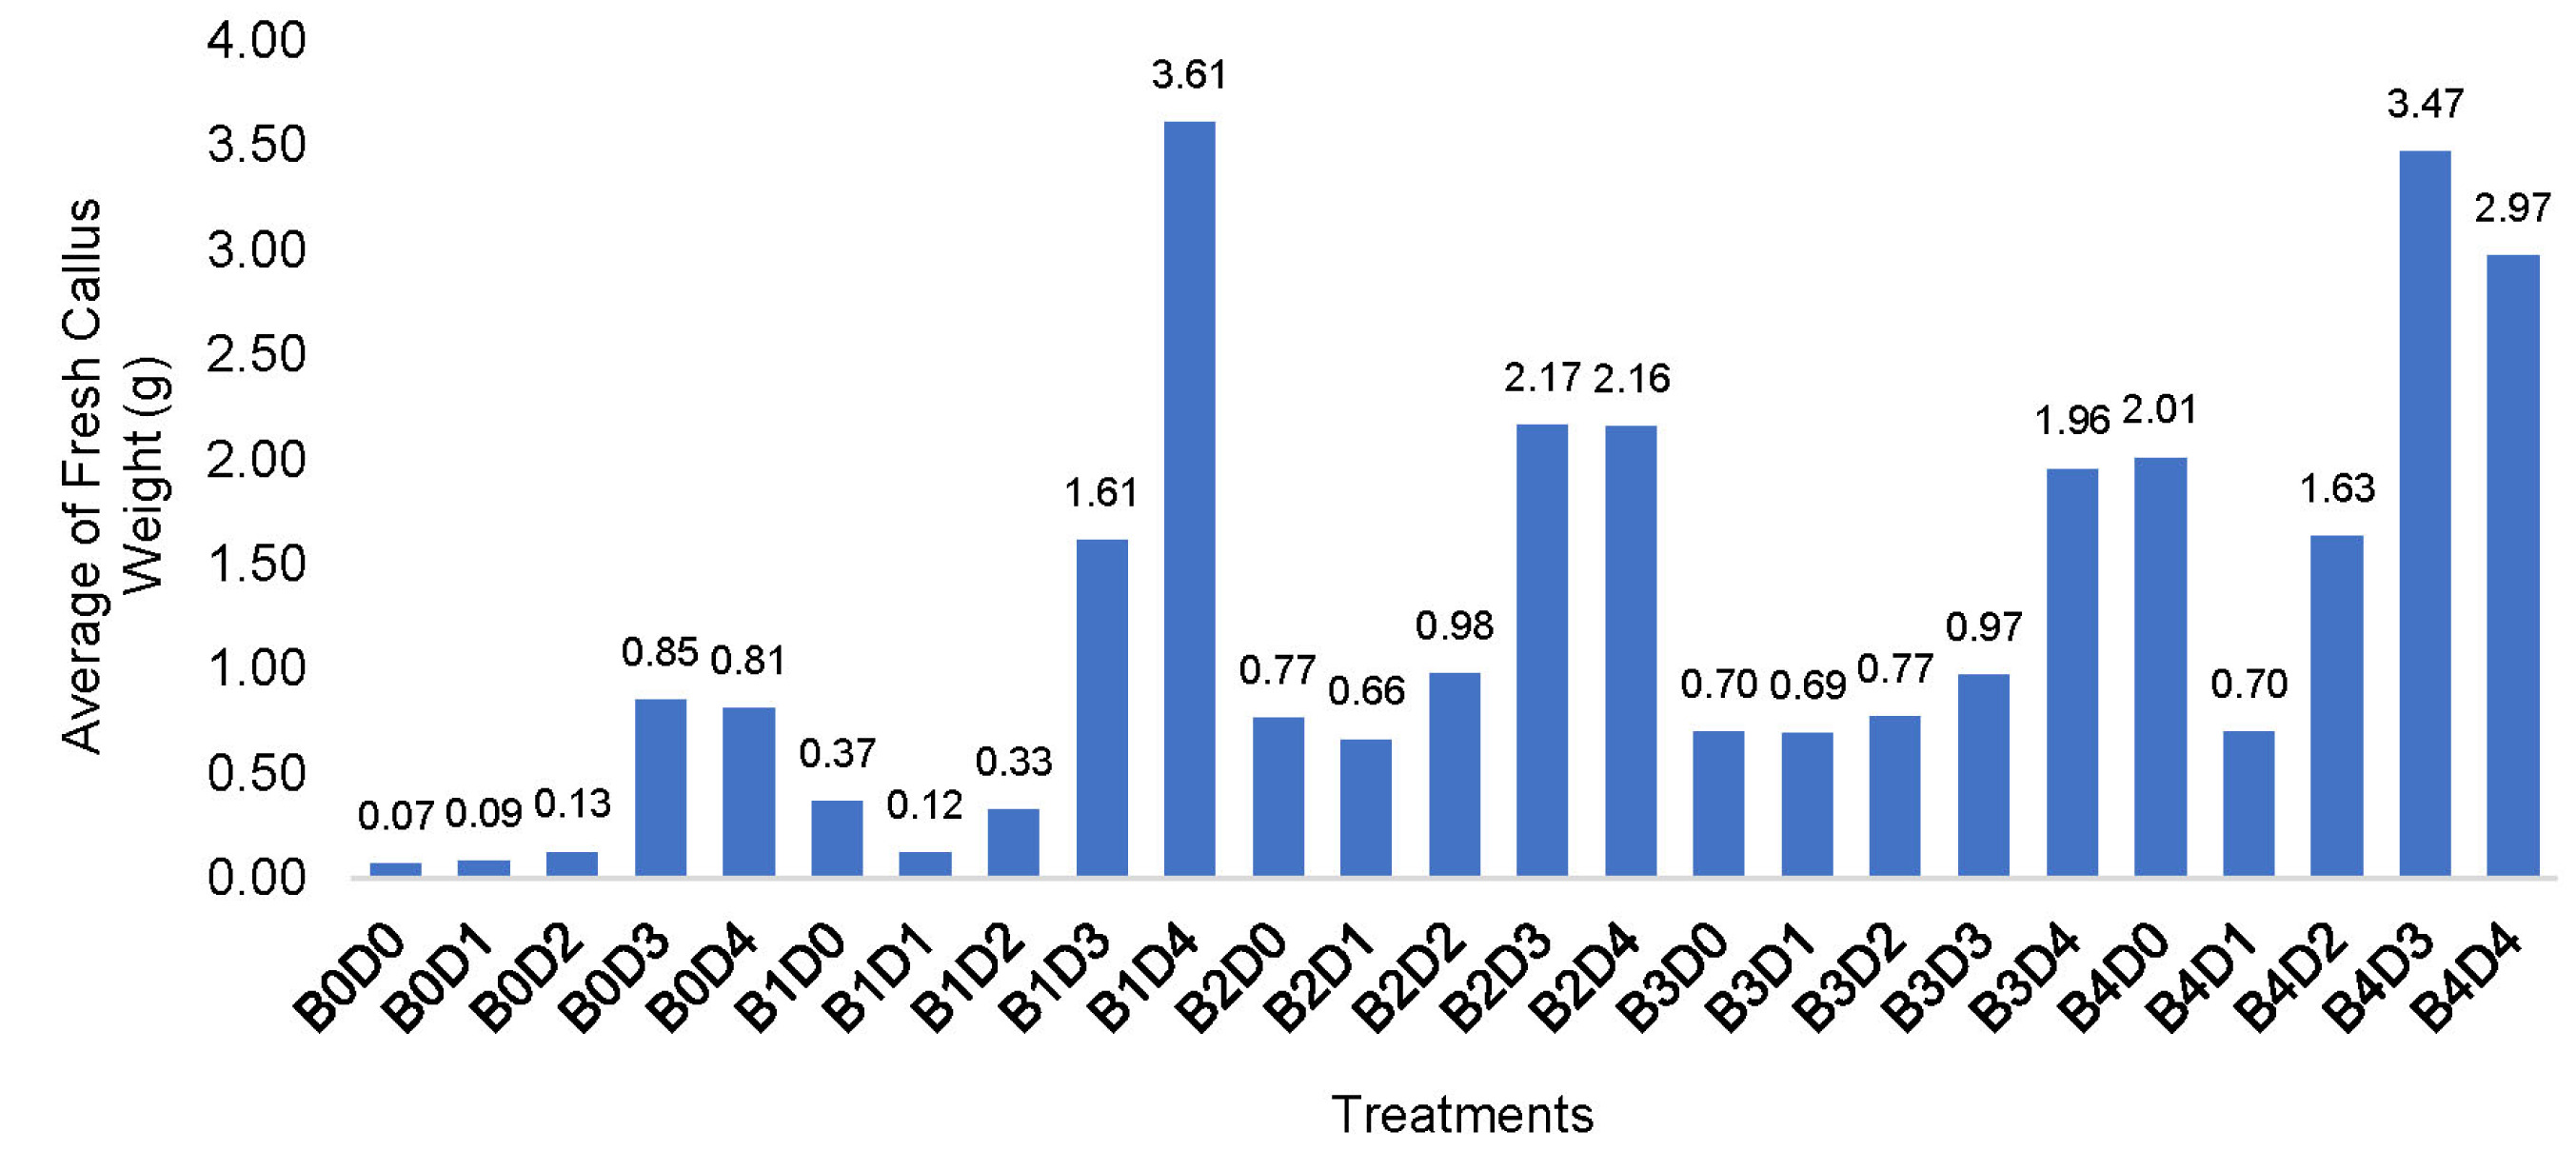
The weight of fresh calluses was observed on a month-old callus.
Fig. 4 shows that the highest average of callus fresh weight was obtained on treatment B1D4 (0.5 ppm BAP and 2 ppm 2,4-D) with an average weight of 3,610 g. This demonstrated that this combination had the best balance of auxin (2,4D) and cytokinin (BAP), resulting in the production of optimal callus masses in
E. horsfieldii. However, the lowest average resulted at 0.086 g on treatment B0D1 (0 ppm BAP + 0.5 ppm 2,4-D). The low-growth regulators are directly proportional to low callus quality. Treatment B0D0 was discluded from observation for not developing any calluses.
The weight of dry calluses was calculated on some samples (
Fig. 5). The selected treatments are chosen as representatives for the combinations of high and low auxin and cytokinin. The harvested callus was dried in the oven at 60℃ temperature. The highest callus dry weight average was observed on treatment 0.5 ppm + 2,4-D 2 ppm (B1D4) with 0.111 g. Treatment BAP 0.5 ppm + 2,4-D 0 ppm (B1D0) has the lowest callus dry weight average of 0.027 g. However, the result of the ANOVA analysis of callus dry weight showed an insignificant number (
P > 0.05). Therefore, the DMRT test was unlikely to be done.
When a shoot reaches a length of 0.5 cm, the criteria of shoots are calculated. The ANOVA revealed that every single treatment of BAP and 2,4-D had a significant effect on the percentage of developed shoots on
E. horsfieldii. Nonetheless, the interaction of BAP and 2,4-D did not influence the formation of shoots.
Table 4 showed that a single treatment of BAP by 0; 0.5; 1; and 1.5 ppm con-centration has no significantly different effect on the percentage of
E. horsfieldii shoots forming. However, those treatment is significantly different from the treatment BAP by 2 ppm. The application of 2,4-D can influence the percentage of
E. horsfieldii shoots forming. The average percentage of
E. horsfieldii planet shoots showed that a single treatment of 2,4-D with concentrations of 0.5 ppm and 1 ppm gave no noticeable different results from treatment with 2,4-D 2 ppm and 1.5 ppm. 2,4-D 0 ppm differs noticeably from 2,4-D with any other treatments.
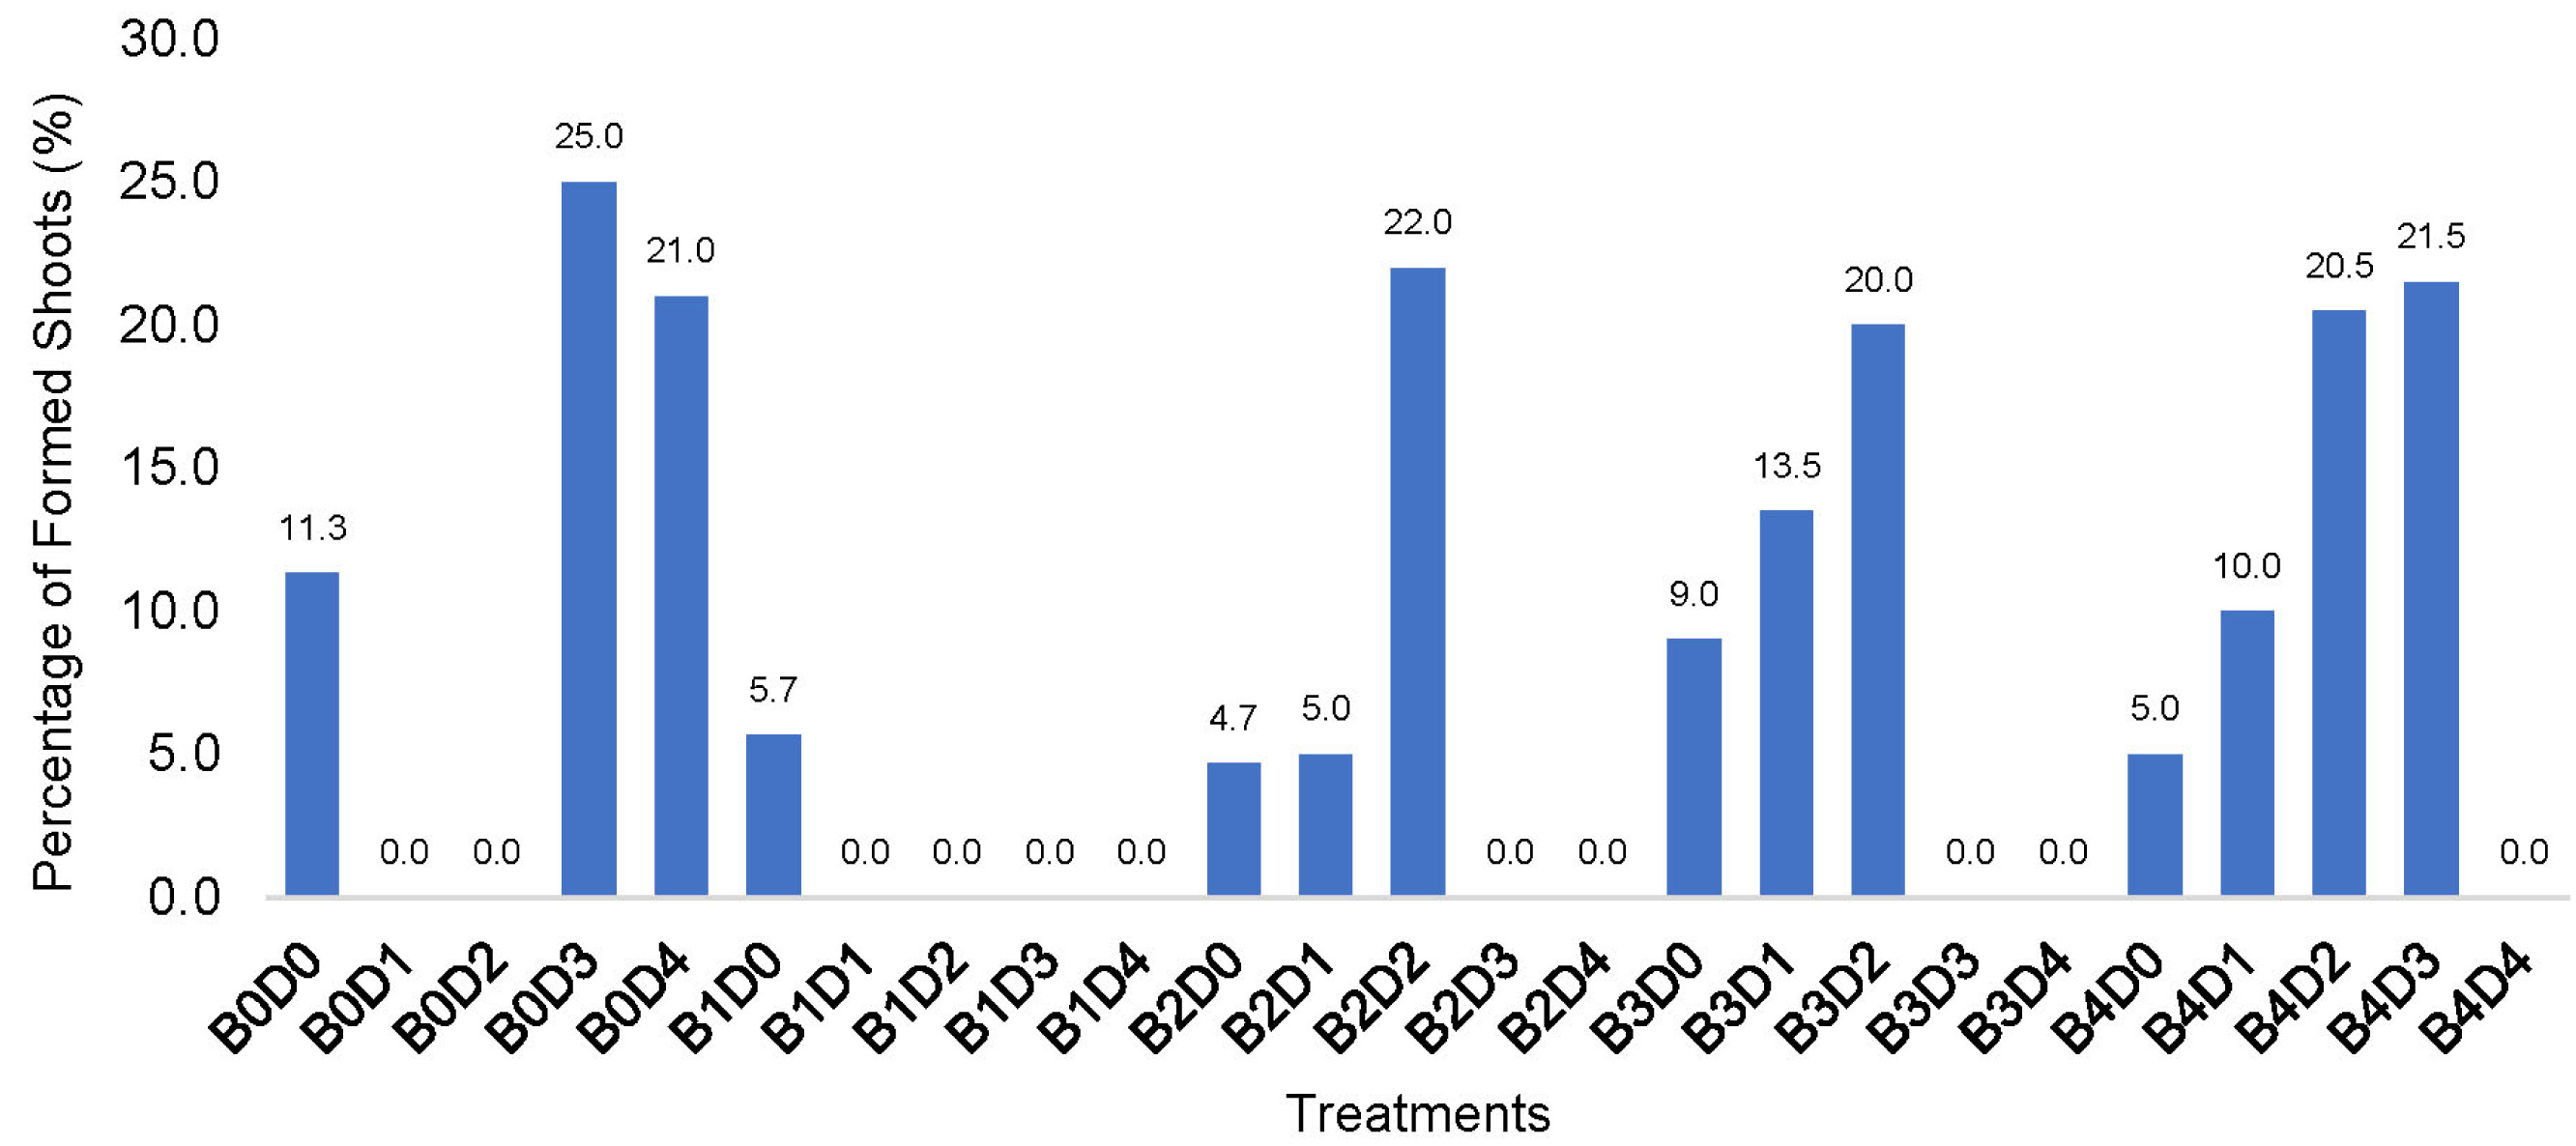
Fig. 6 displayed the complete data of the percentage of
E. horsfieldii formed shoots. Treatment B0D1, B0D2, B2D1, B2D2, and B3D2 was showing a 33.33% percentage of
E. horsfieldii shoots forming which means 1 of 3 explants was able to produce a shoot. Treatment B3D1, B4D2, and B4D3 reached 66.66% percentage of
E. horsfieldii shoots forming, this means 2 of 3 planted explant was able to successfully form shoots. Treatment B0D0, B1D0, B2D0, B3D0, B4D0, and B4D1 was able to reach the 100% percentage of
E. horsfieldii shoots forming. It can be seen that the addition of auxin in the form 2,4-D decreased the percentage of formed shoots.
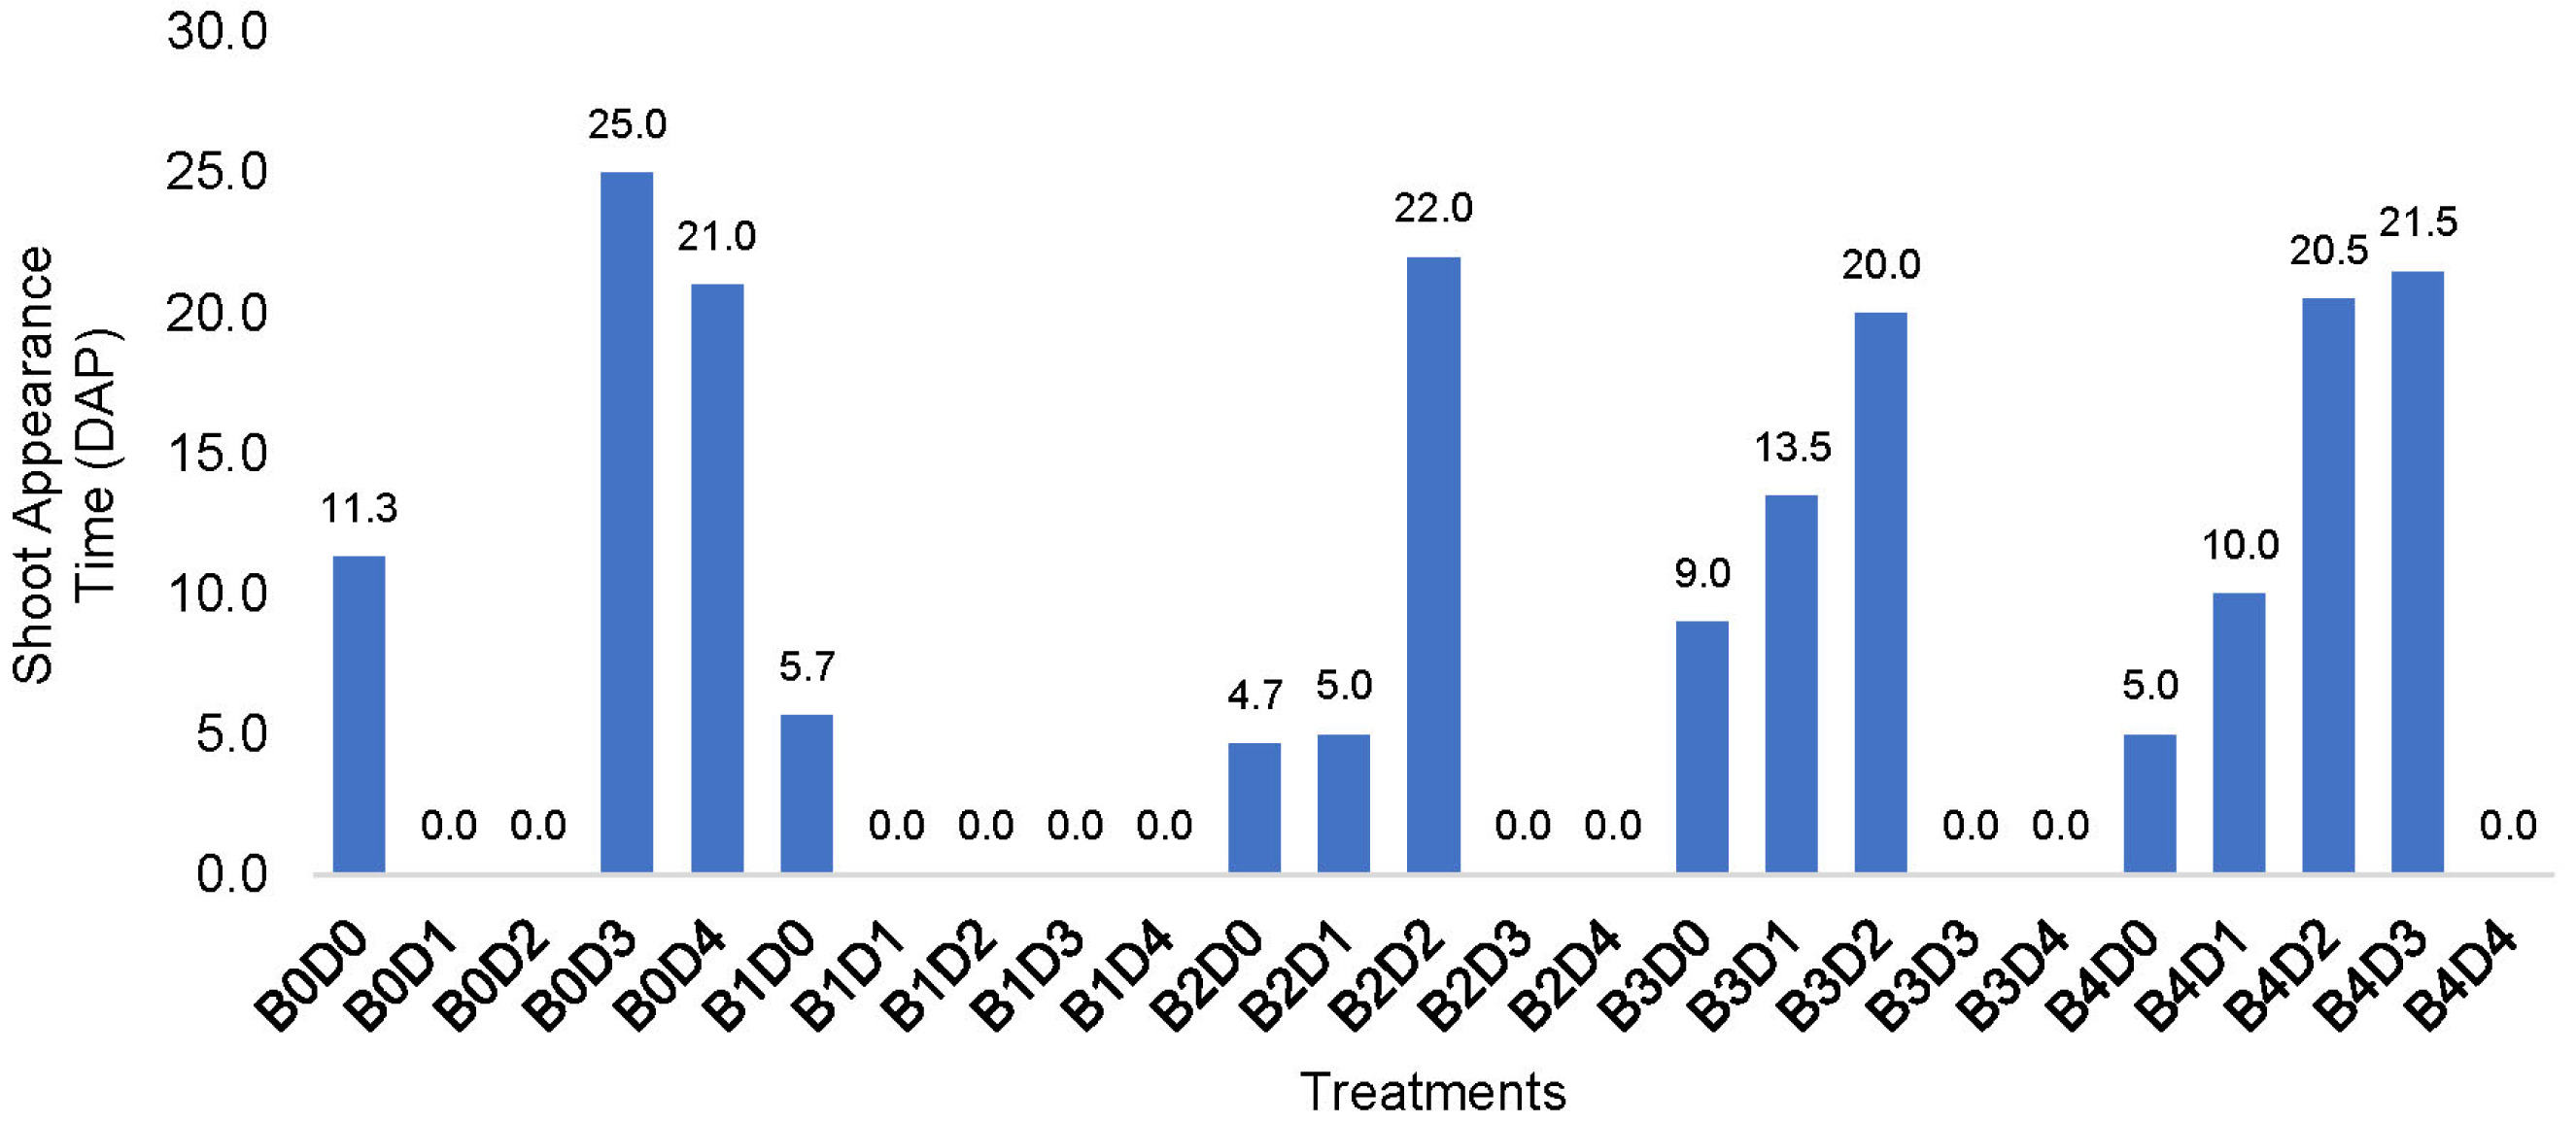
The shoot appearance time is observed when a shoot reaches a length of 0.5 cm. The ANOVA analysis results revealed that each BAP and 2,4-D treatment has no significant effect on the shoot appearance time, as does the interaction of BAP and 2,4-D, which has no significant effect on the shoot appearance time of E. horsfieldii shoots. The concentration of BAP and 2,4-D is thought to be less efficient against the emergence of E. horsfieldii shoots.
The average
E. horsfieldii shoots appearance time is ranged from 4.67 days to 25 days after the initiation.
Fig. 7 displayed the complete data of average shoot appearance time in
E. horsfieldii. Treatment B2D0 which consists of 1 ppm BAP and 0 ppm 2,4-D was the fastest shoot average appearing time with 4.67 days after the initiation. The slowest treatment was B0D3 which consist of 0 ppm BAP and 1.5 ppm 2,4-D with 25 days after the initiation. From this result, it seems likely that BAP affects shoot formation by accelerating the process and 2,4-D slows it down. BAP affected shoot formation by accelerating the process and 2,4-D slows it down. For this situation,
Dinesh et al. (2019) research on
Punica granatum assumes that the influence of BAP on shoot formation might be related to the faster metabolism of BAP by plant tissues compared with other synthetic growth regulators.
The ANOVA analysis result for the 2,4-D effect on
E. horsfieldii shoots height was also significant.
Table 5 showed that the effect of treatment with 0 ppm has a different effect from any other treatments and resulted in the highest average height of
E. horsfieldii. The treatment with 1 ppm of BAP has no significant difference from treatments 0.5; 1.5; and 2 ppm.
The interaction of BAP and 2,4-D did not have a significant influence on the number of
E. horsfieldii plantlet leaf growth. However, treatment with BAP and 2,4-D concentration alone has significantly influenced the number of
E. horsfieldii plantlet leaves growth.
Table 6 showed that 0 ppm of BAP concentration has a similar effect with BAP 0.5 and 1 ppm on the number of leaves of
E. horsfieldii. The treatment of BAP 2 ppm gave the highest number of leaves. On the contrary, 2,4-D 2 ppm has the lowest number of leaves while 2,4-D 0 ppm treatment showed the highest number of leaves of
E. horsfieldii plantlet. That treatment showed significantly different effects with 1; 1.5; and 2 ppm concentrations of 2,4-D.
In this study, the flavonoid content test was applied to 10 samples of callus and plantlets that had formed stems, leaves, and roots and 1 field sample of
E.horsfieldii. Those 10 callus samples were selected based on the high and low concentrations of BAP and 2,4-D used to represent all existing treatments. The flavonoid content test was also carried out on field samples to be used as a comparison against callus and plantlets from tissue culture. The data obtained showed that the value of the flavonoid content of the field samples was 3.27%. The treatment B0D4 had the lowest flavonoid concentration, with a value of 1.61%. The highest content of flavonoid compounds can be found in sample B0D0 or the treatment without additional growth regulators with a value of 4.35% (
Table 7).
Bioactive compound analysis was conducted using GCMS (
Gas Chromatography Mass Spectroscopy). Analysis was applied to the field sample and callus of treatment BAP 1 ppm + 2,4-D 1.5 ppm (A2B3) as the best treatment observed. The results of the GCMS test on field samples and BAP 0.5 ppm + 2,4-D 1 ppm (B1D2) plantlet samples showed a difference. Some of the major compounds detected were found in both the field sample and B1D2 plantlet samples, some of which could only be found in one of the samples.
Table 8 displays a list of major compounds in both samples. The presence of compounds that cannot be found in other samples is thought to be caused by differ-ences in nutrients obtained during the planting process. In vitro cultivation with the addition of BAP and 2,4-D was thought to trigger the formation of compounds that could not be found in field samples.
Based on the data in
Table 8,
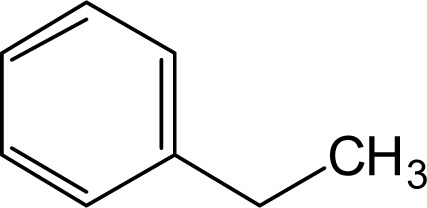
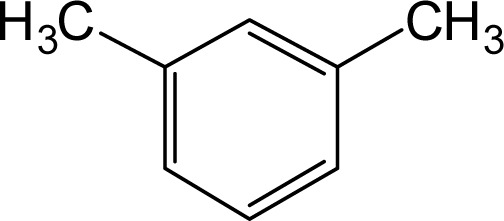
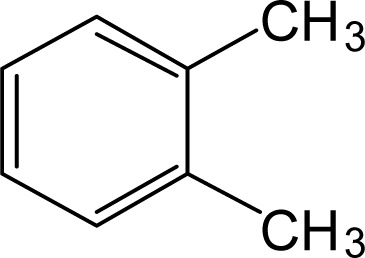
Benzene ethyl and
Benzene 1,3 dimethyl are 2 types of alkene compounds found in field samples and plantlets. However,
Benzene 1,2 dimethyl can only be found in plantlet samples. Another compound found in both types of samples is
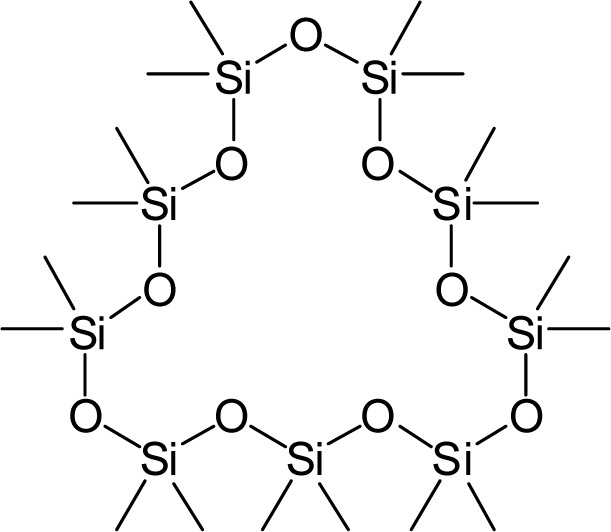
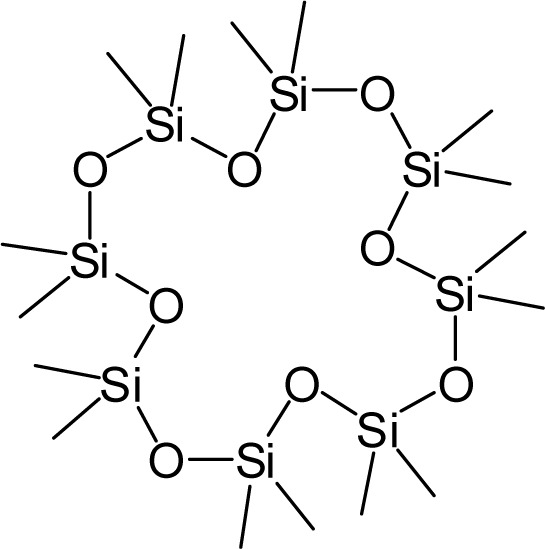
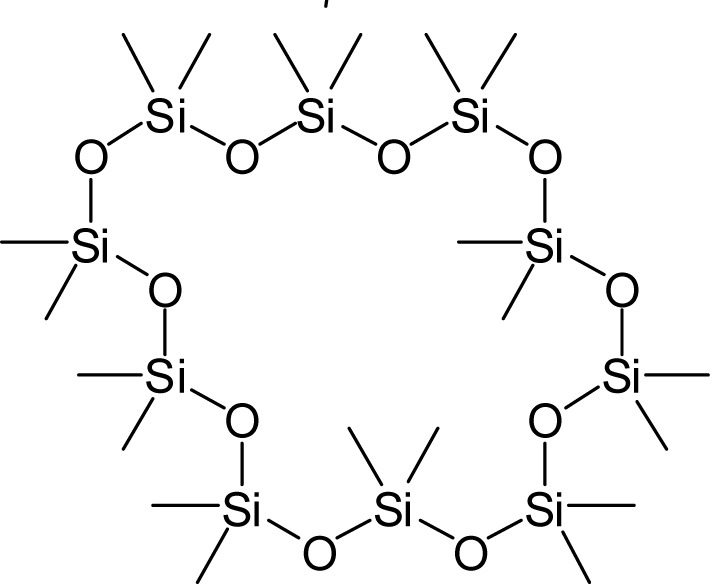
pentadecanoic acid and 9-octadecenamide. Siloxane compounds are one of the major compound groups in this study and were commonly found in B1D2 plantlet samples. Apart from the major compound, there are several other components iden-tified. These components are impurity components and minor components. Compounds detected in small amounts in one of the samples are thought to be impurity com-ponents. Compounds suspected as impurity components identified include
(4R,5R)-2,2-Dimethyl-4-pentadecenamide, 2-Hydroxycyclopentadecamethyl, and
(Z,Z)-6,9-cis-3,4- epoxy-nonadecadiene. Other compounds that are not in-cluded in the major compound group but are present in both types of samples are called minor compounds. The cause of the presence of minor compounds is thought to be related to the age of the plants when processed to be a sample. This is because some compounds are only formed at certain periods during plant growth. One of the minor compounds from
E. horsfieldii detected in this study was
2-pentanol, 4 methyl.
2-pentanol, 4 methyl is a compound used as a raw material for flavored products. According to
Api et al. (2019) 2-pentanol, 4 methyl is an aromatic compound that does not have the potential for toxicity when used in humans. This compound is often used in detergents, per-fumes, clothing fragrances, and several types of cosmetics.
DISCUSSION
Induction of callus
The explants’ meristematic tissue contains endogenous hormones that aid in the formation of calluses. When endogenous hormones were coupled with BAP and 2,4-D, cells that would be actively differentiated began to pro-liferate. This finding was consistent with
Fadhilasari et al (2018), who found that juvenile explants were faster and more likely to generate callus than older explants. However, there was no callus development in treatment B0D0, which was a pure MS media. This is thought to be caused by a lack of supportive hormones that induce callus development.
According to Robles
et al, (2016) as an auxin, 2,4-D increased osmotic pressure and cell permeability, lowering cell wall pressure and increasing synthetic protein, plas-ticity, and cell wall growth. The development of calluses appears to be influenced by cytokinin concentrations. After 9 days of induction, treatment with a combination of higher cytokine and lower auxin are slow to develop calluses. This suggests that increased cytokinin concentrations influenced callus growth, which could be related to cytokinin’s role in creating shoots and growing plantlets. These findings support
Ahmad et al. (2020) findings that the kind and concentration of PGRs used had a substantial impact on callus development.
The color and texture of the callus were observed in this study as callus morphology. The texture of a callus is used to determine its quality. Friable and compact callus were the two types of callus texture identified. According to
Karimi et al. (2018), callus texture can be categorized as friable to compact depending on the type of explant, media, growth regulators, and biotic and abiotic nutrients used. The endogenous auxin hormone found in explants also stimulates the formation of friable callus. According to
El Aouad et al. (2019), friable callus generally has nucleates in its tissue. Furthermore,
Salim et al. (2019) explained that friable callus formed faster than compact callus, this was due to the friable callus cell division being faster than compact callus.
According to
Li et al. (2021), the green color of the callus is an indication of the presence of chloroplasts in the callus tissue formed from the development of proplastids due to exposure to light. The brownish-green color is also common. This was allegedly caused by observations made when the callus was 8 WAP so that browning events had occurred in several callus.
Cai et al (2020) explained that a callus with brown color was a green callus that had undergone a browning process, this indicated the presence of toxic phenolic chemicals in the callus.
A certain concentration of cytokinin combined with auxin proved to be able to help explants produce calluses. However, the interactions between BAP and 2,4-D in this research do not affect the weight of fresh callus (
Table 9). Cytokinin itself has an important role to develop a good callus quality. Mahadi
et al. (2016) in
Castro et al. (2016) stated that the cytokinin transport system, which runs from the base to the top of the plant, carries water and nutrients through the transport vessel, affecting the osmotic potential of cells. This activity causes cell walls to turn rigid and eventually develop calluses. This was shown in
Table 9, where 0.5 ppm concentration of BAP was different from 0 ppm and 2 ppm but similar to 1 ppm and 1.5 ppm.
Treatment with 2 ppm concentration of BAP was signi-ficantly different from any other treatment and can be concluded as the best treatment for increasing the fresh weight of callus. Acid secretion causes cell membrane relaxation by activating the enzyme at a certain pH. This enzyme is responsible for breaking the links between cellulose molecules in the cell wall. Turgor pressure occurs when cells absorb water molecules in response to an increase in soluble material concentration in the vacuole, allowing them to expand.
Table 9 shows that the existence of 2,4-D alone has a significant effect on the weight of fresh calluses. Treatments with 0; 0.5; and 1 ppm were observed to have a similar effect to the fresh weight of calluses. However, the effect of those treatments was significantly different from treatment 1.5 ppm and 2 ppm concentration of 2,4-D.
The result also showed that higher concentrations of 2,4-D were able to produce higher callus dry weight. This indicates the significant effect of 2,4-D to callus weight. Another research by Abdelmaksood (2017) showed that auxin concentration plays a big role in callus quality, a combination of auxin and cytokinin was also a better treatment for the high frequency of callus. The drying process of calluses will reduce 60% to 90% its weight as in the research conducted by
Osman et al. (2016) where they recorded the fresh weight [(1.681 ± 0.770) g], and the dry weight [(0.239 ± 0.239) g] of
Barringtonia racemosa L.
Those number was calculated based on the results of three replications of the calculation per treatment, and the MS base media with growth regulator concentration provided the best response. This statement is in accordance with the research of
Paramartha et al. (2012) that the addition of high concentrations of auxin has the effect of inhibiting tissue growth because there is competition with endogenous auxin to get a position for receiving cell membrane signals so that the addition of auxin from the outside does not have a major effect on cell growth and development. BAP affected shoot formation by accelera-ting the process and 2,4-D slows it down. For this situation,
Dinesh et al. (2019) research on
Punica granatum assumes that the influence of BAP on shoot formation might be related to the faster metabolism of BAP by plant tissues compared with other synthetic growth regulators.
The long circumstances of each explant’s shoots vary. This can happen because the absorption of nutrients for regeneration varies depending on the explant. Shoots explant with no new shoot growth and a length of buds are conceivable because there is still sufficient nutritional content from the previous culture on the body of the explant. The appropriateness of the regulatory compounds administered during multiplication can also influence the length of the shoots. According to Buko and Trine (2020), the number of internodes indicates a potential mass increase because each node usually has at least one axillary shoot.
The number of shoots was calculated after 4 weeks of initiation. The result revealed that the presence of 2,4-D alone had a substantial effect on the number of shoots generated. However, the single treatment of BAP and the interaction of BAP and 2,4-D gave no significant effect on the number of shoots.
Table 10 displays the result of the DMRT test on a single treatment of 2,4-D concentration. The treatment with 0.5; 1; 1.5; and 2 ppm showed no significantly different effect on the number of shoots formed. However, these treatments gave significantly different effects with treatment 2,4-D 0 ppm.
The parameter of the number of leaves can be observed right after observing the parameter of the number of shoots.
Khan et al. (2015) stated that various combinations of growth regulators influence the number of shoots. Accord-ing to the result, the treatment of BAP 2 ppm is the highest number of leaves observed. For this situation,
Batti et al. (2020) stated that the addition of exogenous auxin did not significantly affect the number of leaves formed because the plants already had sufficient amounts of endogenous auxin to trigger leaf formation.
Flavonoids have been found several times in various parts of
E. horsfieldii.
Mizuno et al. (1990) stated that a large number of flavonoid compounds can be found in the stems and roots of
E. horsfieldii. Matsuura (1994) also added that at least 60 types of flavonoid compounds can be obtained by extracting the roots and stems of
E. horsfieldii. The treatment without additional growth regulators has the highest content of flavonoids caused by the hormone stress conditions in B0D0 treatment which is pure MS media that can trigger the formation of flavonoid compounds better than planting in the field which is not under stress con-ditions. According to Setyorini and Kusnawan (2016), flavonoid compounds are formed when there is an increase in the activity of the phenylalanine ammonia-lyase (PAL) enzyme as a defense action of plant tissue from both biotic and abiotic stresses.
The results of the analysis indicated that in vitro cultivation was able to produce more types of active compounds than cultivation in the field. This is thought to be caused by differences in the organs used as samples and the presence of a self-protection system formed in the plantlets after explant injury. The GCMS method has pre-viously been applied to
E. horsfieldii field plants. Accord-ing to
Tirta et al. (2015), active compounds found in the leaves of
E. horsfieldii include apigenin, palmitic acid, 2-Tridecanone, 4-Ethyloctane, 4-propylheptadecane, and antioxidants as much as 196.94 ppm. Trujillo-Chacon
et al. (2019) explained that the differences in the active com-pounds possessed by field plants and plantlets were caused by the activity of cytokinins and auxins which not only affected cell differentiation and proliferation but also affected cell biosynthetic pathways.
Benzene ethyl with the compound formula C
8H
10 is a single-ringed alkyl aromatic organic compound that is flammable, colorless, and gene-rally smells like gasoline. In the industrial sector, according to
Gaurh and Pramanik (2018),
Benzene ethyl has uses as a basic ingredient in the manufacture of paint, paper, and plastic.
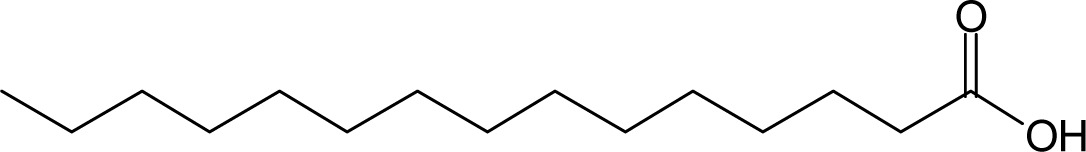
Another compound found in both types of samples is
pentadecanoic acid.
Pentadecanoic acid is a saturated fatty acid with the compound formula C
15H
30O
2. Saturated fatty acids concerning human health, have anti-bacterial and anti-fungal activities. Fatty acids effectively help in the prevention and management of diseases associated with pathology. According to
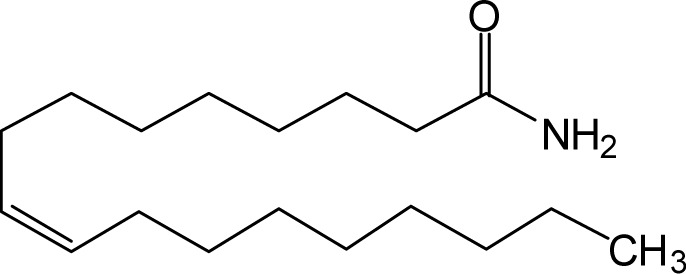
To et al. (2020) pentadecanoic acid is also known to be used in the prevention of coronary heart disease and breast cancer. 9-octadecenamide com-pound or also called oleamide is an organic compound with many benefits that can be found in both animals and plants.
Hachisu et al. (2015) explained that oleamide is a pro-tective agent against memory loss in Alzheimer’s disease and can increase drowsiness cause deep sleep, increase appetite, and has no side effects on blood pressure, heart rate, and body temperature. According to
Ameamsri et al. (2021), oleamide exhibits anti-inflammatory effects and has been used in the prevention and treatment of various diseases such as atherosclerosis, arthritis, and cancer through its metabolic conversion activity.
According to
Falowo et al. (2017), siloxane compounds are compounds that have high antioxidant activity and play an active role as anti-microbials. The types of siloxane com--pounds identified in this study include
Cyclooctasiloxane hexadecamethyl, Octadecamethyl-cyclonasiloxane, and
Eico-samethyl-cyclodecasiloxane. Furthermore,
Sahab et al. (2018) explained that
Cyclooctasiloxane hexadecamethyl is an essential organic compound that can act as an anti-fungal. Another siloxane compound found in the field samples is
Cyclododecasiloxane tetracosamethyl.
CONCLUSIONS
Callus and shoots of E. horsfieldii can be obtained by combining BAP and 2,4-D. The callus appearance time of E. horsfieldii is around 5 to 9 days after initiation. The callus is mostly compact textured and green-colored. Single treatment of BAP and 2,4-D was significantly affecting the shoots forming. The concentration of 2,4-D 0 ppm gave the highest average plantlet height by 2.67 cm, increasing the number of shoots by 2.00, and the number of leaves by 5.60. The average E. horsfieldii shoots appear-ance time is ranged from 4.67-25 days after the initiation. E. horsfieldii cultured in vitro without additional growth regulators had a higher flavonoid content with a value of 4.35%. The in vitro cultivation of E. horsfieldii was able to produce more types of active compounds than cultivation in the field.
ACKNOWLEDGEMENTS
The authors would like to thank Sebelas Maret University for funding the Domestic Universities Colla-borative Research.
Fig. 1Histogram of callus appearance time of E. horsfieldii at 8 WAP. B0D0: 0 ppm BAP + 0 ppm 2,4-D, B0D1: 0 ppm BAP + 0.5 ppm 2,4-D, B0D2: 0 ppm BAP + 1 ppm 2,4-D, B0D3: 0 ppm BAP + 1.5 ppm 2,4-D, B0D4: 0 ppm BAP + 2 ppm 2,4-D, B1D0: 0.5 ppm BAP + 0 ppm 2,4-D, B1D1: 0.5 ppm BAP + 0.5 ppm 2,4-D, B1D2: 0.5 ppm BAP + 1 ppm 2,4-D, B1D3: 0.5 ppm BAP + 1.5 ppm 2,4-D, B1D4: 0.5 ppm BAP + 2 ppm 2,4-D, B2D0: 1 ppm BAP + 0 ppm 2,4-D, B2D1: 1 ppm BAP + 0.5 ppm 2,4-D, B2D2: 1 ppm BAP + 1 ppm 2,4-D, B2D3: 1 ppm BAP + 1.5 ppm 2,4-D, B2D4: 1 ppm BAP + 2 ppm 2,4-D, B3D0: 1.5 ppm BAP + 0 ppm 2,4-D, B3D1: 1.5 ppm BAP + 0.5 ppm 2,4-D, B3D2: 1.5 ppm BAP + 1 ppm 2,4-D, B3D3: 1.5 ppm BAP + 1.5 ppm 2,4-D, B3D4: 1.5 ppm BAP + 2 ppm 2,4-D, B4D0: 2 ppm BAP + 0 ppm 2,4-D, B4D1: 2 ppm BAP + 0.5 ppm 2,4-D, B4D2: 2 ppm BAP + 1 ppm 2,4-D, B4D3: 2 ppm BAP + 1.5 ppm 2,4-D, B4D4: 2 ppm BAP + 2 ppm 2,4-D.
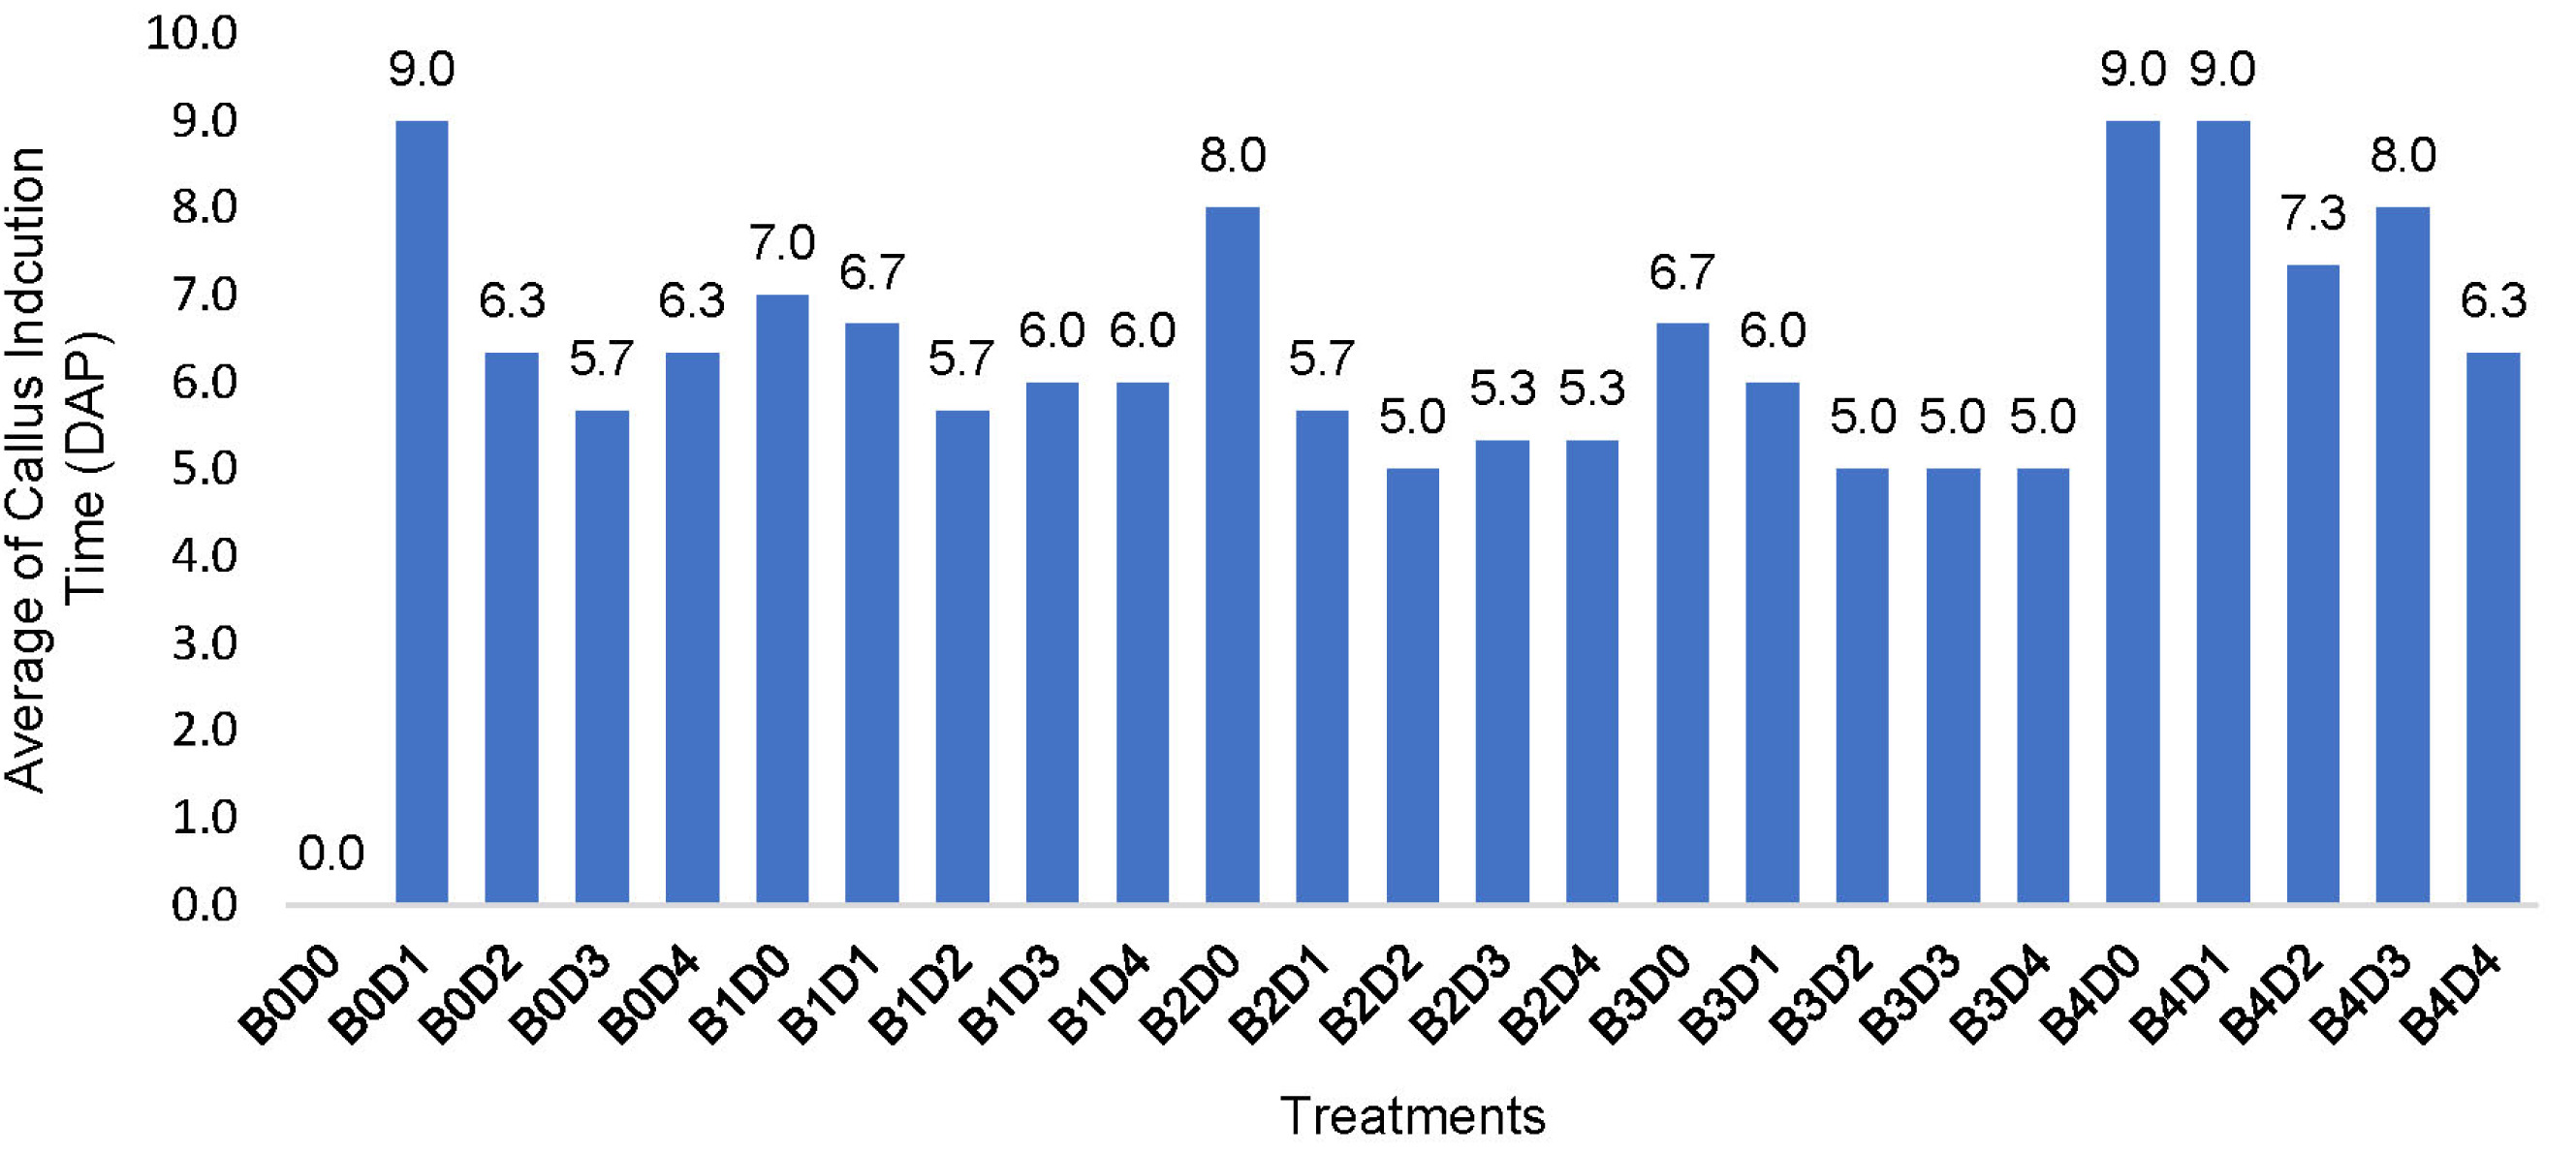
Fig. 2Texture of E. horsfieldii calluses, (a) compact callus on treatment BAP 1 ppm + 2,4-D 1 ppm, (b) fri-able callus on treatment BAP 0 ppm + 2,4-D 2 ppm.

Fig. 3Color of E. horsfieldii calluses, (a) whitish green callus, (b) white callus, (c) yellowish green callus, (d) green callus, (e) brownish green callus.
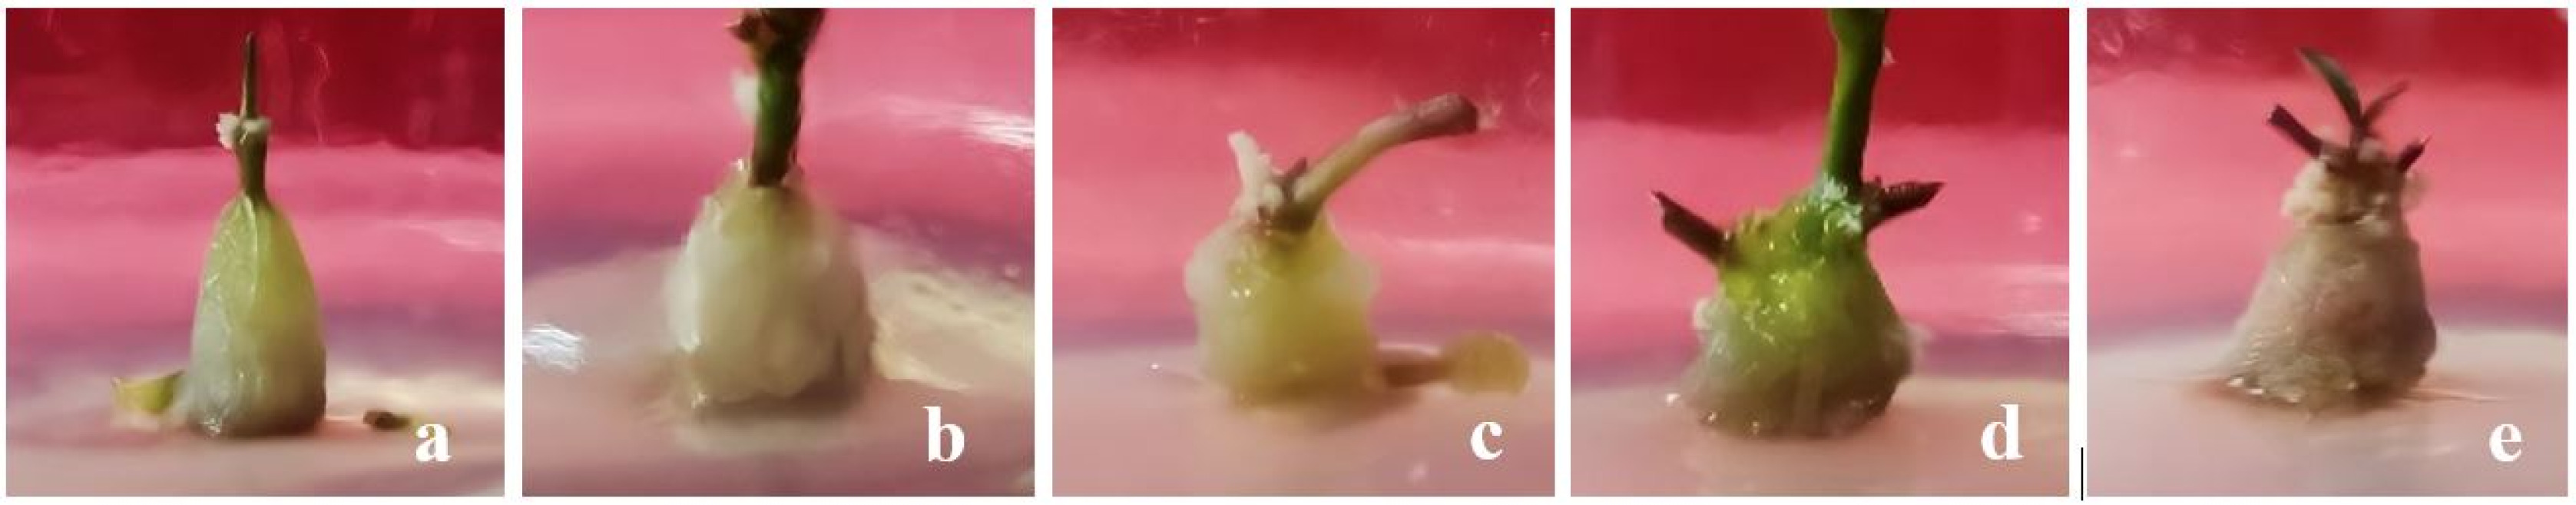
Fig. 4Average of E. horsfieldii fresh callus weight.

Fig. 5Average of E. horsfieldii dry callus weight.
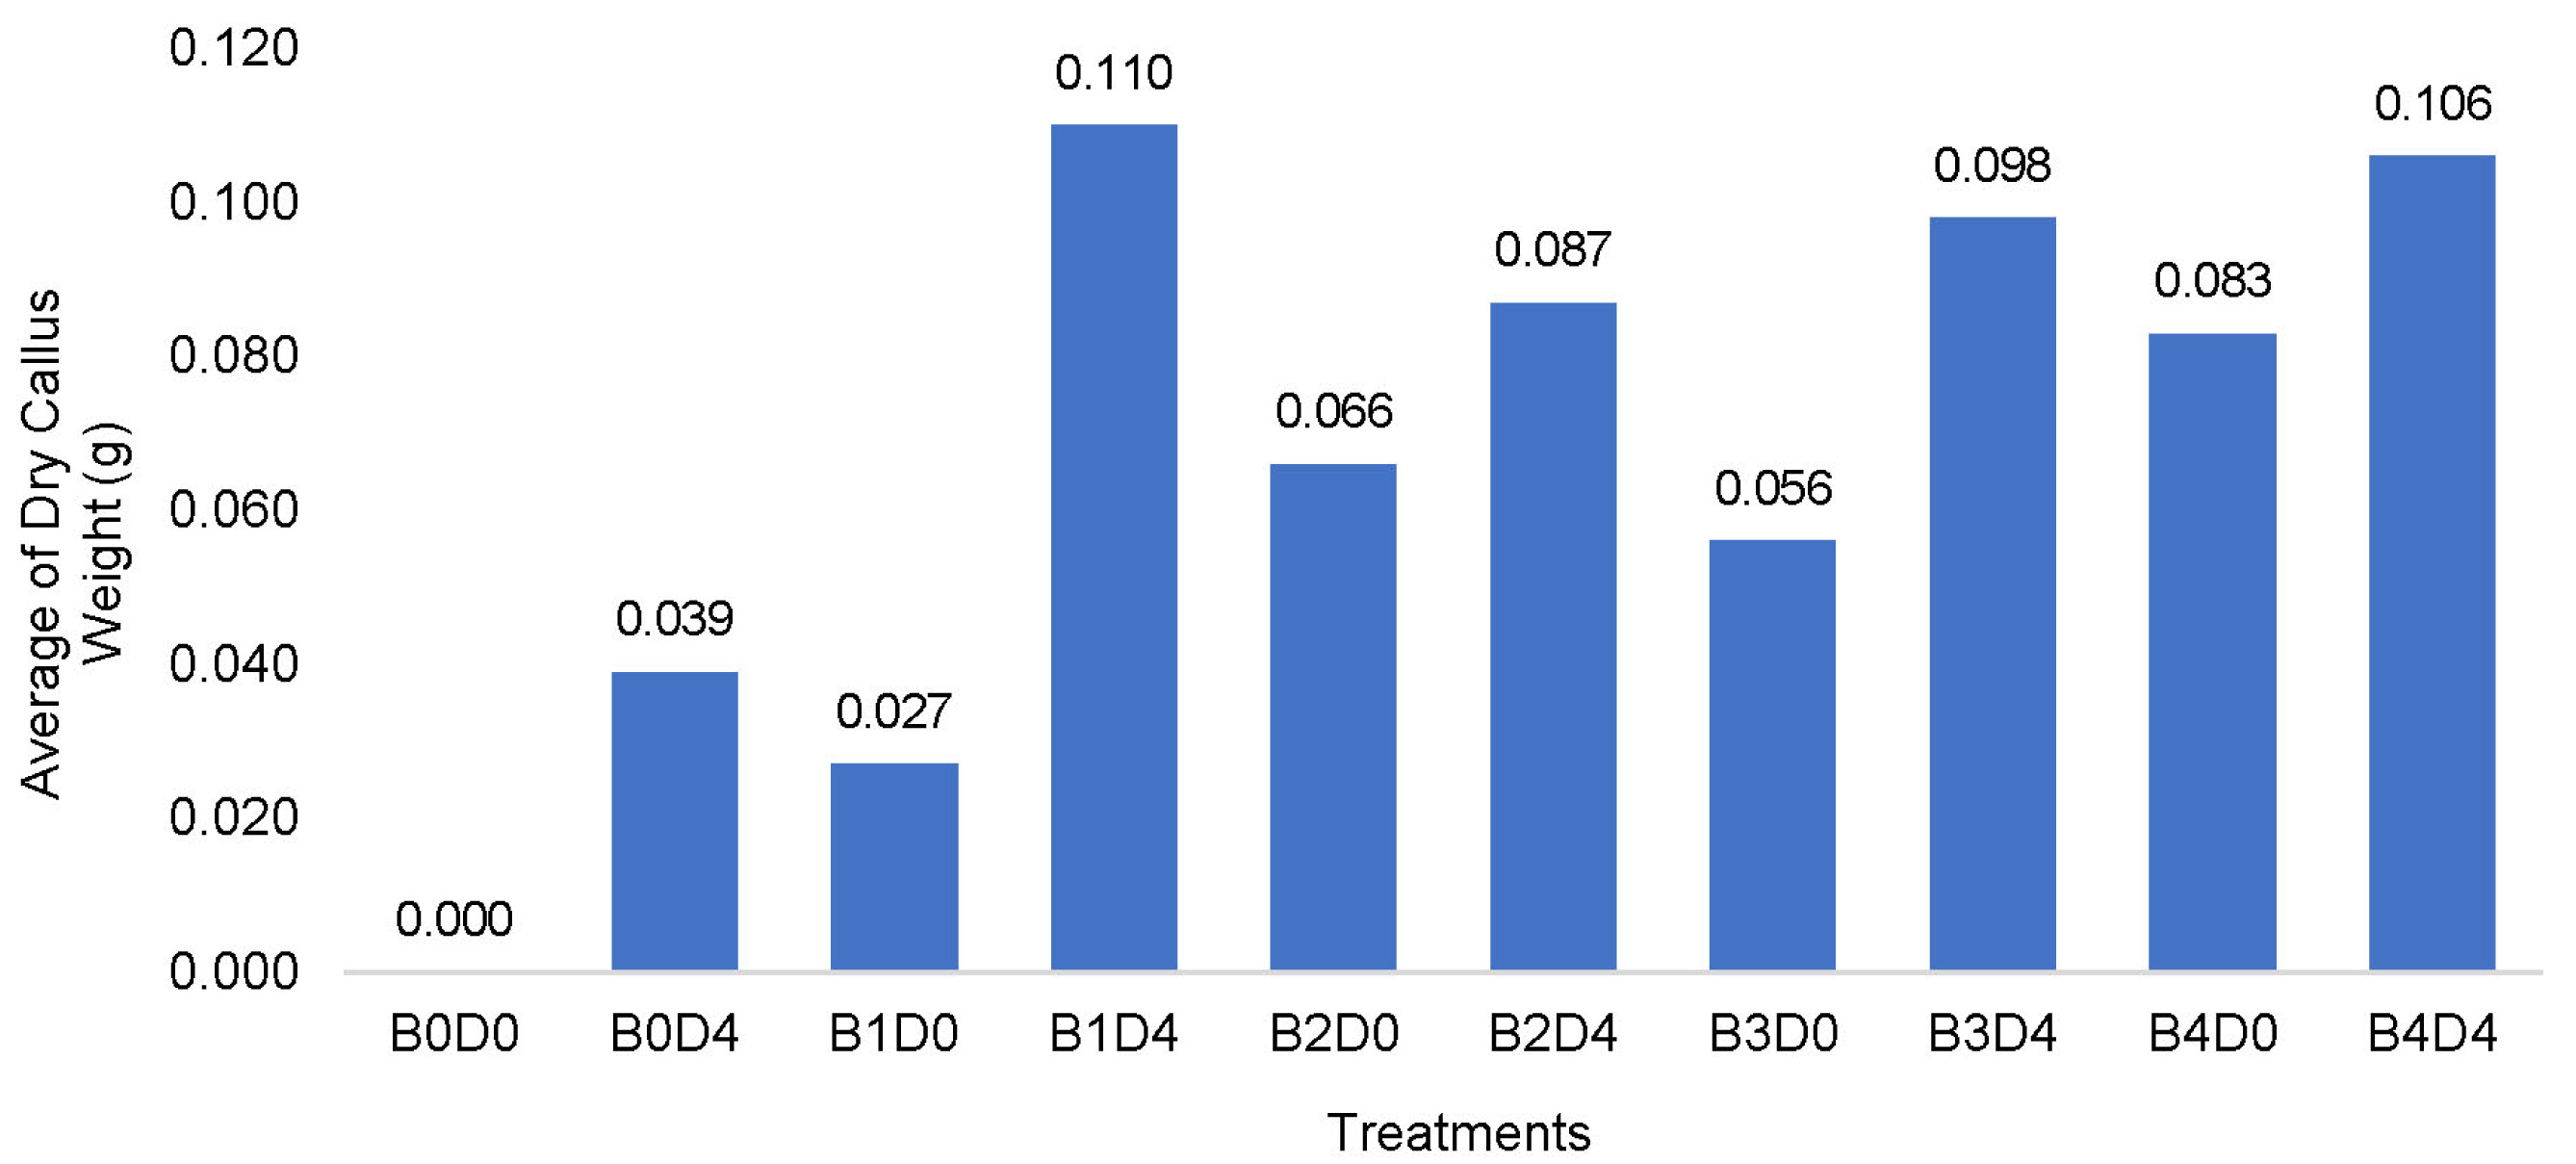
Fig. 6Percentage of E. horsfieldii formed shoots.

Fig. 7Shoot appearance time of E. horsfieldii.

Table 1The average percentage of E. horsfieldii callus induction at single treatment of BAP and 2,4-D concentration.
Table 1
|
2,4-D (ppm) |
BAP (ppm) |
2,4-D Average |
|
0 |
0.5 |
1 |
1.5 |
2 |
|
0 |
33.3 |
33.3 |
100 |
100 |
100 |
73.33a
|
|
0.5 |
66.6 |
100 |
100 |
100 |
100 |
93.33b
|
|
1 |
100 |
100 |
100 |
100 |
100 |
100b
|
|
1.5 |
100 |
100 |
100 |
100 |
100 |
100b
|
|
2 |
100 |
100 |
100 |
100 |
100 |
100b
|
|
BAP average |
80a
|
80.67ab
|
100b
|
100b
|
100b
|
- |
Table 2
E. horsfieldii callus texture at 8 WAP.
Table 2
|
2,4-D (ppm) |
BAP (ppm) |
|
0 |
0.5 |
1 |
1.5 |
2 |
|
0 |
- |
Compact |
Compact |
Compact |
Compact |
|
0.5 |
Friable |
Compact |
Friable |
Compact |
Compact |
|
1 |
Friable |
Friable |
Friable |
Compact |
Compact |
|
1.5 |
Friable |
Compact |
Friable |
Compact |
Compact |
|
2 |
Friable |
Compact |
Compact |
Compact |
Compact |
Table 3
E. horsfieldii callus colors at 8 WAP.
Table 3
|
2,4-D (ppm) |
BAP (ppm) |
|
0 |
0.5 |
1 |
1.5 |
2 |
|
0 |
- |
Brownish green |
Whitish Green |
White |
White |
|
0.5 |
Green |
Green |
Green |
Green |
Yellowish green |
|
1 |
Green |
Green |
Brownish green |
Brownish green |
Brownish green |
|
1.5 |
Green |
Brownish green |
Brownish green |
Brownish green |
Brownish green |
|
2 |
Green |
Green |
Green |
Yellowish green |
Brownish green |
Table 4Average percentage of E. horsfieldii shoots forming at single treatment of BAP and 2,4-D concentration.
Table 4
|
2,4-D (ppm) |
BAP (ppm) |
2,4-D Average |
|
0 |
0.5 |
1 |
1.5 |
2 |
|
0 |
100 |
100 |
100 |
100 |
100 |
100.00c
|
|
0.5 |
0 |
0 |
33.3 |
66.6 |
100 |
40.00b
|
|
1 |
0 |
0 |
33.3 |
33.3 |
66.6 |
26.67ab
|
|
1.5 |
33.3 |
0 |
0 |
0 |
66.6 |
20.00ab
|
|
2 |
33.3 |
0 |
0 |
0 |
0 |
6.67a
|
|
BAP average |
33.33a
|
20.00a
|
33.33a
|
40.00a
|
66.67b
|
- |
Table 5Average height of E. horsfieldii at single treatment of BAP and 2,4-D concentration.
Table 5
|
2,4-D (ppm) |
BAP (ppm) |
2,4-D Average |
|
0 |
0.5 |
1 |
1.5 |
2 |
|
0 |
2.00 |
2.17 |
3.33 |
2.50 |
2.83 |
2.67c
|
|
0.5 |
0.00 |
0.00 |
0.67 |
1.17 |
2.00 |
0.77b
|
|
1 |
0.00 |
0.00 |
0.33 |
0.33 |
1.17 |
0.37ab
|
|
1.5 |
0.33 |
0.00 |
0.00 |
0.00 |
1.00 |
0.27a
|
|
2 |
0.33 |
0.00 |
0.00 |
0.00 |
0.00 |
0.07a
|
|
BAP average |
0.53a
|
0.43a
|
0.87a
|
0.80a
|
1.40b
|
- |
Table 6Average number of E. horsfieldii leaves at single treatment of BAP and 2,4-D concentration.
Table 6
|
2,4-D (ppm) |
BAP (ppm) |
2,4-D Average |
|
0 |
0.5 |
1 |
1.5 |
2 |
|
0 |
2.67 |
4.00 |
6.67 |
6.00 |
8.67 |
5.60c
|
|
0.5 |
0.00 |
0.00 |
0.67 |
3.33 |
5.33 |
1.87b
|
|
1 |
0.00 |
0.00 |
1.33 |
0.67 |
1.33 |
0.67a
|
|
1.5 |
0.67 |
0.00 |
0.00 |
0.00 |
2.67 |
0.67a
|
|
2 |
0.67 |
0.00 |
0.00 |
0.00 |
0.00 |
0.13a
|
|
BAP average |
0.80a
|
0.80a
|
1.73ab
|
2.00b
|
3.60c
|
- |
Table 7Flavonoid compound on field and callus samples of E. horsfieldii.
Table 7
|
Sample |
Flavonoid compound (% b/b) |
|
Field |
3.27 |
|
B0D0 |
4.35 |
|
B0D4 |
1.61 |
|
B1D0 |
2.10 |
|
B1D4 |
1.94 |
|
B2D0 |
2.87 |
|
B2D4 |
1.79 |
|
B3D0 |
2.88 |
|
B3D4 |
1.87 |
|
B4D0 |
2.98 |
|
B4D4 |
1.97 |
Table 9Average of E. horsfieldii callus fresh weight at single treatment of BAP and 2,4-D concentration.
Table 9
|
2,4-D (ppm) |
BAP (ppm) |
2,4-D Average |
|
0 |
0.5 |
1 |
1.5 |
2 |
|
0 |
0.07 |
0.37 |
0.77 |
0.70 |
2.01 |
0.78a
|
|
0.5 |
0.09 |
0.12 |
0.66 |
0.69 |
0.70 |
0.45a
|
|
1 |
0.13 |
0.33 |
0.98 |
0.77 |
1.63 |
0.77a
|
|
1.5 |
0.85 |
1.61 |
2.17 |
0.97 |
3.47 |
1.81b
|
|
2 |
0.81 |
3.61 |
2.16 |
1.96 |
2.97 |
2.30b
|
|
BAP average |
0.40a
|
1.20b
|
1.35b
|
1.02ab
|
2.16c
|
- |
Table 10Average number of E. horsfieldii shoots formed at single treatment of 2,4-D concentration.
Table 10
|
2,4-D concentration (ppm) |
Number of shoots |
|
0 |
2.00b
|
|
0.5 |
0.53a
|
|
1 |
0.20a
|
|
1.5 |
0.27a
|
|
2 |
0.07a
|
References
- Api AM, Belsito D, Botelho D, Bruze M, Buschmann J, et al. Burton JrGA2019. RIFM fragrance ingredient safety assessment, 4-methyl-2-pentanone, CAS Registry Number 108-10-1. Food Chem. Toxicol.. 130(110587): 1-10.
- Abdelmaksood AWM, Zavdetovna KL, Arnoldovna TO. 2017. Effect of different plant growth regulators on the in vitro induction and maintenance of callus from different explants of Hyoscyamus muticus L. J. Appl. Environ. Biol. Sci.. 7(3): 27-35.
- Ahmad N, Khan MR, Shah SH, Zia MA, Hussain I, Muhammad A, et al. 2020. An efficient and reproducible tissue culture procedure for callus induction and multiple shoots regeneration in groundnut (Arachis hypogaea L.). J. Anim Plant Sci.. 30(6): 1540-1547.
- Ameamsri U, Chaveerach A, Sudmoon R, Tanee T, Peigneur S, Tytgat J. 2021. Oleamide in ipomoea and dillenia species and inflammatory activity investigated through ion channel inhibition. Curr. Pharm. Biotechnol.. 22(2): 254-261.
- Batti JR, Larekeng SH, Arsyad MA, Restu M. 2020. In vitro growth response on three provenances of Jabon Merah based on auxin and cytokinin combinations. Environ. Earth Sci.. 486(1): 012088. IOP.
- Bidabadi SS, Jain SM. 2020. Cellular, molecular, and physiological aspects of in vitro plant regeneration. Plants.. 9(6): 702
- Buko DH. TAK Hvoslef-Eide2020. Optimization of plant growth regulators for meristem initiation and subsequent multiplication of five virus-tested elite sweet potato varieties from Ethiopia. Afr. J. Biotechnol.. 19(6): 332-343.
- Cai X, Wei H, Liu C, Ren X, Thi LT, Jeong BR. 2020. Synergistic effect of NaCl pretreatment and PVP on browning suppression and callus induction from petal explants of Paeonia lactiflora Pall. . Plants.. 9(3): 346
- Castro AHF, Braga KDQ, Sousa FMD, Coimbra MC, Chagas RCR. 2016. Callus induction and bioactive phenolic compounds production from Byrsonima verbascifolia (L.) DC. (Malpighiaceae) 1. Rev. Cienc. Agron.. 47(1): 143-151.
- Chokeli VA, Rajput VD, Bakulin SD, Azarov AS, Varduni TV, Minkina TM. 2020. Recent development in micro-propagation techniques for rare plant species. Plants.. 9(12): 1733
- Dinesh RM, Patel AK, Vibha JB, Shekhawat S, Shekhawat NS. 2019. Cloning of mature pomegranate (Punica granatum) cv. Jalore seedless via in vitro shoot production and ex vitro rooting. Vegetos.. 32(2): 181-189.
- El Aouad BA, Aderdour T, Chetto O, Handaji N, Benkirane R, Benyahia H. 2019. Friable callus induction and organo-genesis conditions in a few strains of Poncirus Trifoliata. Plant Cell Biotechnol. Mol. Biol. 20(17-18): 734-745..
- Fadhilasari N, Prihastanti E, Nurchayati Y, Hastuti RB. 2018. The effect of explant age and BAP on in vitro callus development of mangrove plant (Rhizophora apiculata BI). Proceedings Book..
- Falowo A, Muchenje V, Hugo A, Aiyegoro O, Fayemi P. 2017. Antioxidant activities of Moringa oleifera L. and Bidens pilosa L. leaf extracts and their effects on oxidative stability of ground raw beef during refrigeration storage. CYTA J Food.. 15(2): 249-256.
- Gaurh P, Pramanik H. 2018. Production of benzene/toluene/ethyl benzene/xylene (BTEX) via multiphase catalytic pyrolysis of hazardous waste polyethylene using low cost fly ash synthesized natural catalyst. J. Waste Manag.. 77: 114-130.
- Gul N, Baig S, Ahmed R, Shahzadi I, Zaman I, Shah MM, et al. 2020. Conservation of an endangered medicinal tree species Taxus wallichian through callus induction and shoot regeneration. Plant Tissue Cult Biotechnol.. 30(1): 161-166.
- Hachisu M, Konishi K, Hosoi M, Tani M, Tomioka H, Inamoto A, et al. 2015. Beyond the hypothesis of serum anticholinergic activity in Alzheimer's disease: acetyl-choline neuronal activity modulates brain-derived neuro-trophic factor production and inflammation in the brain. J Neurodegener. Dis.. 15(3): 182-187.
- Karimi N, Behbahani M, Dini G, Razmjou A. 2018. Enhancing the secondary metabolite and anticancer activity of Echinacea purpurea callus extracts by treatment with biosynthesized ZnO nanoparticles. Nanosci. Nanotechnol.. 9(4): 1-10.
- Khan N, Maqsood A, Ishfaq H, et al. 2015. Optimizing the concentrations of plant growth regulators for in vitro shoot cultures, callus induction and shoot regeneration from calluses of grapes. J INT SCI VIGNE VIN.. 49(1): 37-45.
- Li C, Liu Y, Liu X, Mai KKK, Li J, Guo X, et al. 2021. Chloroplast thylakoid ascorbate peroxidase PtotAPX plays a key role in chloroplast development by decreasing hydrogen peroxide in Populus tomentosa. J. Exp. Bot.. 72(12): 4333-4354.
- Ling WT, Liew FC, Lim WY, Subramaniam S, Chew BL. 2018. Shoot induction from axillary shoot tip explants of fig (Ficus carica) CV. Japanese BTM 6. Trop. Life Sci. Res.. 29(2): 165
- Matsuura N, Iinuma M, Tanaka T. 1994. Phylogenetic analysis in genus Euchresta based on secondary metabolites. Biochem. Syst. Ecol.. 22(6): 621-629.
- Mizuno M, Matsuura N, Iinuma M, Tanaka T, Phengklai C. 1990. Isoflavones from stems of Euchresta horsfieldii. Phytochemistry.. 29(8): 2675-2677.
- Osman NI, Sidik NJ, Awal A. 2016. Effects of variations in culture media and hormonal treatments upon callus induction potential in endosperm explant of Barringtonia racemosa L. Asian Pac. J. Trop. Biomed.. 6(2): 143-147.
- Paramartha AI, Dini E, Siti N. 2012. Pengaruh penambahan kombinasi konsentrasi ZPT NAA dan BAP terhdap pertumbuhan dan perkambangan 29 biji Dendrobium taurulinum J.J Smith secara in vitro. J Sains dan Seni ITS.. 1(1): 40-41.
- Rasud Y, Bustaman B. 2020. Induksi kalus secara in vitro dari daun cengkeh (Syizigium aromaticum L.) dalam media dengan berbagai konsentrasi auksin. J. Ilmu Pertanian Indonesia.. 25(1): 67-72.
- Robles-Martinez M, Gueroud F, Negre-Salvayre A, Rossognol M, Santos-Diaz MS. Barba-de la Rosa AP2016. Establishment of callus and cell suspensions of wild and domesticated Opuntia Species: Study on their potential as a source of metabolite production. Plant Cell Tissue Organ Cult.. 124(1): 181-189.
- Sahab A, Sidkey N, Abed N, Mounir A. 2018. Application of anise and rocket essential oils in preservation of old manuscripts against fungal deterioration. Int. J. Conserv. Sci.. 9(2): 235-244.
- Salim SA, Hamza SY, Habeeb MS. 2019. Enhancement of Gardenia jasminoides Ellis friable callus growth and its constituents of some bioactive compounds. Plant Arch.. 19(2): 398-402.
- Setyorini SD, Yustiawan E. 2016. Peningkatan kandungan metabolit sekunder tanaman aneka kacang sebagai respon cekaman biotik. J Iptek Tananaman Pangan.. 11(2): 167-174.
- Laily M. Sutomo.2010. Autekologi purnajiwa (Euchresta horsfieldii (Lesch. ) Benn. (fabaceae) di sebagian kawasan hutan bukit tapak cagar alam batukahu bali. J. Biol. (1): 24-28.
- To NB, Nguyen YTK, Moon JY, Ediriweera MK, Cho SK. 2020. Pentadecanoic acid, an odd-chain fatty acid, sup-presses the stemness of MCF-7/SC human breast cancer stem-like cells through JAK2/STAT3 signaling. Nutrients.. 12(6): 1663
- Tirta IG, Ardaka IM, Darma ID. 2015. Studi fenologi dan senyawa kimia pronojiwo (Euchresta horsfieldii (Lesch. ) Benn.)..
- Bustamante L, Baeza M. Trujillo‐Chacon LMPastene‐Navarrete ERAlarcon‐Enos JECespedes‐Acuna CL2020. In vitro micropropagation and alkaloids analysis by GC-MS of Chilean Amaryllidaceae plants: Rhodophiala pratensis. Phytochem Anal.. 31(1): 46-56.
- Wu GY, Xiao LW, Xiao W, Yi W. 2020. Induction of somatic embryogenesis in different explants from Ormosia henryi Prain. Plant Cell Tissue Organ Cult.. 142(2): 229-240.
- Wu, Z.Y. Y.