Abstract
Peanut (Arachis hypogaea L.) is an important oilseed, cash crop grown worldwide mainly in a tropical and subtropical climate. Drought stress (DS) is one of the serious abiotic stresses that alter the morphological, physiological, biochemical and molecular responses of plants and causes huge production loss across the globe. The aim of this study, to investigate the twenty widely grown Korean genotypes at the seedling stage under the control and drought stress conditions, to identify tolerant lines as well as related traits. In addition, the influence of DS and rehydration or recovery after stress on peanut genotypes was also studied. Initial screening showed that given genotypes had a differential response to DS, demonstrating a wide range of variation in tested peanut genotypes during the seedling stage towards the DS. Further, based on investigation of the different growth attributes and biochemical assessment six genotypes (Palkwang, Milkwang, and Daekwang) and (Daekwang, Haeol, and Heukhwaseang) were observed as drought-tolerant and drought-sensitive lines respectively. The findings of this study will aid in the selection of peanut genotypes in future breeding efforts aimed at improving drought tolerance and minimizing peanut production loss.
-
Key words: Peanut, Genotypes, Seedling stage, Drought stress, Tolerance, Plant attributes
INTRODUCTION
Peanut (
Arachis hypogaea L.) is an important oilseed, cash crop from the Fabaceae family grown worldwide, mainly in a tropical and subtropical climate. Peanut is a rich source of edible oil, protein for humans and is used as food and forage for livestock (
Janila et al. 2013;
Bacharou Falke et al. 2019). Approximately 60% of the world’s peanut cultivation comes from Asia, Africa, and America, which is considered as most vulnerable to climate change and recognized as prevalent to drought, high temperature, and salt area (
Mace et al. 2006;
Cuc et al. 2008).
Climate change is a serious challenge to crops as well as humanity. Plants are immovable and subjected to expose more frequently by abiotic stresses such as drought, salinity, temperature, metal, and flood during their life cycle. The land worldwide is approximately 20% under drought stress, making it one of the most significant environmental constraints to crop productivity. Drought is one of the most common abiotic stresses causing physiological, biochemical, morphological and molecular changes in plants. Due to climate change, drought is vastly affecting agricultural practices all over the world. Typically, drought stress negatively influences crop quality as well as production, thereby food security. Drought stress is predicted to cause an annual crop loss of 6 million tons worth roughly 520 million dollars (
Bhatnagar-Mathur et al. 2008;
Rahdari and Hoseini 2012;
Sharma et al. 2012;
Zlatev and Lidon 2012;
Bacharou Falke et al. 2019;
Nabi et al. 2020). Although several studies were conducted on plant drought responses, very few studies reported long-term consequences of drought on plant cultivation leading to crop failure (Tayade
et al.
Rahdari and Hoseini 2012;
Zlatev and Lidon 2012;
Nabi et al. 2019b). Plants have developed several mechanisms such as escape or avoidance, tolerance and adaptive mechanisms to combat drought stress. These mechanisms include stomatal conductance, osmotic adjustment, antioxidant, and hormonal production which leads to protecting plants from oxidative damage to enhance the plant’s survival underexposed drought stress (
Nogueira and Santos 2000;
De Azevedo Neto et al. 2006;
Tayade et al. 2018). Thus, studying physiological and molecular genetics aspects may help researchers better understand plant drought stress responses that can lead to improving and developing new stress-tolerant cultivars.
In the climate change era, where frequent or consistent drought and increasing drought cultivation area is unavoidable. Thus, it’s highly desirable to develop peanut cultivars or varieties with improved drought tolerance. Breeding approaches for developing drought-tolerant peanuts have been explored by researchers (
Songsri et al. 2008; Wang X
et al. 2012;
Santos et al. 2013). Most breeding efforts are aiming to develop the new germplasm or varieties by improving phenotypic features, of desirable plants, which ultimately can withstand or adapt to adverse climate conditions without losing crop productivity. However, it had limited success due to the inheritance and complex genetic makeup of the trait (
Bhatnagar-Mathur et al. 2008;
Leal-Bertioli et al. 2015). In addition, drought trait is a quantitative trait and multiple genes are associated with drought stress tolerance; information about the QTLs that regulate drought stress tolerance in peanuts scares. Several studies have reported in peanut with an evaluation of physiological, biochemical, and agronomic traits to improve performance by selecting plants with good yield under drought conditions (
Janila et al. 2016).
The crop production is mainly depending on the water supply to crop begins with planting and continues through-out the life cycle until seed maturation. Morphological traits are commonly used to recognize and access for improved performance when developing new crop varieties (
Rosales-Martínez et al. 2014). Plant character-istics such as root architect including deep rooting, roots biomass density, roots distribution, and root angle (
Matsui and Singh 2003), play an essential role during drought stress these traits can be used as a drought-resistant selection criterion. In addition, shoot growth, chlorophyll content, antioxidant and secondary metabolites content also regulates drought stress and aid plants to combat drought stress. However, plant growth stages distinctly vary throughout life and there are no common morpholo-gical traits that can be associated with all plant’s growth stages, therefore dealing with individual traits would be a great approach (
Passioura 2012). Therefore, screening the plant materials or the available germplasms for the different traits would provide basic and precise knowledge that can help to design and use the potential plant material in breeding programs for climate-resilient, high-yielding crop development. A recent study (
Bacharou Falke et al. 2019) investigated new improved peanut varieties response to drought stress under controlled conditions to identify tolerant materials and drought tolerance-related traits. Plants exhibiting traits with better root architect, antioxidant, total water transpiration rate, chlorophyll content, showed association with drought tolerance.
The National Agrobiodiversity Center, Rural Develop-ment Administration (RDA), Republic of Korea RDA co-ordinate and conduct the breeding program of peanut improvement focused on the Korean environment. During the last 20 years, a number of intra and interspecific peanut breeding lines were developed through different crossing’s combination programs. Furthermore, field trials, agrono-mic performance and trait evaluation, selection was performed to identify high-yielding, agronomically suit-able peanut materials. Because of environmental influ-ences and the difficulty in determining the impacted plant growth stages under rain-fed environments, drought stress screening is difficult (
Tuberosa 2012). Our, aim of the current study was to evaluate drought effects on selected peanut genotypes under the control conditions to give uniform treatment for identifying precise tolerant geno-types by investigating physiological, morphological and biochemical attributes. The study would be useful to provide the template for developing high-yielding drought- tolerant peanut genotypes for advancing breeding schemes.
MATERIALS AND METHODS
Plant materials
Twenty peanut genotypes including widely grown genotypes of Korea with diverse morphological and physiological characteristics were used for the study (
Table 1). Seeds of the peanut genotypes (Daekwang (Variety), Palkwang (Variety), Mikwang (Variety), Akwang (Variety), Baekjung (Variety), Pungan (Variety), Jaseon (Variety), Sinpalkwang (Variety), Ami (Variety), Danwon (Variety), Daan (Variety), Ahwon (Variety), Tamsil (Variety), Sewon (Variety), Haeol (Variety), Udo.Coll (Germplasm), Heukhwaseang (Germplasm), Gochang.Coll (Germplasm), F435-5 (Germplasm), Tifton8 (Variety)) were obtained from the Rular Development gene bank (
http://genebank.rda.go.kr/), South Korea.
The experiment was performed at RDA, Crop breeding Research Division Miryanag, Gyeongnam South Korea. Peanut seeds were surface sterilized with 70% ethanol, wash 4-5 times, and kept in dark condition for 24 hours at 28℃, and then seeds were soaked in water for 24 hours for uniform germination. The experiment used a randomized block design (RBD) with four replications and three sets of plants per treatment. After the 24 hours uniformly germinated, seeds were sown in a mixture of vermiculite: perlite:peat moss (2:2:1) and pot (size: 90 mm × 80 mm). Subsequently, seeds were transferred to greenhouse control conditions. Particularly, all the seedlings were grown at 25-28℃ under long-day conditions (16-hours- light/8-hours-dark). After sowing, watering was done on a regular basis and all three sets of plants were treated equally until two weeks. Thereafter, two-week old peanuts grown in the greenhouse were restricted watering up to the next 15 days. Water regimes followed, as one set was used as a well-watered treatment (WW), and the other set was used as a drought-stress treatment (DS). During the pot ex-periment, evaluation of plants was conducted on both WW and DS plants.
Evaluations of plant growth attributes
Height of the plant (PH)
The plant height (PH) or main stem length was measured at drought and rescue or rehydration conditions. A measur-ing ruler was used to assess the height of peanut genotypes (KMT Korea Measuring ruler, KMT Co., Seoul, Korea). The height of the plant was determined from the ground to the axial top of the shoot.
Fresh shoot weight and root weight (FSW and FRW)
The peanut plant’s fresh shoot and root weight were recorded using a digital scale (Digital GSM scale, CAS Korea Co., Seoul, Korea). Briefly, WW and DS plants were gently uprooted from their pots. Plant roots were cleaned using tap water to remove soil particles properly and maximum care was taken to avoid the loss of roots. Investigation of carried out for shoot and root sections of the peanut plants separately.
Fresh shoot and root length (FSL and FRL)
Similarly, fresh shoot length (FSL) and fresh root length (FRL) were recorded for WW and DS plants; using an ordinary ruler (Digital GSM scale, CAS Korea Co., Seoul, Korea). Maximum care was taken while measuring the root and shoot length of WW and DS plants.
Area of the leaf (LA)
The total leaf area of peanut genotypes was recorded using the area meter (LI-3100C area meter, LI-COR Inc., Nebraska, USA). Plants of each pot were harvested and leaflets were removed before scanning in the leaf area meter, which displayed the total leaf area.
Total chlorophyll content (TCC)
The chlorophyll content of a fully matured leaf from different parts of plants (top, middle, and bottom) was investigated at the 3, 10 and 15 days after drought and rescue situations from both WW and DS plants. The SPAD meter (SPAD 502, Minolta Co., Tokyo, Japan) was used to measure the chlorophyll content of peanut plants. Four replicate measurements per plant were recorded and the average data were used to represent the results of each genotype.
Dry shoot and root weight (SDW and RDW)
The shoot and root sections from WW and DS peanut plants were oven-dried for 48 hours at 60℃ (VS-4150, Vision Scientific Co., Daejeon, Korea) (
Donnelly et al. 2018). The shoot and root dry weight (SDW and RDW) was determined after respective plant parts were oven- dried for 48 hours at 60℃.
Leaf wilting Index (LWI)
The leaf wilting was investigated and scored visually, following the total number of leaves per plant; the number of leaves showing wilting signs with the following wilting scale: Mai-Kodomi (MAIK) scale. The leaf wilting was categorized as based on previous reports described by (
Alidu et al. 2019). Briefly, the total number of leaves showing wilting signs, with 0 indicating that there is no wilting, 1 indicates that there is 25% wilting, 2 indicates 50% moderate wilting, 3 indicates 75% wilting (yellow and brown leaves), and 4 indicates full wilted leaves. Leaf wilting of plants was captured throughout the two-week DS experiment.
Measurements of relative water content (RWC)
The relative water content (RWC) of peanut plants, leaves was determined using the method previously reported (González-Vilar et al. 2003). RWC was measured using four leaflets from the top leaves of the main stem. Firstly, fresh weights (FW) of harvested leaves were recorded within 15 minutes, after which leaf samples were floated for 5 hours in 20 mL distilled water to achieve maximum turgidity and turgid weight (TW) was recorded. The leaflets were then oven-dried for 48 hours at 80℃, and their dry weight (DW) was recorded. The RWC of leaves was calculated using the formula mentioned below.
Measurement of transpiration rates
4-week-old plants, aerial structures were separated from their roots and held at room temperature. The leaves weight of each aerial structure was subsequently determined every 40 minutes over a period of 5 hours (
Kang et al. 2002). Each measurement was performed using eight plants per line. Experiments were repeated at least two times with similar results.
Quantification of antioxidant
Generally, plants counter oxidative stress by producing low molecular weight solutes such as flavonoids, and phenol. Thus, in this study, we evaluated flavonoid and polyphenol content using the spectrophotometric method described by (
Sirhindi et al. 2016;
Nabi et al. 2021).
Total flavonoid content
The total flavonoid content investigated for the peanut WW and DS plants as reported by (
Nabi et al. 2021; Ali
et al. 2017) with few changes. 300 mL of leaf tissue extract was combined with an equivalent volume of double- distilled water (ddH
2O), and 30 mL of 5% NaNO
2 was added. After a 5 minutes incubation period at room temperature, 60 mL of 10% AlCl
3 was added to the reaction mixture. Followed by another 5 minutes of incubation, 200 mL of 1 M NaOH was added to the mixture. Using a microplate spectrophotometer, the resultant extract was utilized to measure spectrophotometric absorbance at 500 nm (Multiskan GO Thermo Fischer Scientific, Vantaa, Finland). The quercetin standard was used for the calibration curve analysis. The total flavonoid content of a sample was calculated using micrograms garlic acid equivalent.
Total polyphenol oxidase (PPO)
The total polyphenol oxidase activity in leaves tissue was investigated according to the method described by (
Nabi et al. 2021). Briefly, peanut sample leaf (100 mg) tissue was homogenized with 10 mL 0.1 M potassium phosphate buffer (pH 6.8), 50 mL of H
2O
2 was also added to the extraction buffer. The resulting crude extract was centrifuged for 15 min at 5000 rpm and 4℃. Subsequently, 100 mL of the supernatant was transferred to another tube, and 50 mL of pyrogallol (50 mM) was added to it. The resulting solution mixture was incubated for 5 minutes at 25℃.The enzymatic reaction assay was stopped prior to absorbance using 5% 1 N H
2SO
4 (v/v) solution. The estimation was performed by measuring the absorbance at 420 nm using a spectrophotometer (Multiskan GO, Thermo Fischer Scientific, Vantaa, Finland). Total phenolic content was determined based on purpurogallin produced and estimated as a 0.1-unit increase in absorbance.
Statistical analysis
All of the experiments were carried out separately and three times each. GraphPad Prism software (Version 7.00, 1992-2016 GraphPad) was used to measure the data in triplicate and statistically evaluate it. To determine significant differences at a 5% level of significance, the data were evaluated for standard error (SE) and Student’s t-test.
RESULTS
Plant height
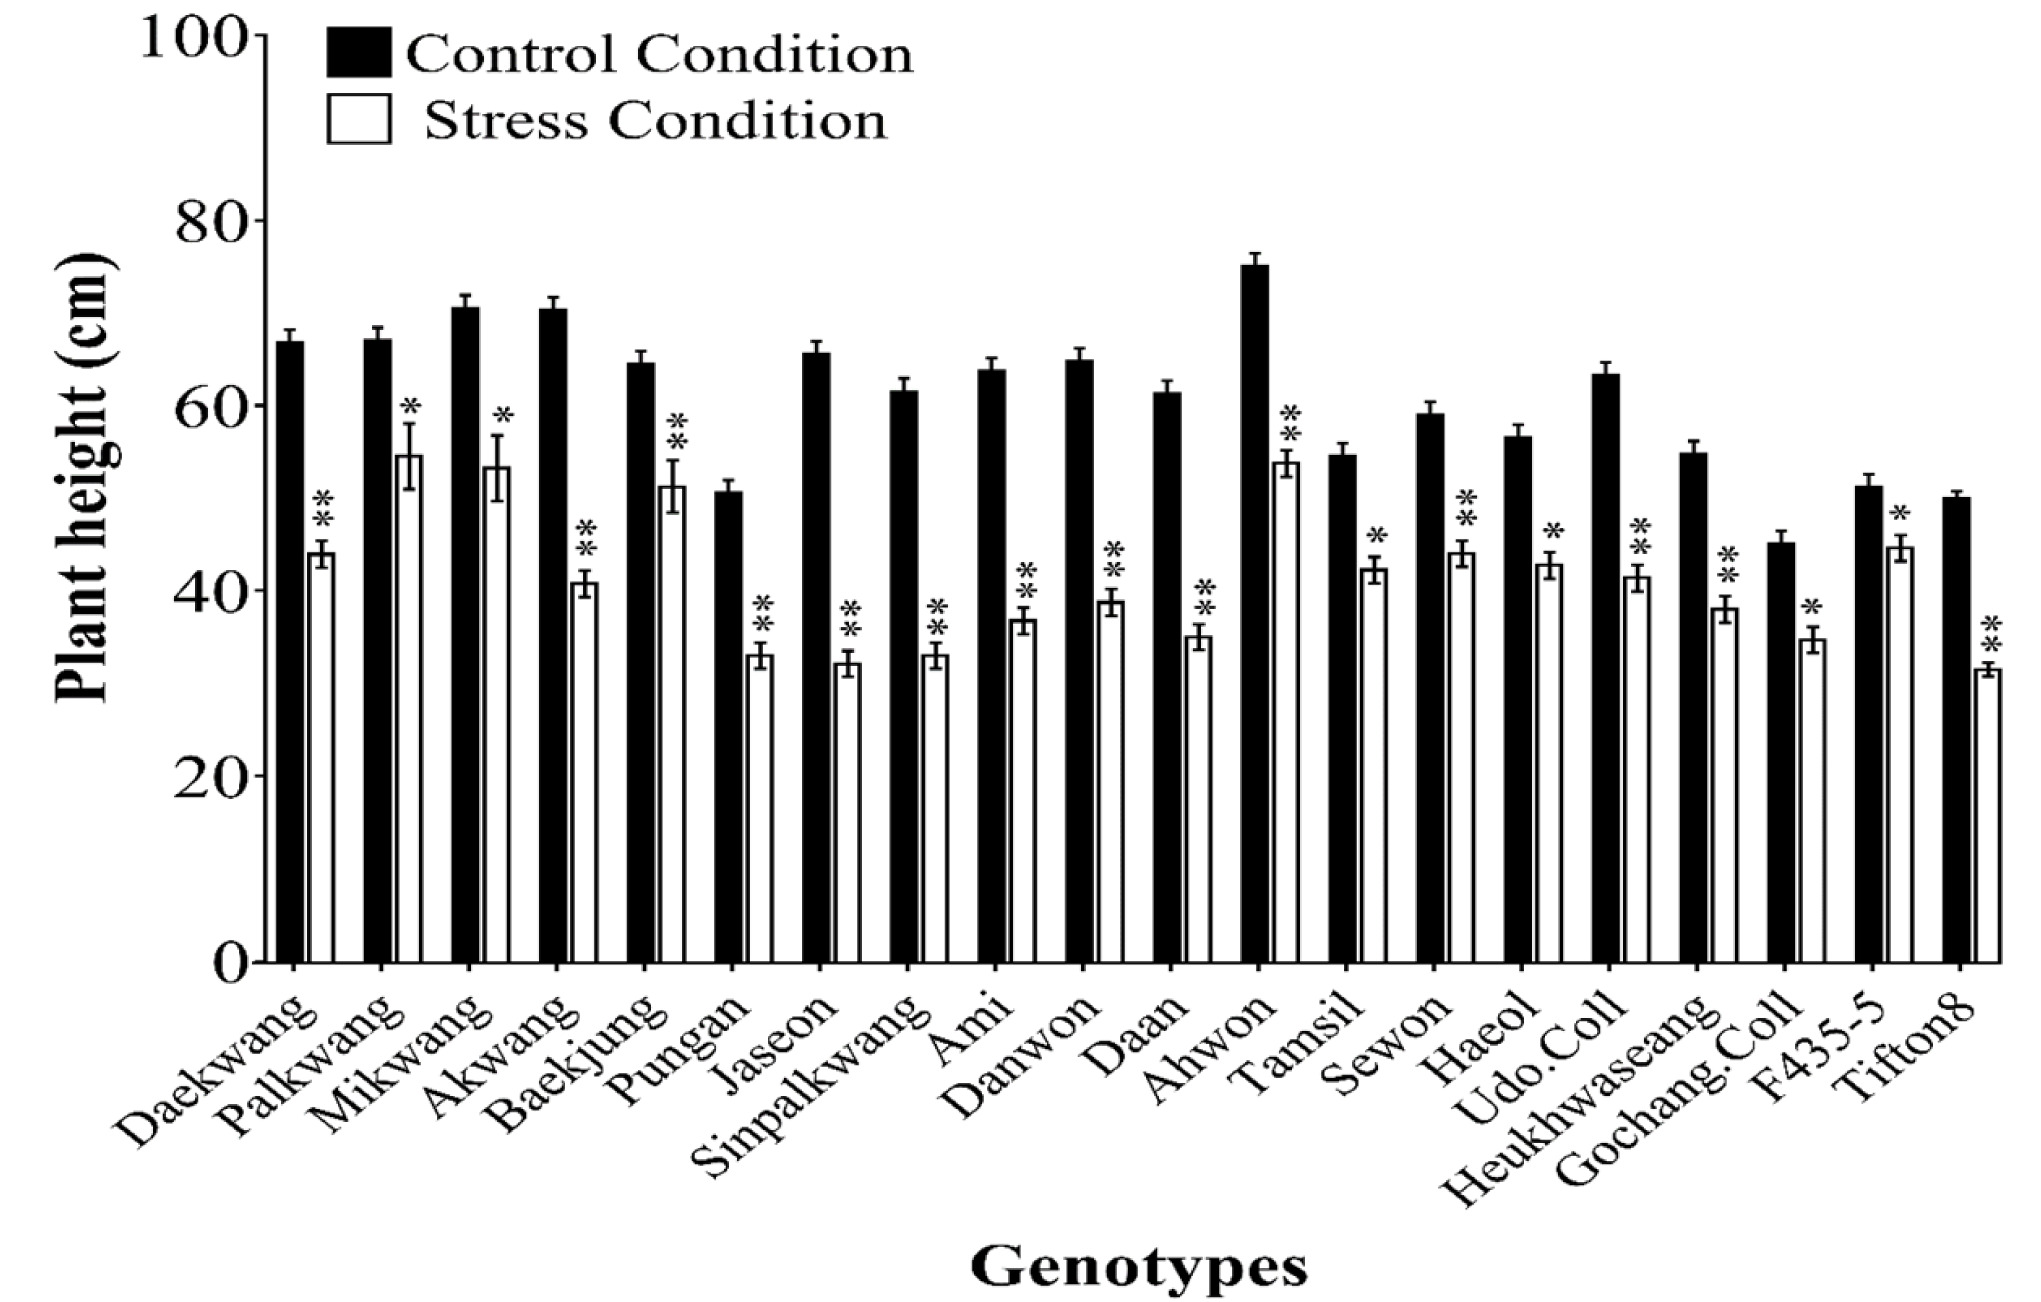
To investigate the drought effects on peanut plant growth and development, we measured plant height (PH) and compared the relative change of plant height under DS to WW conditions. Comparisons revealed that all the genotypes under DS showed a significant reduction in the PH (
Fig. 1) compared to WW control plants. Among all the genotypes F435-5, Palkwang, Baekjung, Mikwang, and Ahwon showed 12.87%, 18.66%, 20.55%, 24.47%, and 28.34%, reduction in the PH respectively compared to control condition plants. Whereas, Daan, Ami, Pungan, Sinpalkwang, and Jaseon, showed maximum reduction in the PH ranging from 34.66-51.0% under the DS compared to WW plants. These results indicated that DS inhibits plant growth by more or less percentage for all the genotypes.
The shoot length (SL) were analyzed and presented in (
Table 2). The results reveal that SL of given genotypes showed significant difference under DS condition compared to WW conditions. Peanut genotypes Akwang, F435-5, Ahwon, Palkwang, Mikwang, and Baekjung, showed 28.54%, 30.9%, 32.83%, 32,85%, 34.75% and 40.15% reduction in SL respectively compared to WW conditions control plants (
Table 2). On the other hand, Daekwang, Heukhwaseang, Pungan, Jaseon and Daan showed 50.1%, 51.18%, 51.82%, 57.84% and 63.07% reduction respectively in SL compared to WW conditions control plants. From these results, we identified genotypes that showed relatively less reduction in SL and had better performances for SL under the DS compared with the other genotypes (
Table 2). Further, the recovery rate was observed in tested genotypes, Daekwang (27.27%), Tifton8 (23.28%), Heukhwaseang (19%), Daan (18.05%) and Haeol (13.86%), showed a higher recovery rate than the genotypes Sinpalkwang (6.12%), Mikwang (5.19%), Tamsil (5.18%), Akwang (2%), Baekjung (0.05%) as well as compare to stressed plants (
Table 2).
Root length (RL) is one of the important traits in drought stress, commonly water and nutrient absorption regulated by root, RL and surface area plays an important role during absorption and transportation of water and nutrients. Therefore, we measured the RL and its significance under the DS experiment. We observed that all the genotypes showed a significant reduction in the RL under DS compared to the WW condition (
Table 2). Particularly, Sinpalkwang, Akwang, Jaseon, Palkwang, and Ami genotypes showed 58.54%, 52.15%, 50.34%, 44.31% and 37.02% reduction respectively compared to WW plants. Whereas, genotypes Haeol, Gochang.Coll, Baekjung, Tamsil, and Sewon showed 22.01%, 15.25%, 12.87%, 9.24%, and 7.24% reduction respectively compared to WW plants. However, under the rescue condition geno-types F435-5, Palkwang, Tifton8, Mikwang and Daekwang showed recovery 29.64%, 23.42%, 22.73%, 17.53% and 17.53% respectively compared to stressed plants. Whereas genotypes Akwang, Ahwon, Danwon, Sewon, and Haeol showed 7.69%, 6.60%, 6.20%, 2.94% and 2.76% recovery respectively compare to stressed plants.
Likewise, shoot and root weight between DS and WW condition were analyzed, and fresh shoot weight (FSW) and fresh root weight (FRW) were recorded (
Table 3). The results indicated that there was a significant reduction in FSW and FRW of genotypes under the DS compared to the WW condition. After 15 days of DS followed by rescue or rehydration, there was a noticeable change in FSW and FRW of the peanut genotypes. However, this change was not statistically significant compared to DS conditions (
Table 3). The genotypes under control WW condition showed more weight compared to stress condition and rescue condition or rehydration.
However, some genotypes showed a significant change in the FSW in rescue conditions compared with stress conditions. For example, genotypes Palkwang, Pungan, Jaseon, Sewon and F435-5, etc. showed the significant FSW in rescue condition (
Table 3).
One of the common indications of drought stress in plants is causes leaf wilting. The peanut genotypes showed a wide range of variation for leaf wilting index (LWI) in response to drought stress and after rescue or rehydration plants (
Fig. 2). After the DS, maximum LWI and the wilting symptom was observed in Daekwang, Ami, Danwon, Haeol and Daan genotypes compared to other genotypes (
Fig. 2B). Among all 20 genotypes Palkwang, Mikwang, Tamsil, Sewon and Baekjung showed very little LWI and observed, showed the maximum recovery from leaf wilting after rescue or rehydration of the plants post 15 days of DS. Whereas, genotypes Daekwang, Ami, and Daan showed sensitivity to drought and showed very less recovery of leaf wilting after rescue or rehydration plants (
Fig. 2).
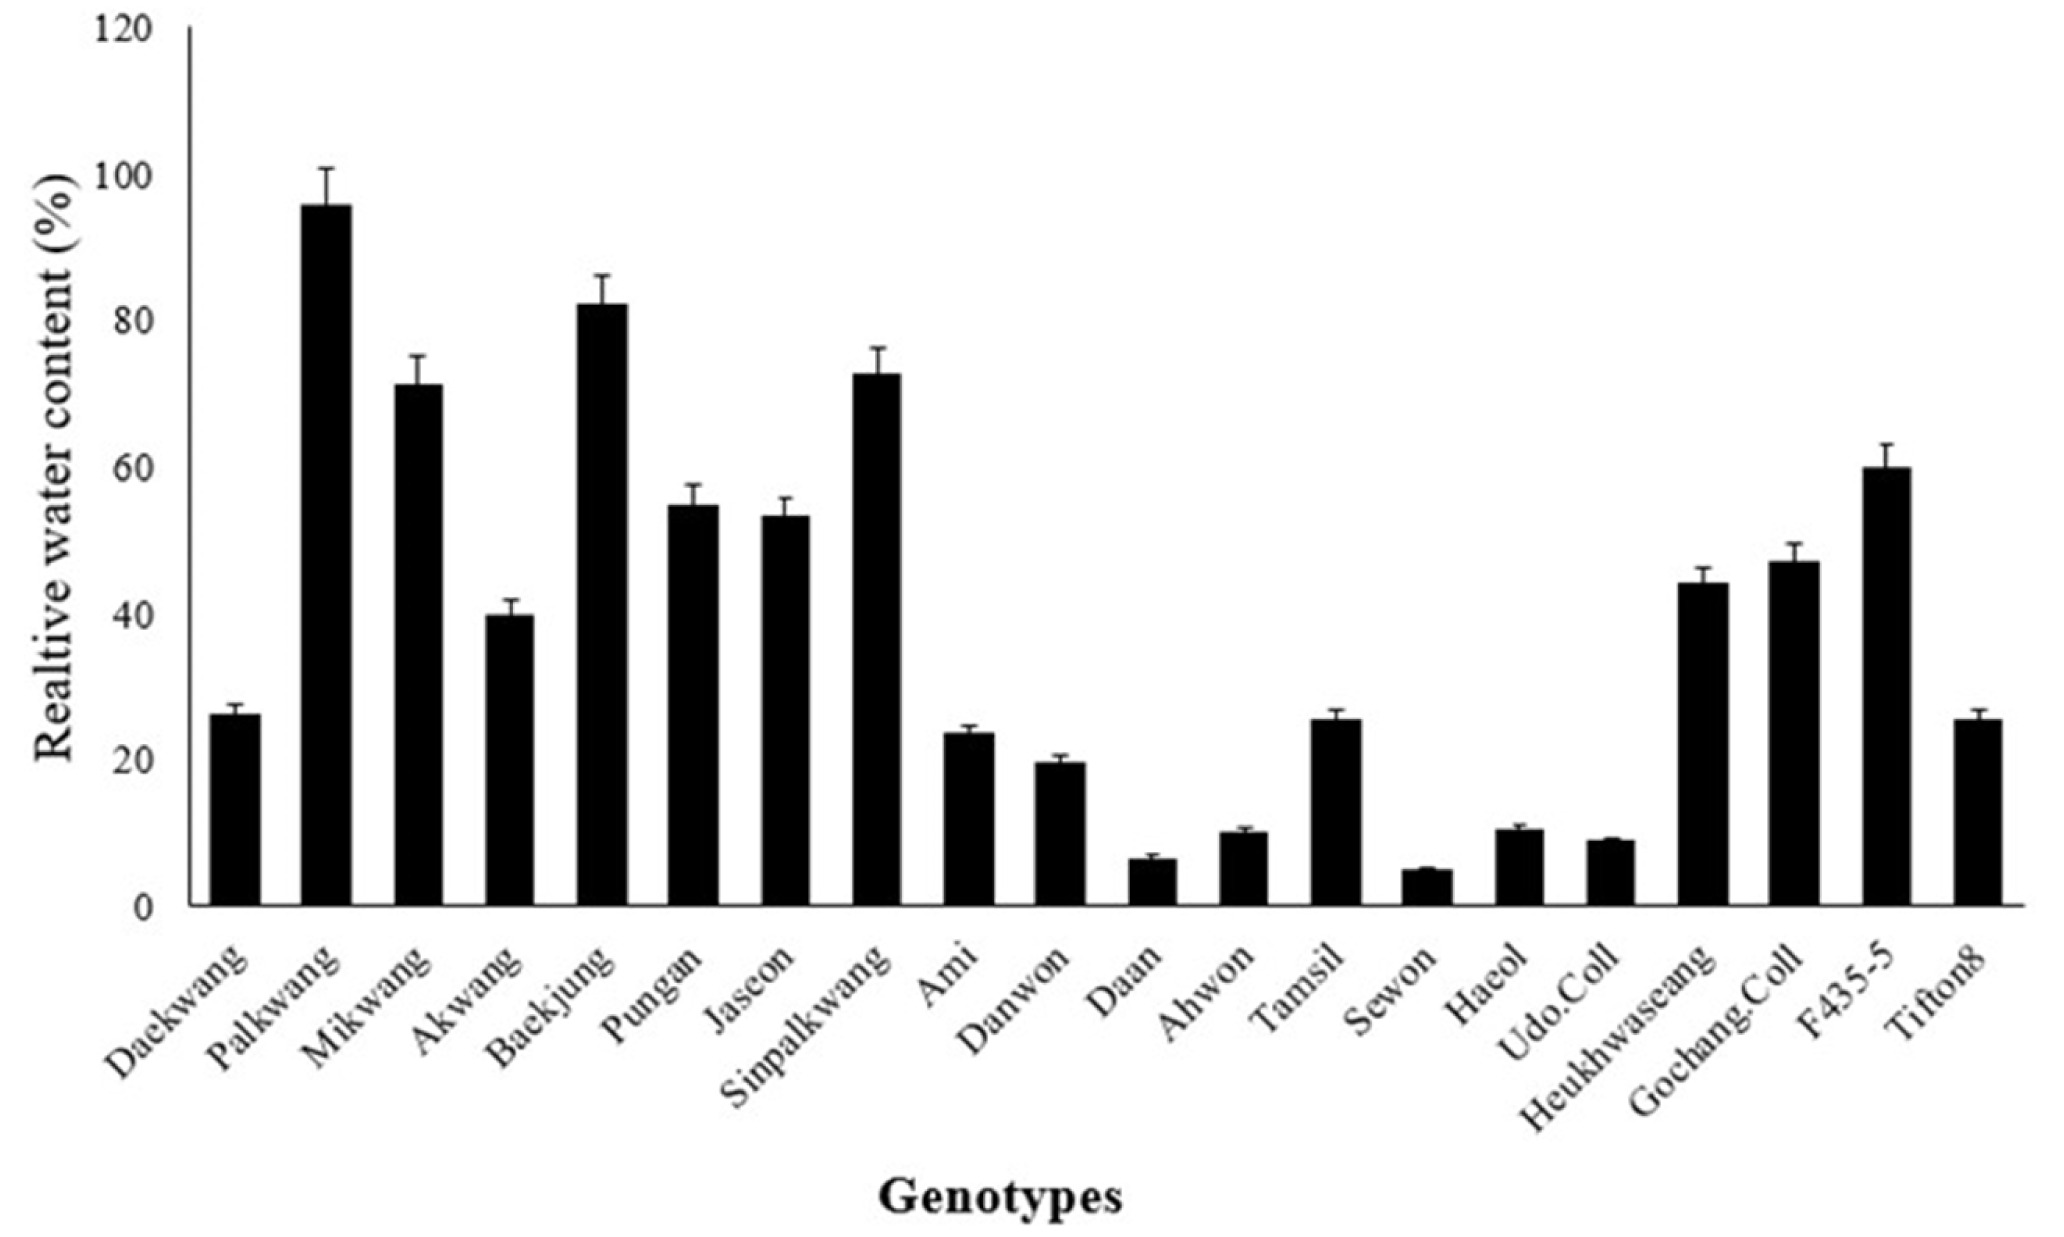
Plants under DS commonly exhibit some physiological changes to counter the adverse effect of DS. The modifications in physiological functions are regulated through important mechanisms such as leaf water potential, leaf relative water content (RWC), chlorophyll content (CC), stomata conductance, cellular osmatic pressure during the DS. Through these mechanisms, plants survive during DS. Leaf relative water is one of the important indicators of water status in plants, the balance between water supply to the leaf tissue and transpiration rate is reflected in the RWC of leaves (
Lugojan and Ciulca, 2011;
Chen et al. 2015). Thus in this study, we examined the RWC in the 15 days after DS. Our results indicated that genotypes Ami (‒1.02), Sewon (4.95), Daan (6.62), Udo.Coll (9.00), and Ahwon (10.16), exhibited signifi-cantly reduced RWC (
Fig. 3) compared to the control plants. Whereas, Palkwang (84.93), Sinpalkwang (72.70), Haeol (71.13), Heukhwaseang (74.76) genotypes shown a high amount of RWC (
Fig. 3) which was not significantly changed compared to control plants.
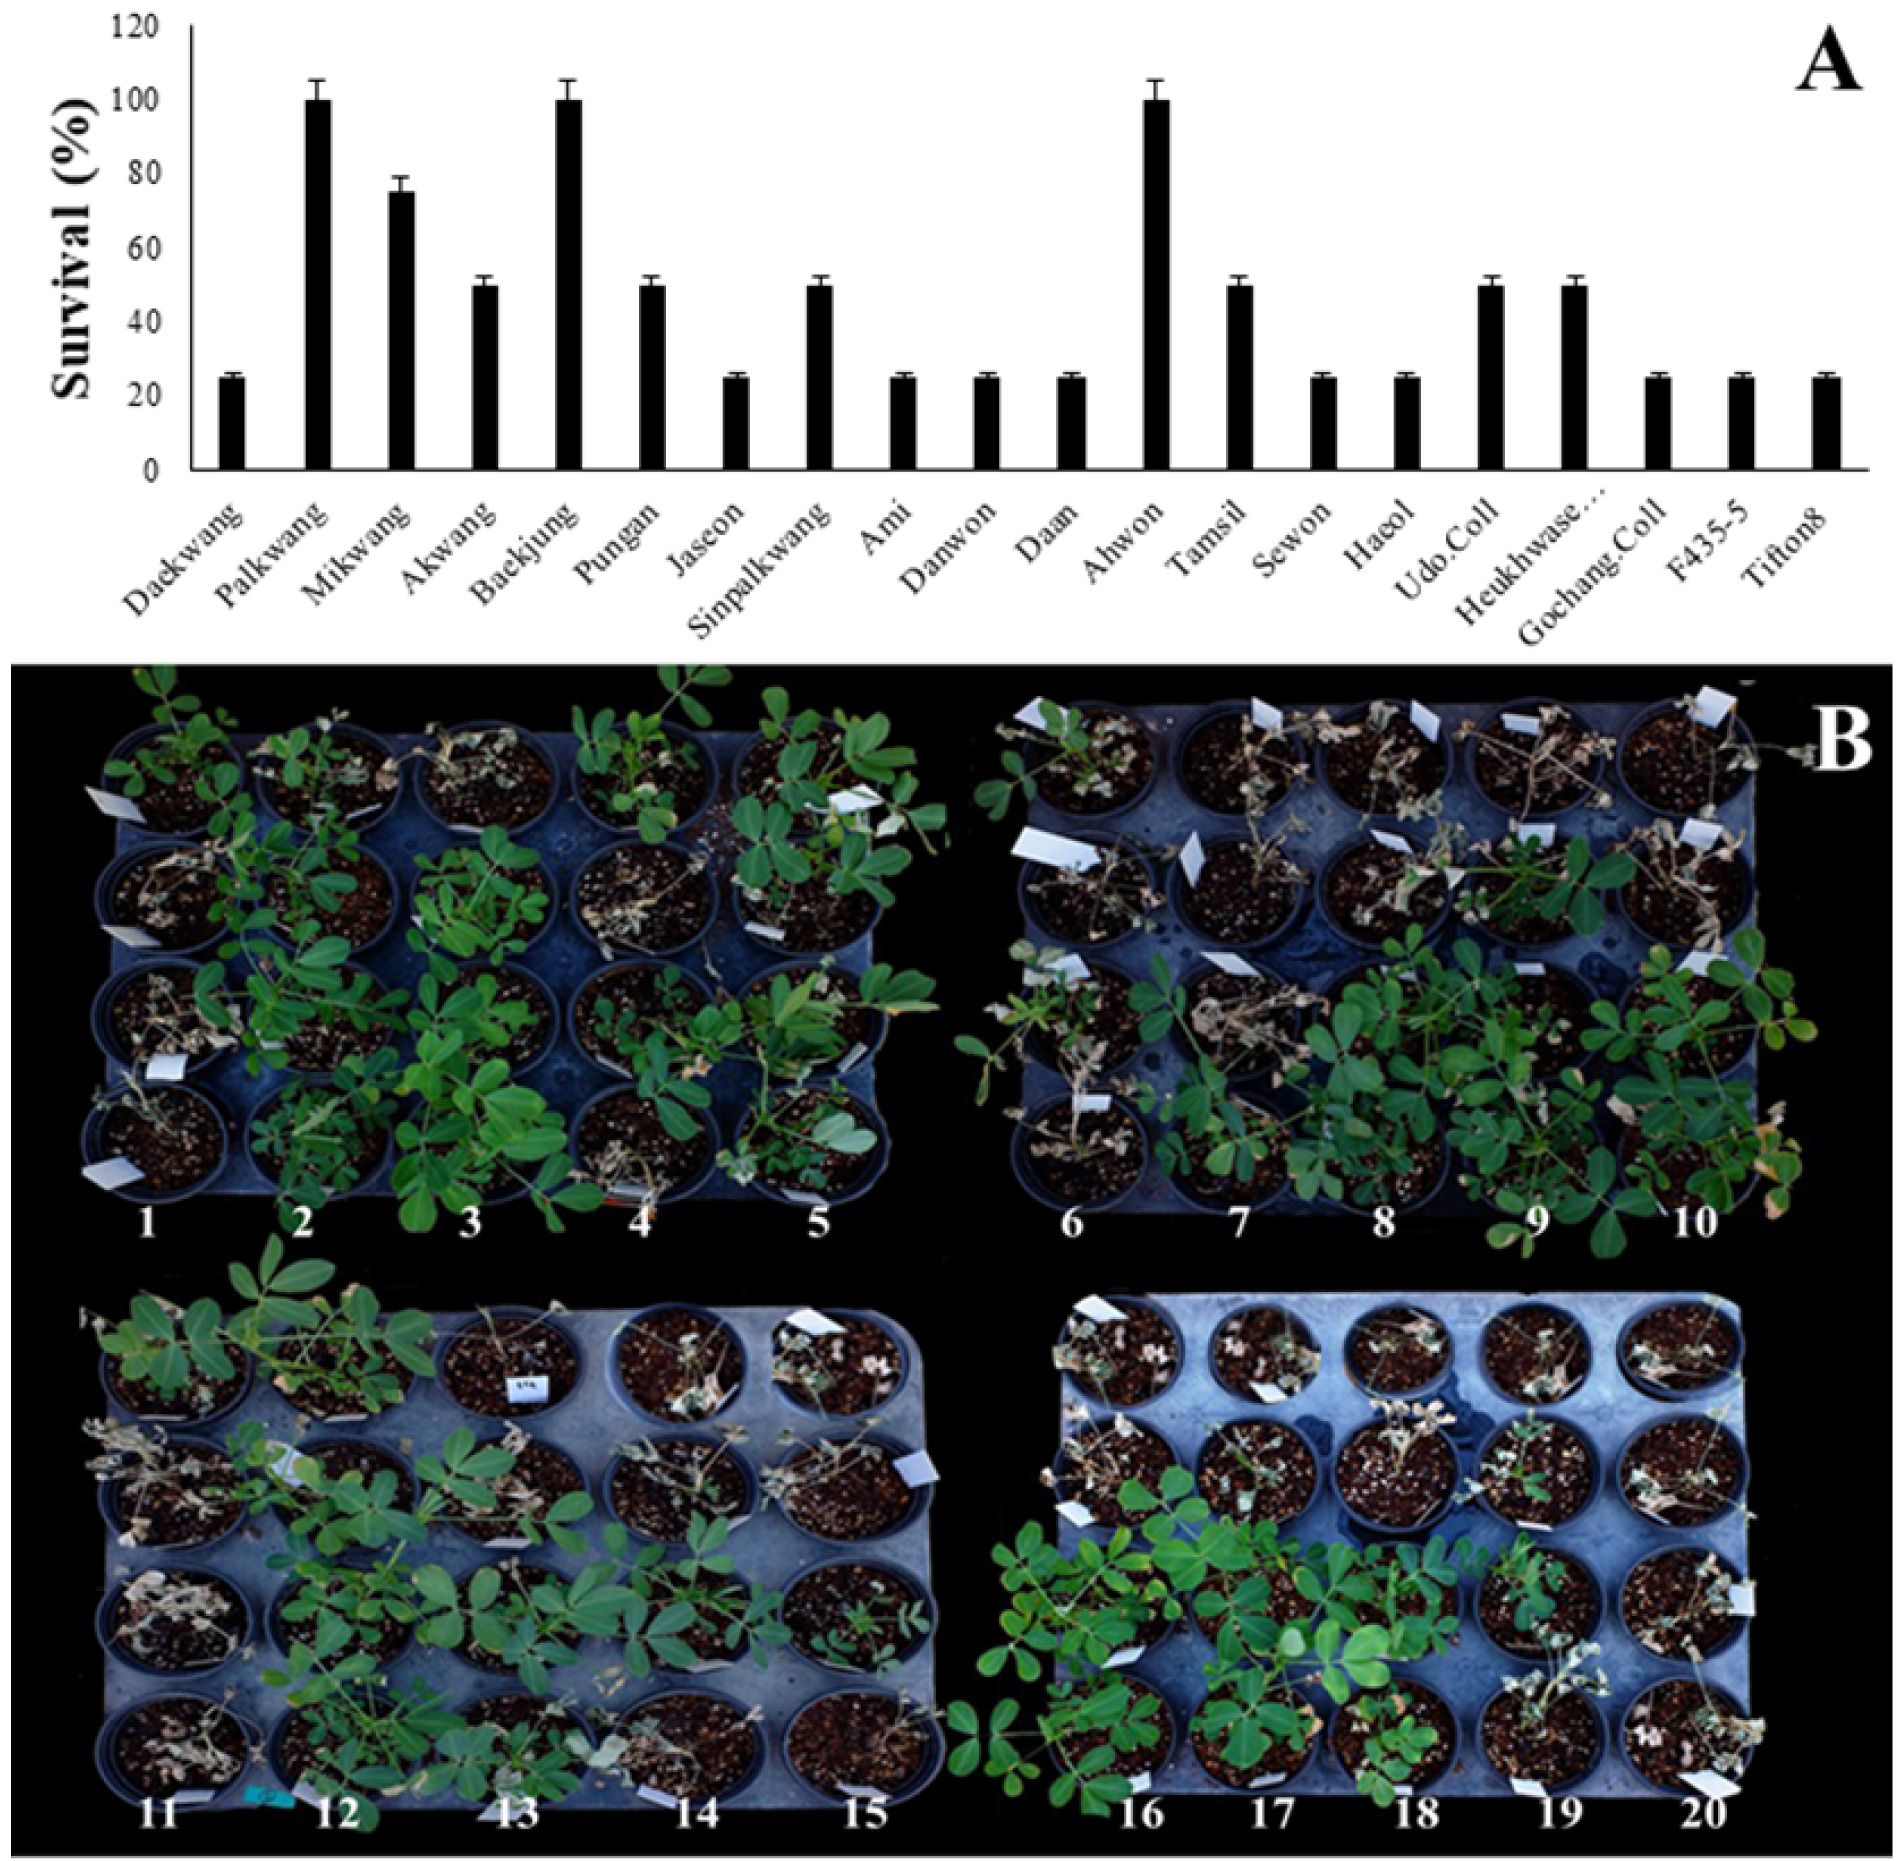
To examine the impact of drought stress on different peanut genotypes we restricted plants watering up to15 days. The results indicated that after 15 days of DS, followed by re-watering for 4 days’ genotypes such as Palwang, Mikwang, Baekjung and Ahwon showed maximum recovery (
Fig. 4). Whereas genotypes Daekwang, Ami, Danwon, Sewon, Haeol, Gochang.Coll, F435-5, and Tifton8 showed the sensitivity to DS and 25% of plants recovered after the re-watering. Similarly, Akwang, Pungan, Jaseon, Sinpalkwang, Tamsil, Udo.Coll, and Heukhwaseang, showed 50% recovery, and Milwang genotypes showed 75% recovery after rehydration or re-watering.
Typically, plants exposed to drought stress accumulate the reactive oxygen species (ROS). Over-production of ROS leads to oxidative damage of cell components. To combat increased ROS, plants produce antioxidants such as, polyphenols and flavonoids, which inhibit or counter the ROS production under DS. Therefore, we examined the polyphenol and flavonoid content, of the three drought- tolerant (Palkwang, Mikwang and Baekjung) and drought- sensitive genotypes (Daekwang, Haeol, and Heukhwaseang) these lines were selected based on phenotypic observation. The total polyphenol content was significantly decreased in all the sensitive genotypes under the DS compared to control WW conditions plants (
Fig. 5). Likewise, flavonoid content was examined; results indicated that drought-tolerant genotypes (Palkwang, Mikwang and Baekjung) exhibit reduction in flavonoid content under DS compared to WW condition (
Fig. 5). Whereas, sensitive genotypes (Daekwang, Haeol, and Heukhwaseang) showed a highly significant reduction in flavonoid content under DS compared to WW conditions (
Fig. 5). These results suggested that the antioxidant level of polyphenol and flavonoid content in genotypes significantly reduced under the DS compared to in genotypes (Palkwang, Mikwang and Baekjung). This result indicates that due to a low production of the antioxidant in genotypes Daekwang, Haeol, and Heukhwaseang might have been unable to combat with DS and showed the sensitivity.
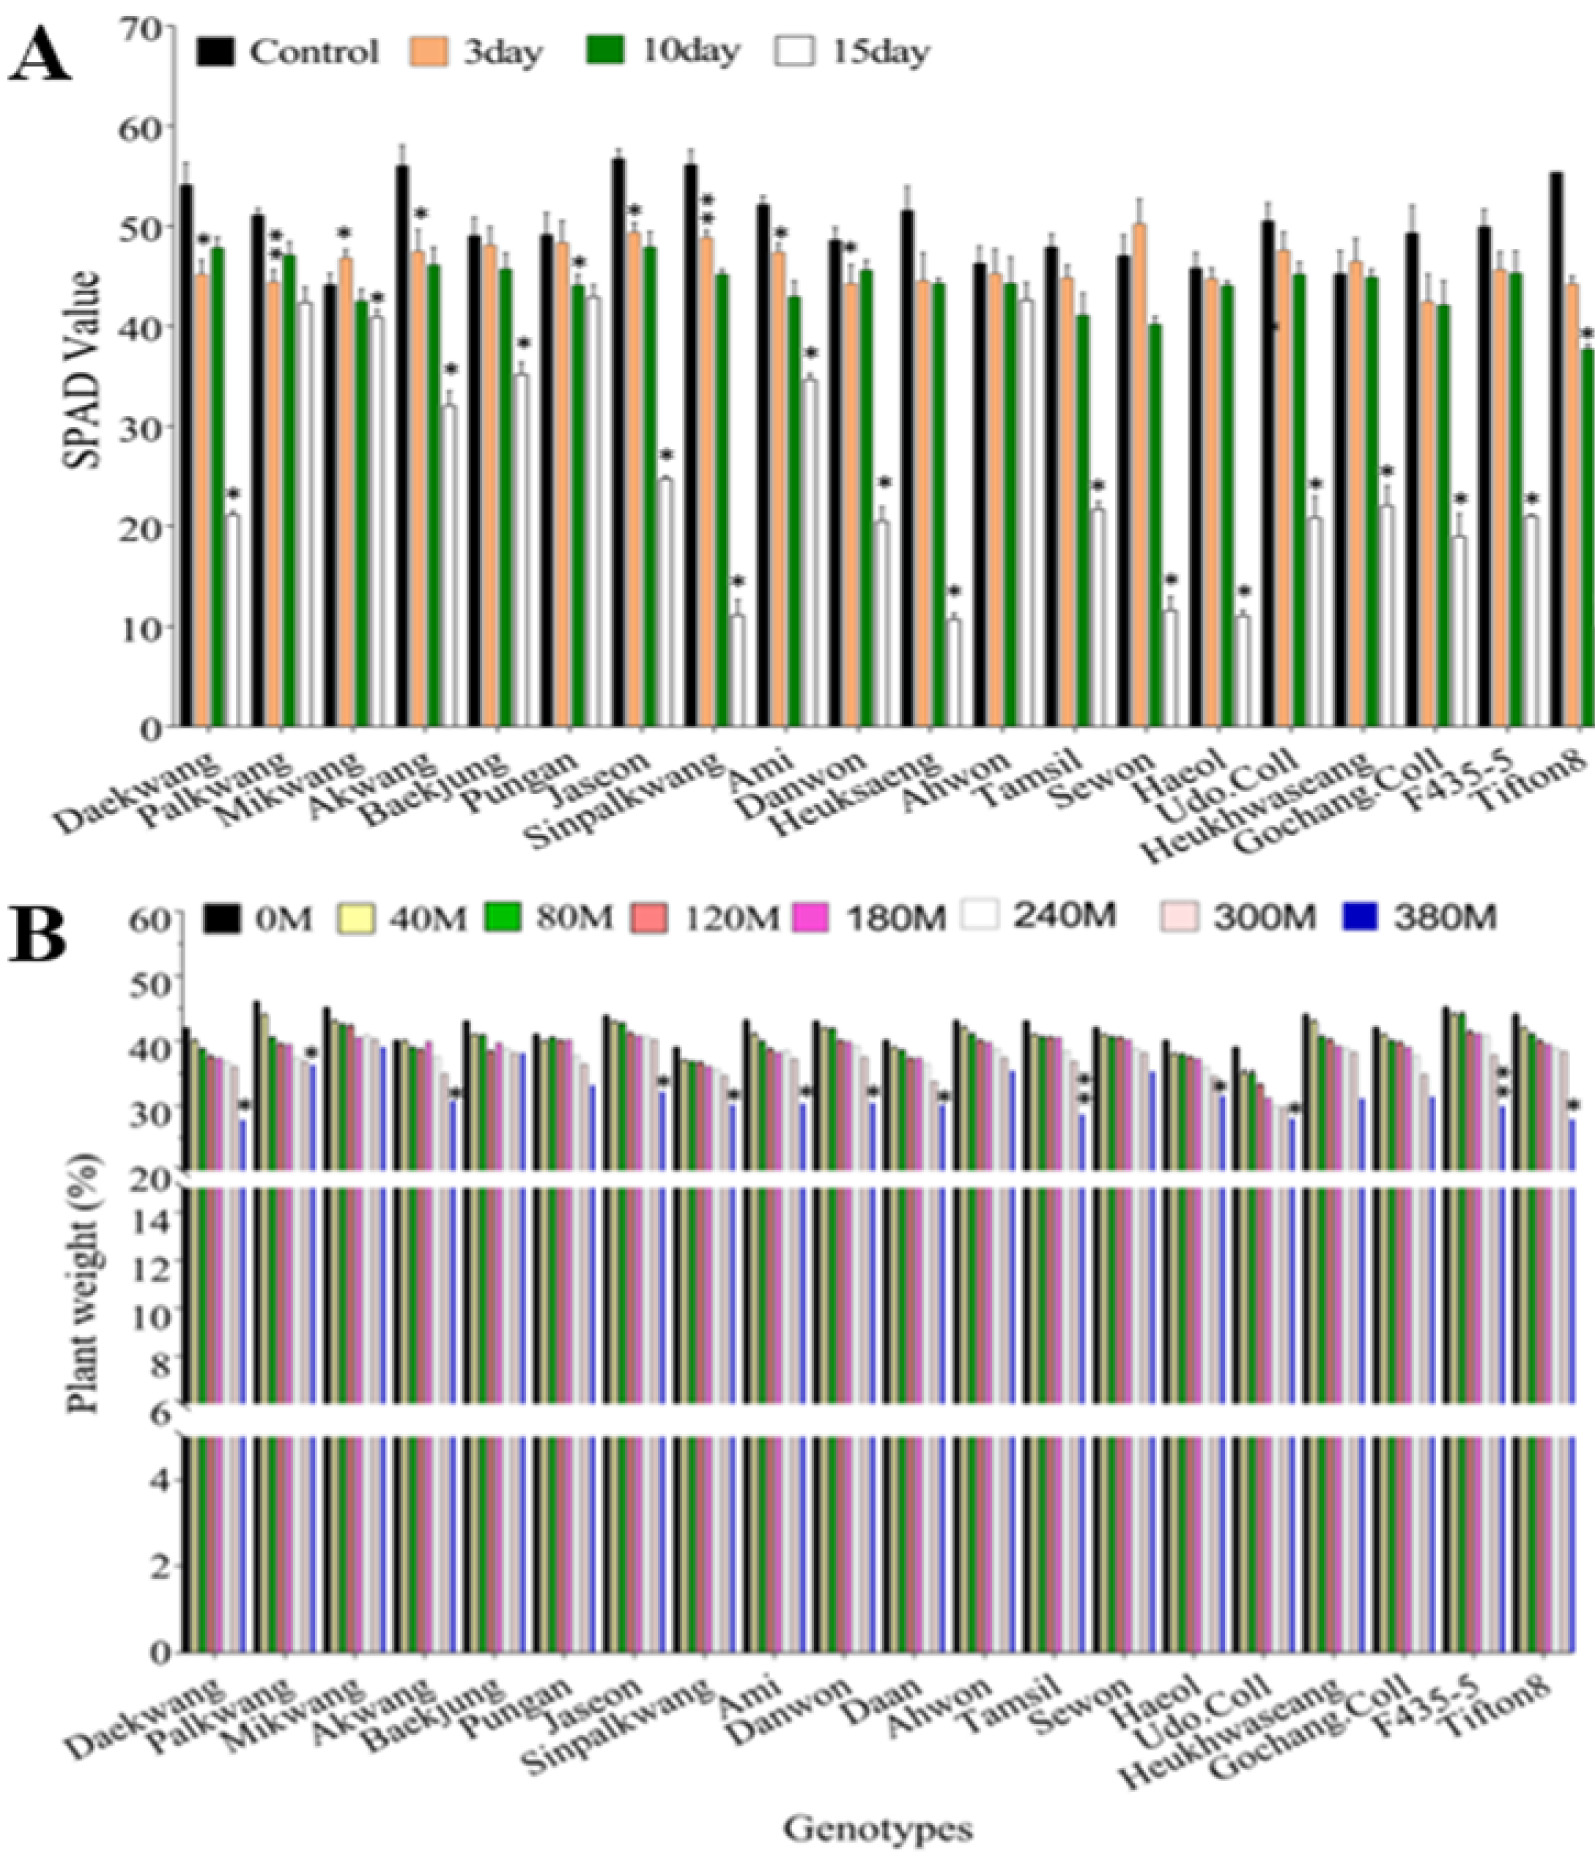
Under drought stress, stomatal conductance is an important adaptation mechanism for plants. Because closed stomata minimize water evaporation, plants have a higher survival rate during DS. Thus, we examined and compared the transpiration rates 0 to 380 minutes during DS. The genotypes Udo. Coll, Tamsil, and F435-5 showed the maximum loss of water indicating the highest transpiration rate (
Fig. 6B). Whereas, genotypes Ahwon, Jaseon, and Sewon showed lower water loss showing minimum transpiration rate (
Fig. 6B). Overall, 30-35% fresh weight reduction in plants was observed after 6h of leaf detachment compared to WW plants.
Typically, under DS plants exhibit changes in the photosynthesis process which leads to altering the pigment like chlorophyll present in leaf subsequently it influence the total chlorophyll content. Thus, we investigated the total chlorophyll content with different time intervals 3rd, 10
th and 15
th day of DS. The result indicated the reduction of total chlorophyll content in most of the genotypes during 3
rd and 15
th days of DS compared to WW control plants (
Fig. 6A). Genotypes Deakwang, Haeol and F435-5 showed a significant reduction in the chlorophyll content on the 15
th day of DS (
Fig. 6A). Whereas, genotype Palkwang, Pungan and danwonshowed a very less reduc-tion in total chlorophyll content compared to WW control as well all other DS genotypes on the 15
th day of DS (
Fig. 6A,
Table 4).
DISCUSSION
Drought is one of the key constraints that restrict crop productivity among the various stresses that plants face during their life cycle. Including peanut, drought stress and its impact on crop yield are well recorded in several plant species (
Nabi et al. 2021). Commonly, drought stress is harmful to plants, it severely alters plant physiological, morphological, biochemical as well as metabolic functions (
Nabi et al. 2019a). Drought stress primarily impaired the photosynthesis, antioxidant level, cellular and plant deve-lopment alterations (
Laxa et al. 2019;
Nabi et al. 2021). Drought recovery is important for plant yield and productivity; hence, recent studies looked into it in several plant species. However, studies are limited on peanut rehydration or recovery after drought stress. Moreover, according to the literature, a necessity for crop improve-ment is the evaluation and screening of germplasm or plant materials under DS based on physiological and bio-chemical features. Our study aimed was to identify drought-tolerant genotypes among widely grown cultivars, hence several physiological and biochemical analyses of peanuts were conducted. Second, we desired to know if these genotypes can recover after a drought and what effect drought has on plant physiological, morphological, and biochemical characteristics.
Typically, plants subjected to drought stress exhibit the symptoms like leaf wilting, change in leaf pigment or yellowing of leaf, leaf rolling, plant height, shoot, root reduction (40). Our evaluation also found that under the DS, most of the genotypes showed a reduction in the PH under DS. In addition, we also observed significant alteration in SL and RL (
Table 2) of given genotypes under DS condition compared WW control condition. Similar type of adverse effect was observed in different plant species including peanut upon the DS (
Kapoor et al. 2020;
Luo et al. 2020;
Delfin et al. 2021;
Rahmianna et al. 2021). Based on the evaluation of different plant traits, we found that there is a wide genotypic variation present in the given genotypes for the DS. Our finding also revealed that genotypic variation for LWI in response to DS and after rehydration of plants (
Fig. 2). Similarly, our results indicated higher RWC in the case of tolerant genotypes (
Fig. 3) and also enhance the plant’s survival rate (
Fig. 4). Previously it was reported that higher drought tolerance is linked with water transpiration rate and RWC in leaf (
Painawadee et al. 2009;
Thangella et al. 2018a;
Kapoor et al. 2020). Due to the ability of some of the genotypes to maintain high RWC that might have shown tolerance to DS hence this result shows consistency with previous findings.
The evaluation of peanut genotypes under DS aid to identify the genotypes which showed significant tolerance response to DS and some genotypes which showed sensitive responses to DS. Furthermore, the evaluation determined that DS significantly affects plant growth and development by altering the different plant traits. However, genotypes which showed better performance and limited reduction for traits like PH, SL, RL, FSW, and FRW were ideal for drought tolerance may be considered to use further peanut improvement. At the same time from the results, it suggested that genotypes that showed no or limited survival and maximum reduction in traits like PH, SL, RL, FSW, and FRW are may not be suitable to cultivate under drought stress. However, these sensitive genotypes may be utilized in the peanut breeding program to make new crosses with contrasting parents to develop mapping lines for drought tolerance as well as further peanut drought improvement programs.
To combat the DS plants required a diverse metabolic, osmotic regulation, which ultimately reduces the water and gas exchange at the same time it should avoid loss in photosynthetic efficiency. Photosynthesis in plants is extremely vulnerable to environmental stress; hence, it is a key indicator of drought (
Thangella et al. 2018b). It is known that DS adversely affect the photosynthesis rate and subsequently damage pigmentation that resulting into interruption in the photosystem (PS) PSI and PSII. Moreover, studies reported that under drought conditions, plants total chlorophyll content including chlorophyll fluorescence (Chl a and Chl b) reduced in several plant species including peanut (
Lauriano et al. 2004;
Kalariya et al. 2015; Adhikari
et al. 2018;
Nabi et al. 2021). From our evaluation, we also found a reduction in the total chlorophyll content and Chl a, Chl b fluorescence in tested genotypes. Moreover, we observed chlorophyll content of genotypes that showed tolerance during DS get less affected compared to sensitive ones (
Fig. 6).
The antioxidant and secondary metabolite production in response to DS and rehydration or recovery diversely varies with the species, cultivar, plant parts, and duration or intensity of the stress (Cruz de Carvalho 2008). Typically, under DS phenolic compounds increased in the plants. Moreover, it has been reported in plant species, like Arabidopsis, rice, maize, and
Hypericum brasiliense Choisy DS modulate phenolic compounds (
Ayaz et al. 2000;
De Abreu and Mazzafera 2005;
Hura et al. 2008). In peanut previously reported that polyphenol and flavonoid levels differentially increased tolerance and sensitivity of genotypes under DS (
Aninbon et al. 2016; Juliano and Lebo 2019). Our results are consistent with previous studies, which investigated DS in peanut and other plant species.
Overall, results of the present study demonstrated that under the DS peanut genotypes negatively affect plant growth and development compared to the WW control plants. However, certain genotypes showed the differential response to DS and showed better performance during rehydration or recovery treatment. These better performing genotypes also showed the tolerance to DS through different morphological, physiological and biochemical enhancements that might be the reason these selected genotypes showed the ability to combat DS.
CONCLUSION
The present study indicates a wide range of diversity among tested twenty genotypes of peanut in repose to DS. Phenotypic characterization or screening of peanut geno-types reiterates the usefulness of uniform evaluation under the control condition to identify promising genetic mater-ials. Newly identified tolerant genotypes could be a poten-tial source for conducting multi-location and stability studies to develop drought-tolerant peanut cultivars. Addi-tionally, this study gives insight into important traits, which may useful for selecting drought-tolerant plants.
ACKNOWLEDGEMENTS
This research work was supported by Agenda Project (No. PJ01419202) and Fellowship Program of Rural Development Administration, Republic of Korea. The authors would like to special thanks Dr. Rupesh Tayade, Kyungpook National University, for his assistance in viewing and editing our manuscript. His willingness to give his time so generously has been very much appreciated.
Fig. 1Effect of drought stress on plant height (cm) of twenty peanut genotypes in control and stress conditions. Experiments were done twice with replicates (n = 4). Asterisks * indicate significant differences at 5% level of significance (*P < 0.05, **P < 0.01), and the results are given as mean values SD. Error bars represent standard error.

Fig. 2The wilting indices of leaves in twenty different peanut genotypes after 15 days of drought stress at the seedling stage. (A) The leaf-wilting index (LWI) after 15 days of drought stress was used to classify 20 peanut genotypes. (B) Measurement and visualization of leaf wilting and leaf area of twenty peanut genotypes after rehydration. Experiments were done twice with replicates (n = 4). Asterisks * indicate significant differences at 5% level of significance (*P < 0.05), and the results are given as mean values SD. Error bars represent standard error.
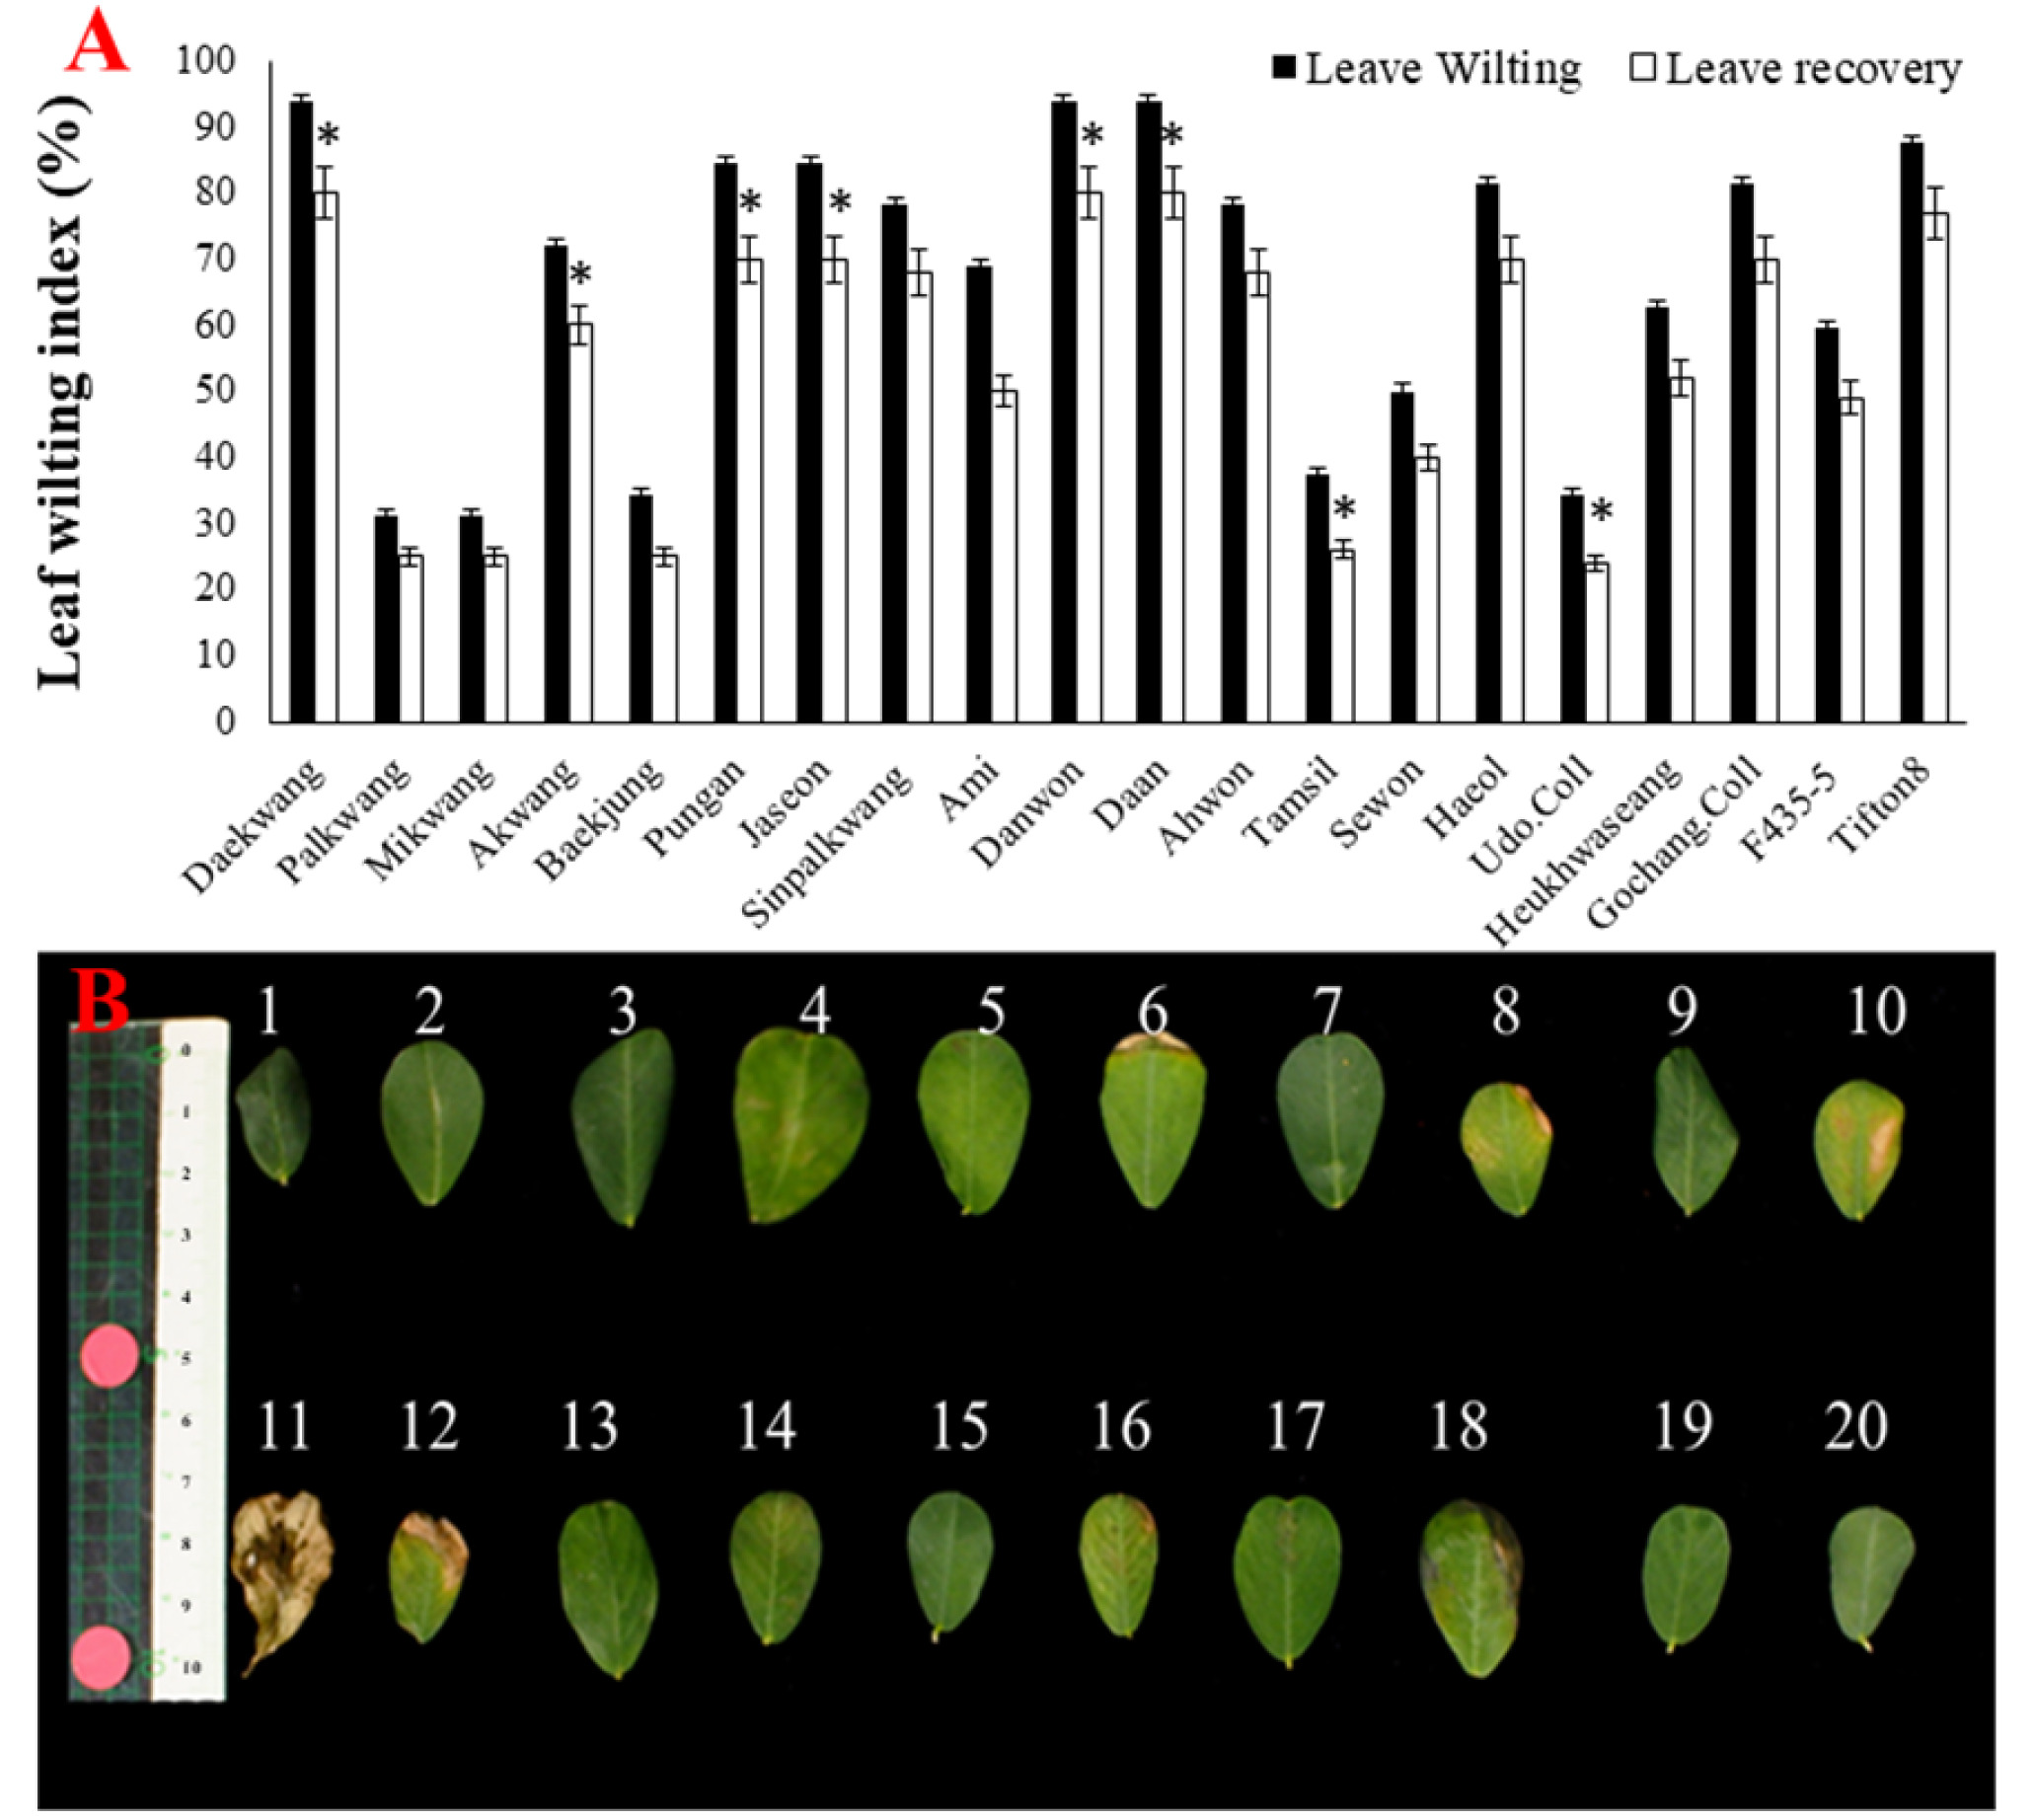
Fig. 3The two-week-old twenty peanut genotypes were exposed to drought stress by withholding water for 15 days. (A) Representative genotypes subjected to drought stress treatment for 15 days, all plants were rehydrated or rescued (48 hours) and their recovery and survival was calculated. (B) Phenotypic evaluation of twenty genotypes after rehydration or rescue (48 hours). Experiments were done twice with replicates (n = 4). The results represent mean values SD. Error bars represent standard error.

Fig. 4Leaf relative water content (RWC) (%) of twenty peanut genotypes after drought treatment. The dotted blue line represents the linear regression and associated R2 determined at P < 0.05 (*P < 0.05). Experiments were done twice with replicates (n = 4). The results are given as mean values SD. Error bars represent standard error.

Fig. 5Effect of drought stress on polyphenol and flavonoid content in given genotypes. (A) Total polyphenol and (B) Total flavonoid contents of peanut genotypes under DS and control conditions (WW). Experiments were done twice with replicates (n = 4). Significance was determined at (*P < 0.05, **P < 0.01, ***P < 0.001 and ns = non-significant) the results are given as mean values SD. Error bars represent standard error.
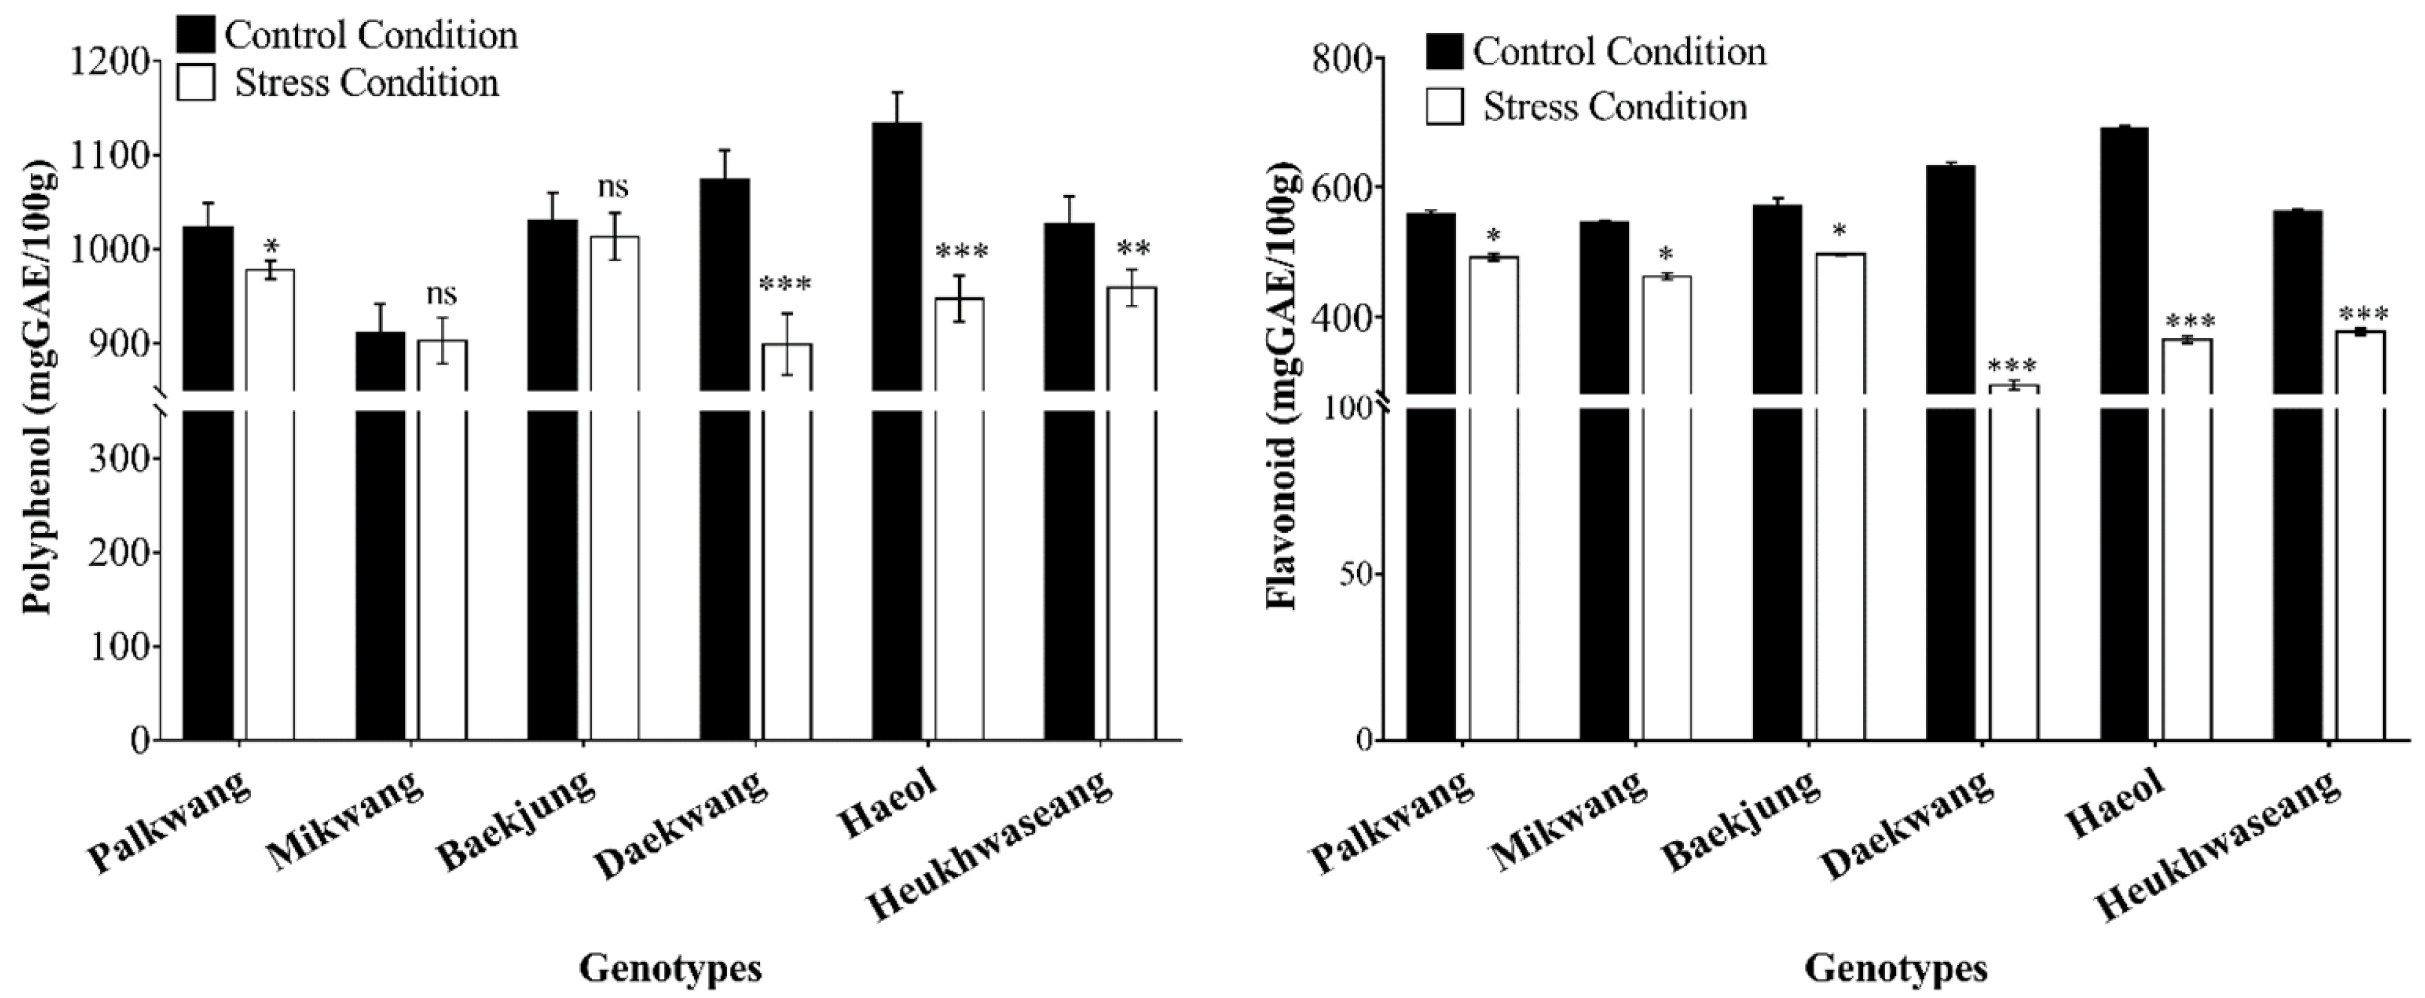
Fig. 6Effect of drought stress on chlorophyll content and water transpiration in twenty peanut genotypes. (A) Chlorophyll content (B) Transpiration rate or plant weight (%) under DS and control condition. Experiments were done twice with replicates (n = 4). Significance was determined at P < 0.01 (*P < 0.05 and **P < 0.01) the results are given as mean values SD. Error bars represent standard error.

Table 1List of peanut inbred lines selected for this study.
Table 1
|
S.No. |
Genotype name |
IT/PI/K number |
Species |
Subspecies |
Variety |
Type |
Group |
|
1 |
Daekwang |
IT 172557 |
Arachis hypogaea |
fastagiata
|
Vulgaris
|
domestic |
Variety |
|
2 |
Palkwang |
IT 214799 |
Arachis hypogaea |
hypogaea
|
hypogaea
|
domestic |
Variety |
|
3 |
Mikwang |
IT 212202 |
Arachis hypogaea |
fastagiata
|
Vulgaris
|
domestic |
Variety |
|
4 |
Akwang |
IT 213162 |
Arachis hypogaea |
fastagiata
|
Vulgaris
|
domestic |
Variety |
|
5 |
Baekjung |
IT 213160 |
Arachis hypogaea |
fastagiata
|
Vulgaris
|
domestic |
Variety |
|
6 |
Pungan |
IT 229435 |
Arachis hypogaea |
hypogaea
|
hypogaea
|
domestic |
Variety |
|
7 |
Jaseon |
- |
Arachis hypogaea |
fastagiata
|
Vulgaris
|
domestic |
Variety |
|
8 |
Sinpalkwang |
- |
Arachis hypogaea |
hypogaea
|
hypogaea
|
domestic |
Variety |
|
9 |
Ami |
IT 310161 |
Arachis hypogaea |
fastagiata
|
Vulgaris
|
domestic |
Variety |
|
10 |
Danwon |
IT 310160 |
Arachis hypogaea |
fastagiata
|
Vulgaris
|
domestic |
Variety |
|
11 |
Daan |
- |
Arachis hypogaea |
fastagiata
|
Vulgaris
|
domestic |
Variety |
|
12 |
Ahwon |
IT 304334 |
Arachis hypogaea |
hypogaea
|
hypogaea
|
domestic |
Variety |
|
13 |
Tamsil |
- |
Arachis hypogaea |
hypogaea
|
hypogaea
|
domestic |
Variety |
|
14 |
Sewon |
- |
Arachis hypogaea |
fastagiata
|
Vulgaris
|
domestic |
Variety |
|
15 |
Haeol |
- |
Arachis hypogaea |
hypogaea
|
hypogaea
|
domestic |
Variety |
|
16 |
Udo.Coll |
- |
Arachis hypogaea |
hypogaea
|
hypogaea
|
domestic |
Germplasm |
|
17 |
Heukhwaseang |
- |
Arachis hypogaea |
fastagiata
|
Vulgaris
|
oversea |
Germplasm |
|
18 |
Gochang.Coll |
- |
Arachis hypogaea |
fastagiata
|
Vulgaris
|
domestic |
Germplasm |
|
19 |
F435-5 |
- |
Arachis hypogaea |
fastagiata
|
Vulgaris
|
oversea |
Germplasm |
|
20 |
Tifton8 |
K000280 |
Arachis hypogaea |
hypogaea
|
hypogaea
|
oversea |
Variety |
Table 2Shoot length (cm) and roots length (cm) in peanut genotypes under drought and rescue conditions.
Table 2
|
Trait |
Peanut inbred lines |
Control condition |
Stress condition |
Rescue condition |
|
Shoot length (cm) |
Daekwang |
28 ± 0.4 |
13.75 ± 0.41**** |
17.5 ± 0.71**** |
|
Palkwang |
29 ± 0.4 |
19.5 ± 0.75**** |
21 ± 0.64**** |
|
Mikwang |
29.5 ± 0.28 |
19.25 ± 0.47**** |
15.25 ± 0.47**** |
|
Akwang |
25.75 ± 0.47 |
18 ± 0.39**** |
18.75 ± 0.47**** |
|
Baekjung |
34.25 ± 0.47 |
20.5 ± 0.47**** |
19.5 ± 0.64**** |
|
Pungan |
27.5 ± 0.28 |
13.25 ± 0.47**** |
14.5 ± 0.28**** |
|
Jaseon |
25.5 ± 0.28 |
10.75 ± 0.47**** |
12.12 ± 0.51**** |
|
Sinpalkwang |
26 ± 0.4 |
16.51 ± 0.28**** |
17.5 ± 0.28**** |
|
Ami |
29.25 ± 0.47 |
15.51 ± 0.28**** |
16.75 ± 0.47**** |
|
Danwon |
29 ± 0.4 |
15.25 ± 0.62**** |
16.5 ± 0.64**** |
|
Daan |
26 ± 0.4 |
9.75 ± 0.25**** |
11.5 ± 0.64**** |
|
Ahwon |
32 ± 0.81 |
22 ± 0.41**** |
24.5 ± 0.64**** |
|
Tamsil |
25 ± 0.4 |
16 ± 0.41**** |
17.25 ± 0.47**** |
|
Sewon |
24.75 ± 0.47 |
15.25 ± 0.47**** |
16.75 ± 0.47**** |
|
Haeol |
23 ± 0.4 |
14.5 ± 0.28**** |
16.5 ± 0.64**** |
|
Udo.Coll |
26.25 ± 0.47 |
15.5 ± 0.28**** |
16.75 ± 0.47**** |
|
Heukhwaseang |
25 ± 0.4 |
12 ± 0.41**** |
14.75 ± 0.47**** |
|
Gochang.Coll |
21 ± 0.4 |
11.21 ± 0.62**** |
12.5 ± 0.28**** |
|
F435-5 |
28.25 ± 0.25 |
19.75 ± 0.47**** |
21.75 ± 0.47**** |
|
Tifton8 |
24.5 ± 0.57 |
19.22 ± 0.29**** |
19.75 ± 0.42**** |
|
Root length (cm) |
Daekwang |
29.5 ± 0.28 |
18.75 ± 0.47**** |
22 ± 0.41**** |
|
Palkwang |
34.12 ± 0.41 |
19 ± 0.41**** |
23.45 ± 0.66**** |
|
Mikwang |
36.5 ± 0.64 |
24.25 ± 0.85**** |
28.5 ± 0.64**** |
|
Akwang |
40.75 ± 0.47 |
19.5 ± 0.28**** |
21 ± 0.57**** |
|
Baekjung |
25.25 ± 0.47 |
22 ± 0.41** |
23.74 ± 0.48 |
|
Pungan |
21.01 ± 0.57 |
15.5 ± 0.28**** |
17.5 ± 0.28** |
|
Jaseon |
34.25 ± 0.47 |
17.01 ± 0.41**** |
19 ± 0.41**** |
|
Sinpalkwang |
30.75 ± 1.49 |
12.75 ± 0.47**** |
14.5 ± 0.64**** |
|
Ami |
27.01 ± 0.41 |
17.01 ± 0.41**** |
19 ± 0.41**** |
|
Danwon |
27.75 ± 0.47 |
20.01 ± 0.41**** |
21.25 ± 0.47**** |
|
Daan |
29.51 ± 0.28 |
20.01 ± 0.41**** |
22.5 ± 0.64**** |
|
Ahwon |
36.01 ± 0.41 |
26.5 ± 0.64**** |
28.25 ± 0.62**** |
|
Tamsil |
24.25 ± 0.62 |
22.01 ± 0.81 |
24 ± 0.41 |
|
Sewon |
27.49 ± 0.28 |
25.5 ± 0.64 |
26.25 ± 0.47 |
|
Haeol |
29.01 ± 0.41 |
22.625 ± 0.62**** |
23.25 ± 1.11**** |
|
Udo.Coll |
31.75 ± 0.62 |
21.5 ± 0.64**** |
23.62 ± 0.55**** |
|
Heukhwaseang |
28.75 ± 0.47 |
20 ± 0.91**** |
22.25 ± 0.75**** |
|
Gochang.Coll |
23.01 ± 0.41 |
19.5 ± 0.64** |
21.2 ± 0.45 |
|
F435-5 |
21.95 ± 1.36 |
16.86 ± 0.43**** |
21.86 ± 0.31 |
|
Tifton8 |
22.25 ± 0.85 |
16.5 ± 0.64**** |
20.25 ± 0.47**** |
Table 3Shoot weight (gm) and roots weight (gm) in peanut genotypes under drought and rescue conditions.
Table 3
|
Trait |
Peanut inbred lines |
Control condition |
Stress condition |
Rescue condition |
|
Shoot weight (gm) |
Daekwang |
8.17 ± 0.34 |
1.52 ± 0.29**** |
1.88 ± 0.12*** |
|
Palkwang |
5.83 ± 0.03 |
2.25 ± 0.04 |
2.62 ± 0.12 |
|
Mikwang |
7.05 ± 0.62 |
2.39 ± 0.23*** |
2.25 ± 0.13 |
|
Akwang |
7.83 ± 0.05 |
2.37 ± 0.43 |
2.82 ± 0.01*** |
|
Baekjung |
12.38 ± 0.17 |
2.51 ± 0.3**** |
2.95 ± 0.05**** |
|
Pungan |
8.78 ± 1.43 |
0.68 ± 0.1**** |
1.85 ± 0.02**** |
|
Jaseon |
11.26 ± 0.98 |
1.17 ± 0.01**** |
1.82 ± 0.04**** |
|
Sinpalkwang |
7.34 ± 1.198 |
1.01 ± 0.16**** |
1.75 ± 0.08** |
|
Ami |
11.03 ± 1.27 |
1.05 ± 0.05**** |
1.65 ± 0.19**** |
|
Danwon |
15.77 ± 0.15 |
1.73 ± 0.31**** |
2.07 ± 0.11**** |
|
Daan |
10.71 ± 0.18 |
4.82 ± 3.39**** |
1.87 ± 0.02**** |
|
Ahwon |
12.62 ± 0.26 |
2.63 ± 0.15**** |
3.57 ± 0.12**** |
|
Tamsil |
5.6 ± 0.75 |
1.83 ± 0.01 |
2.83 ± 0.01 |
|
Sewon |
6.02 ± 0.07 |
2.47 ± 0.04 |
3.475 ± 0.04 |
|
Haeol |
6.48 ± 0.15 |
1.33 ± 0.06**** |
1.81 ± 0.15* |
|
Udo.Coll |
7.28 ± 0.09 |
2.26 ± 0.08**** |
3.11 ± 0.06 |
|
Heukhwaseang |
7.84 ± 0.69 |
1.22 ± 0.03**** |
2.43 ± 0.17** |
|
Gochang.Coll |
4.3 ± 0.08 |
1.22 ± 0.03**** |
2.27 ± 0.14 |
|
F435-5 |
11.02 ± 5.32 |
2.31 ± 0.02*** |
3.14 ± 0.12**** |
|
Tifton8 |
15.4 ± 0.33 |
1.32 ± 0.11**** |
1.095 ± 0.07**** |
|
Root weight (gm) |
Daekwang |
2.52 ± 0.17 |
0.832 ± 0.02**** |
0.83 ± 0.02**** |
|
Palkwang |
1.78 ± 0.11 |
1.2 ± 0.05 |
1.98 ± 0.05 |
|
Mikwang |
3.33 ± 0.06 |
1.97 ± 0.04*** |
2.25 ± 0.16* |
|
Akwang |
2.06 ± 0.02 |
1.09 ± 0.09 |
1.29 ± 0.03 |
|
Baekjung |
3.47 ± 0.23 |
1.19 ± 0.17**** |
2.11 ± 0.06*** |
|
Pungan |
2.9 ± 0.79 |
0.49 ± 0.08**** |
0.745 ± 0.06**** |
|
Jaseon |
4.55 ± 0.21 |
1.21 ± 0.04**** |
1.4575 ± 0.05**** |
|
Sinpalkwang |
2.69 ± 0.49 |
0.85 ± 0.006**** |
1.33 ± 0.07*** |
|
Ami |
3.69 ± 0.21 |
1.2 ± 0.08**** |
1.65 ± 0.07**** |
|
Danwon |
6.37 ± 0.41 |
1.38 ± 0.22**** |
1.4775 ± 0.21**** |
|
Daan |
3.25 ± 0.09 |
1.58 ± 0.08**** |
1.6425 ± 0.05**** |
|
Ahwon |
3.49 ± 0.14 |
1.16 ± 0.04**** |
1.265 ± 0.04**** |
|
Tamsil |
1.77 ± 0.02 |
1.1 ± 0.03 |
1.655 ± 0.07 |
|
Sewon |
1.63 ± 0.06 |
1.19 ± 0.05 |
1.425 ± 0.04 |
|
Haeol |
2.11 ± 0.03 |
0.25 ± 0.046**** |
0.805 ± 0.03*** |
|
Udo.Coll |
2.71 ± 0.23 |
0.19 ± 1**** |
0.8325 ± 0.03**** |
|
Heukhwaseang |
2.7 ± 0.08 |
0.59 ± 0.001**** |
0.745 ± 0.05**** |
|
Gochang.Coll |
1.75 ± 0.06 |
0.44 ± 0.03**** |
0.6125 ± 0.07*** |
|
F435-5 |
4.8 ± 1.17 |
0.11 ± 0.12*** |
1.2625 ± 0.07** |
|
Tifton8 |
2.42 ± 0.1 |
0.85 ± 0.03**** |
0.6475 ± 0.04**** |
Table 4Effect of drought stress on chlorophyll content of given genotypes.
Table 4
|
Trait |
Peanut inbred lines |
3rd day |
10th day |
15th day |
|
Control condition |
Stress condition |
Control condition |
Stress condition |
Control condition |
Stress condition |
|
Total chlorop-hyll content (CC) |
Daekwang |
50.37 ± 2.18 |
47.17 ± 1.43 |
54.15 ± 2.94 |
45.82 ± 1.07* |
55.21 ± 2.33 |
21.12 ± 0.42* |
|
Palkwang |
52.15 ± 0.67 |
49.37 ± 1.32** |
51.11 ± 2.58 |
47.37 ± 1.24 |
50.95 ± 0.64 |
45.37 ± 1.51* |
|
Mikwang |
50.12 ± 3.06 |
49.82 ± 1.14* |
48.72 ± 1.21 |
46.12 ± 0.67* |
48.82 ± 1.11 |
40.87 ± 0.77 |
|
Akwang |
48.97 ± 3.17 |
46.10 ± 2.17 |
56.05 ± 1.66 |
42.5 ± 1.79*** |
53.78 ± 0.52 |
32.05 ± 1.49** |
|
Baekjung |
48.52 ± 1.18 |
45.70 ± 1.82 |
49.05 ± 0.38 |
45.35 ± 1.61 |
53.35 ± 2.45 |
39.17 ± 1.21 |
|
Pungan |
50.37 ± 1.45 |
48.35 ± 2.18 |
49.15 ± 1.71 |
44.07 ± 1.11* |
54.75 ± 1.77 |
42.87 ± 1.24*** |
|
Jaseon |
47.97 ± 2.61 |
44.40 ± 0.95* |
56.75 ± 3.46 |
47.90 ± 1.57* |
53.35 ± 1.69 |
24.71 ± 0.35* |
|
Sinpalkwang |
49.17 ± 1.99 |
48.82 ± 0.74 |
56.15 ± 1.88 |
45.20 ± 0.48** |
57.15 ± 1.77 |
11.12 ± 1.56** |
|
Ami |
48.32 ± 0.68 |
47.42 ± 0.83 |
52.17 ± 3.61 |
42.95 ± 1.58* |
54.05 ± 0.95 |
34.65 ± 0.62 |
|
Danwon |
45.81 ± 1.26 |
44.25 ± 0.99 |
48.61 ± 1.11 |
45.6 ± 1.88 |
48.96 ± 2.66 |
20.47 ± 1.47* |
|
Daan |
46.37 ± 2.38 |
44.55 ± 2.78 |
51.57 ± 3.28 |
43.57 ± 0.53* |
54.21 ± 0.52 |
10.67 ± 0.64** |
|
Ahwon |
49.81 ± 1.67 |
45.25 ± 2.45 |
46.27 ± 0.91 |
44.42 ± 2.63 |
50.72 ± 0.54 |
42.57 ± 1.79** |
|
Tamsil |
46.17 ± 1.85 |
44.82 ± 1.28 |
47.92 ± 1.48 |
41.10 ± 2.21* |
53.47 ± 0.77 |
21.67 ± 0.81* |
|
Sewon |
42.37 ± 2.04 |
44.70 ± 0.79 |
47.05 ± 1.57 |
40.17 ± 2.48 |
54.65 ± 1.58 |
11.61 ± 1.38* |
|
Haeol |
45.62 ± 1.57 |
44.05 ± 1.06 |
50.20 ± 0.47 |
45.81 ± 2.01 |
49.41 ± 0.54 |
11.02 ± 0.61* |
|
Udo.Coll |
50.07 ± 2.38 |
45.20 ± 1.79 |
50.51 ± 2.15 |
47.60 ± 1.21 |
52.35 ± 1.41 |
20.82 ± 2.18* |
|
Heukhwaseang |
52.77 ± 4.19 |
44.87 ± 2.31 |
49.45 ± 0.81 |
45.23 ± 1.41 |
51.61 ± 1.89 |
22.07 ± 1.99* |
|
Gochang.Coll |
45.82 ± 4.25 |
42.10 ± 2.75* |
49.32 ± 2.78 |
42.45 ± 2.45* |
45.02 ± 9.77 |
18.97 ± 2.31* |
|
F435-5 |
46.51 ± 0.49 |
45.30 ± 1.75 |
49.92 ± 0.62 |
45.67 ± 2.22 |
47.55 ± 2.24 |
21.02 ± 0.15* |
|
Tifton8 |
48.27 ± 0.51 |
44.2 ± 0.8 |
55.37 ± 0.43 |
37.675 ± 0.51* |
50.07 ± 2.38 |
10 ± 16.19** |
References
- Adhikari B, Dhungana SK, Waqas Ali M, Adhikari A, Kim ID, Shin DH. 2019. Antioxidant activities, polyphenol, flavonoid, and amino acid contents in peanut shell. J. Saudi Soc. Agric. Sci.. 18: 437-442.
- Alidu MS, Asante IK, Tongoona P, Ofori K, Danquah A, Padi FK. 2019. Development and screening of cowpea recombinant inbred lines for seedling drought tolerance. J. Plant Breed. Crop Sci.. 11: 1-10.
- Aninbon C, Jogloy S, Vorasoot N, Patanothai A, Nuchadomrong S, Senawong T. 2016. Effect of end of season water deficit on phenolic compounds in peanut genotypes with different levels of resistance to drought. Food Chem.. 196: 123-129.
- Wang X, Yang X, Feng Y, Dang P, Wang W, Graze R, et al. 2021. Transcriptome Profile Reveals Drought-Induced Genes Preferentially Expressed in Response to Water Deficit in Cultivated Peanut (Arachis hypogaea L. ). Front. Plant Sci. 12..
- Ayaz FA, Kadioglu A, Turgut R. 2000. Water stress effects on the content of low molecular weight carbohydrates and phenolic acids in Ctenanthe setosa (Rosc.) Eichler. Can. J. Plant Sci.. 80: 373-378.
- Bacharou Falke A, Hamidou F, Halilou O, Harou A. 2019. Assessment of Groundnut sElite Lines under Drought Conditions and Selection of Tolerance Associated Traits. Adv. Agric.. 2019: 1-10.
- Bhatnagar-Mathur P, Vadez V, Sharma KK. 2008. Trans-genic approaches for abiotic stress tolerance in plants: Retrospect and prospects. Plant Cell Rep.. 27: 411-424.
- Chen W, Kong J, Qin C, Yu S, Tan J, Chen YR, et al. 2015. Requirement of CHROMOMETHYLASE3 for somatic inheritance of the spontaneous tomato epimutation Colourless non-ripening. Sci. Rep.. 5: 1-7.
- Cuc LM, Mace ES, Crouch JH, Quang VD, Long TD, Varshney RK. 2008. Isolation and characterization of novel microsatellite markers and their application for diversity assessment in cultivated groundnut (Arachis hypogaea). BMC Plant Biol.. 8: 1-11.
- De Abreu IN, Mazzafera P. 2005. Effect of water and temper-ature stress on the content of active constituents of Hypericum brasiliense Choisy. Plant Physiol. Biochem.. 43: 241-248.
- De Azevedo Neto AD, Prisco JT, Enéas-Filho J, Gomes-Filho E. Abreu CEBDe2006. Effect of salt stress on antioxidative enzymes and lipid peroxidation in leaves and roots of salt-tolerant and salt-sensitive maize geno-types. Environ. Exp. Bot.. 56: 87-94.
- Delfin EF, Drobnitch ST, Comas LH. 2021. Plant strategies for maximizing growth during water stress and sub-sequent recovery in Solanum melongena L. (eggplant). PLoS One. 16: 1-18.
- Donnelly DM, Dórea JRR, Yang H, Combs DK. 2018. Technical note: Comparison of dry matter measurements from handheld near-infrared units with oven drying at 60℃ for 48 hours and other on-farm methods. J. Dairy Sci.. 101: 9971-9977.
- González L, González-Vilar M. 2001. Determination of relative water content. In Handbook of plant ecophysiology techniques (pp. 207-212). Springer. Dordrecht:
- Hura T, Hura K, Grzesiak S. 2008. Contents of total phenolics and ferulic acid, and PAL activity during water potential changes in leaves of maize single-cross hybrids of different drought tolerance. J. Agron. Crop Sci.. 194: 104-112.
- Janila P, Nigam SN, Pandey MK, Nagesh P, Varshney RK. 2013. Groundnut improvement: Use of genetic and genomic tools. Front. Plant Sci.. 4: 1-16.
- Janila P, Variath MT, Pandey MK, Desmae H, Motagi BN, Okori P, et al. 2016. Genomic tools in groundnut breeding program: Status and perspectives. Front. Plant Sci.. 7: 289
- Juliano T, Lebo Z. 2020. Linking large-scale circulation patterns to low-cloud properties. Atmos. Chem. Phys.. 20: 7125-7138.
- Kalariya KA, Singh AL, Goswami N, Mehta D, Mahatma MK, Ajay BC, et al. 2015. Photosynthetic characteristics of peanut genotypes under excess and deficit irrigation during summer. Physiol. Mol. Biol. Plants. 21: 317-327.
- Kang S, Zhang F, Hu X, Zhang J. 2002. Benefits of CO2 enrichment on crop plants are modified by soil water status. Plant Soil. 238: 69-77.
- Kapoor D, Bhardwaj S, Landi M, Sharma A, Ramakrishnan M, Sharma A. 2020. The impact of drought in plant metabolism: How to exploit tolerance mechanisms to increase crop production. Appl. Sci.. 10: 5692
- Lauriano JA, Ramalho JC, Lidon FC, Do Céu Matos M. 2004. Peanut photosynthesis under drought and re-watering. Photosynthetica. 42: 37-41.
- Laxa M, Liebthal M, Telman W, Chibani K, Dietz KJ. 2019. The Role of the Plant Antioxidant System in Drought Tolerance. Antioxidants. 8: 94
- Leal-Bertioli SCM, Cavalcante U, Gouvea EG, Ballén-Taborda C, Shirasawa K, Guimarães PM, et al. 2015. Identification of QTLs for rust resistance in the peanut wild species Arachis magna and the development of KASP markers for marker-assisted selection. G3: Genes, Genomes, Genet. 5: 1403-1413.
- Lugojan C, Ciulca S. 2011. Evaluation of relative water content in winter wheat. Journal of Horticulture, Forestry and Biotechnolgy. 15: 173-177.
- Luo H, Pandey MK, Zhi Y, Zhang H, Xu S, Guo J, et al. 2020. Discovery of two novel and adjacent QTLs on chro-mosome B02 controlling resistance against bacterial wilt in peanut variety Zhonghua 6. Theor. Appl. Genet.. 133: 1133-1148.
- Mace ES, Phong DT, Upadhyaya HD, Chandra S, Crouch JH. 2006. SSR analysis of cultivated groundnut (Arachis hypogaea L.) germplasm resistant to rust and late leaf spot diseases. Euphytica. 152: 317-330.
- Matsui T, Singh BB. 2003. Root characteristics in cowpea related to drought tolerance at the seedling stage. Exp. Agric.. 39: 29-38.
- Nabi RBS, Tayade R, Hussain A, Adhikari A, Lee I, Loake GJ, et al. 2021. A Novel DUF569 Gene Is a Positive Regulator of the Drought Stress Response in Arabidopsis. Int. J. Mol. Sci.. 22: 5316
- Nabi RBS, Tayade R, Hussain A, Kulkarni KP, Imran QM, Mun B-G, et al. 2019. Nitric oxide regulates plant res-ponses to drought, salinity, and heavy metal stress. Environ. Exp. Bot.. 161: 120-133.
- Nabi RBS, Tayade R, Imran QM, Hussain A, Shahid M, Yun BW. 2020. Functional Insight of Nitric-Oxide Induced DUF Genes in Arabidopsis thaliana. Front. Plant Sci.. 11: 1041
- Nogueira RJMC, Santos RCD. 2000. Physiological Alter-ations in Peanut Submitted to Water Stress. Revista BraSILEIRA DE Engenharia Agricola e Ambiental. 4: 41-45.
- Painawadee M, Jogloy S, Kesmala T, Akkasaeng C, Patanothai A. 2009. Identification of Traits Related to Drought Resis-tance in Peanut (Arachis hypogaea L.). Asian J. Plant Sci.. 8: 120-128.
- Passioura JB. 2012. Phenotyping for drought tolerance in grain crops: When is it useful to breeders? Funct. Plant Biol.. 39: 851-859.
- Rahdari P, Hoseini SM. 2012. Effect of Different Levels of Drought Stress (PEG 6000 Concentrations) On Seed Germination and Inorganic Elements Content in Purslane (Portulaca oleraceae L.) Leaves. J. Stress Physiol. Biochem.. 8: 51-61.
- Rahmianna AA, Purnomo J. Nuryati.2021. Yield performance of several peanut genotypes under two different soil moist-ure availabilities during plant growth. IOP Conf. Ser. Earth Environ. Sci. 803..
- Rosales-Martínez P, Arellano-Cárdenas S, Dorantes-Álvarez L, García-Ochoa F, López-Cortez MS. 2014. Comparison between antioxidant activities of phenolic extracts from mexican peanuts, peanuts skins, nuts and pistachios. J. Mex. Chem. Soc.. 58: 185-193.
- Santos A, Alonso A, Belda I, Marquina D. 2013. Cell cycle arrest and apoptosis, two alternative mechanisms for PMKT2 killer activity. Fungal Genet. Biol.. 50: 44-54.
- Sharma KK, Schuhmann H, Schenk PM. 2012. High lipid induction in microalgae for biodiesel production. Ener-gies. 5: 1532-1553.
- Sirhindi G, Ahmad MM, Fathi AAE, Ahmad P, Gucel S. 2016. Jasmonic acid modulates the physio-biochemical attributes, antioxidant enzyme activity, and gene expre-ssion in glycine max under nickel toxicity. Front. Plant Sci.. 7: 591
- Songsri P, Jogloy S, Vorasoot N, Akkasaeng C, Patanothai A, Holbrook CC. 2008. Root distribution of drought- resistant peanut genotypes in response to drought. J. Agron. Crop Sci.. 194: 92-103.
- Tayade R, Jo H, Lee J. Increasing resistant starch content in legumes for higher nutritional prospect. Front. Plant Sci. 10: pp. 1213.
- Tayade R, Nguyen TD, Oh SA, Hwang YS, Yoon IS, Deshmuk R, et al. 2018. Effective strategies for en-hancing tolerance to high-temperature stress in rice during the reproductive and ripening stages. Plant Breed. Biotechnol.. 6: 1-18.
- Thangella PAV, Pasumarti SNBS, Pullakhandam R, Geereddy BR. DagguMR2018. Differential expression of leaf proteins in four cultivars of peanut (Arachis hypogaea L.) under water stress. 3 Biotech. 8: 1-21.
- Tuberosa R. 2012. Phenotyping for drought tolerance of crops in the genomics era. Front. Physiol.. 3: 1-26.
- Zlatev Z, Lidon FC. 2012. An overview on drought induced changes in plant growth , water relations and photosyn-thesis. Emir. J. Food Agric.. 24: 57-72.