Abstract
A total of 134 domestic and foreign genetic resources were analyzed for their protein and amino acids contents in order to identify breeding lines with high lysine content to improve nutritional components of rice. The protein contents ranged between 6.7% and 14.8%, with an average of 8.7%. The Dharial mutant-derived lines had relatively high protein content with the highest amino acids content of 130.16 mg/g and the highest lysine content of 3.86 mg/g which is about 5 times higher than that of the parent. In the case of mutant-derived lines with high floury endosperm such as Goami2, Dodamssal, Milyang320 and LA1, the total amino acids content was as low as 72.61-82.0 mg/g; however, lysine content ranged high between 2.64-3.35 mg/g with lysine ratio to the total amino acids was 3.6%-4.1% which is higher than the average lysine content ratio of 3.0%. Furthermore, correlation analysis revealed a very strong positive correlation between the total amino acids and total protein contents. In contrast, lysine content showed no significant correlation neither with total amino acids nor with protein contents. The lysine content of Milyang320, which was grown in 5 regions across Korea was 0.33%, showing an increase of about 22% compared to that recorded in Nampyeong (0.27%). Therefore, these data suggest that lysine content of Milyang320 is controlled genetically and could be serve as a source in high lysine rice breeding program.
-
Key words: Rice, Biofortification, Amino acids, Lysine, Protein
INTRODUCTION
Rice is an important food crop along with wheat and corn, and half of the world’s population uses rice as a staple food. However, rice grains lack essential amino acids such as lysine (Lys) that our body cannot synthesize (
Lee et al. 2003;
Ufaz and Galili 2008;
Cohen et al. 2014). For this reason, considerable efforts have been made to improve the nutritional value of various food crops, including rice (
Mertz et al. 1964;
Yu et al. 2005;
Wong et al. 2015). Lysine, a basic essential amino acid with two amino groups, is abundantly present in cheese, eggs, fish, milk, potato, and meat, and serves as an essential component for the growth of children, nitrogen balance in adults, reproductive dysfunction, growth retardation, weight loss, among others, which roles have drawn the attention of food and nutrition related research. In this interest, a recent study revealed that mice fed with high lysine transgenic rice lines for 70 days resulted in the promotion of growth factors such as body weight, food intake and efficiency (
Yang et al. 2017). So far, three strategic approaches have been employed to increase lysine content. The first strategy consisted of overexpressing a lysine biosynthetic gene using molecular biology techniques (
Wong et al. 2015). The second one is resumed in modifying seed storage proteins (
Kawakatsu et al. 2010), while the third method attempted to regulate the metabolism of major genes associated with lysine (
Zhu and Galili 2003;
Long et al. 2013). In their study,
Wong et al. (2015) overexpressed the lysine histone proteins RLRH1 and RLRH2 to increase the lysine content by 35% without changing the content of other essential amino acids, and have suggested that the increase in protein and lysine content positively correlated with floury endosperm. Similarly,
Kawakatsu et al. (2010) increased the lysine content by 56% by silencing the gene regulating the 13-kDa prolamine. In the same way,
Krishnan (1999) reported two mutant lines with increased lysine content in which 14-KDa prolamine decreased and 10-KDa prolamine increased in the seed protein. In addition, as a result of microscopic observation, it was observed that large starch particles and protein bodies were concentrated together with abnormal seed development. In particular, many studies have been conducted using mutants to increase the lysine content.
Yi et al. (2005) selected high lysine mutants through biochemical selection from Hwayeong callus culture in which lysine ratio increased from 3.85% to 4.8%, and observed that the Lys-2 mutant was caused by the Tos17 insertion on chromosome 11.
Kumamaru et al. (1997) reported that the histidine and floury endosperm were increased in all of the 10 high lysine lines (5.1-6.38% increase compared to 4% of the parent (Taichung 65) using the MNU mutant.
And Mertz et al. (1964) also reported a 69% increase in the lysine content of the opaque-2 mutant in corn.
In recent years, with advances in molecular biology research have allowed the development of different sorts of DNA markers that have been used to investigate quanti-tative trait loci (QTLs) associated with amino acid content. In this perspective,
Wang et al. (2008) identified 18 QTLs associated with 19 amino acids in a two-year cultivation test using the Zenshan97/Nanyangzhan combination, and proposed that each of the 19 amino acid related QTLs, which are relatively strongly grouped, are located at the bottom of chromosome 1 of rice. Similarly,
Yoo (2017) also reported that six major amino acid related QTLs, including lysine, were located on chromosome 3 in recom-binant inbred lines (RILs) developed from a cross between Dasan and TR22183. In the same way, 17 QTLs controlling amino acids content and 3 QTLs associated with protein content were identified in a population derived from the combination of the
indica rice Milyang23 and
japonica T887. Among them, two QTLs, qAAC6.1 and qAAC7.1 harboring 10 amino acids, were reported for the first time by
Jang et al. (2020). Moreover, in an association analysis using 84 domestic genetic resources and 25 simple sequence repeat (SSR) markers, 42 marker-trait associations explaining more than 40% of the total variation with amino acids were identified from 15 SSR markers covering chromosomes of 3, 7, and 8 (
Zhao et al. 2009).
Sekhar and Reddy (1982) confirmed that the content of essential amino acids was high in the aromatic rice, and the range of lysine content was 2.82-4.86 gm/100 gm, especially type 3 aromatic lines such as Basmati sufaid 100, Likitimachi, Randhunipagalu and Basmati 370 which have recorded high lysine, phenylalanine, leucine, and methionine contents.
Jia et al. (2013) also confirmed that the accumulation of lysine-rich proteins such as sorbitol dehydrogenase and glyceraldehyde3-phosphate dehydrogenase in corn opaque2 lines increased the lysine content.
Zhao et al. (2015) analyzed the effect of nitrogen according to amino acid composition during ripening stage, and suggested that protein content responds sensitively to the growing environment. During ripening, amino acids content in leaves fluctuate (decrease and increase) for 14 days after flowering, but decrease to a certain concentration thereafter. And positive effect of amino acids and protein contents has been observed to nitrogen level. It is known that a high volume of samples and heavy equipment were required for amino acids analysis. However,
Kim et al. (2007) reported an attempt trial of lysine analysis with a small amount of sample.
Wu et al. (2002) analyzed the protein and amino acid contents using NIRS (near-infrared reflectance spectroscopy), and reported a high RSQ of 0.848 in lysine as well as a high coefficient of determination (RSQ) of 84.8-97.5% in 15 amino acids except cysteine, methionine, and histidine. Meanwhile, Moses
et al. (1988) showed that lysine, methionine, and cysteine contents were significantly reduced when the protein coefficient was 2 or less, while Glycine, Alanine, Threonine, Phenylalanine, Tryptophan, Histidine, Arginine, etc. remained unchanged and others increased. And rice protein is richer in Lysine than wheat, corn, and sorghum, but lower than barley, rye, and triticale, and always lower than oat.
Recently, there have been many reports of using genetic manipulation to increase lysine content.
Yang et al. (2016) showed that the transgenic lines integrating the high lysine related genes HFL1 and HFL2 showed a 25-fold higher lysine content. Despite the dramatic increase of lysine, the protein slightly increased and no side effect was observed such as starch constitution although physico-chemical properties have been improved.
Long et al. (2013) also reported that lysine levels increased by 12-fold in rice leaves and 60-fold in seeds through RNA interference (RNAi) genetic manipulation, and lysine accumulation was further expanded by catabolism in seeds after biosynthesis mainly in leaves. Another study conducted by
Yu et al. (2005) transformed the potato-derived high lysine pollen-specific protein sb401 gene into corn, and the lysine content was shown to increase by 16.1-54.8%, and the total protein content by 11.6-39.0%. In this study, by analyzing the protein and amino acid contents of domestic and foreign cultivated varieties and genetic resources of rice, we attempted to explore high lysine breeding materials for nutritional improvement in rice.
MATERIALS AND METHODS
Plant materials and cultivations
A total of 134 rice genetic resources originated from different countries (China: 8, Europe and America: 2 each, Japan: 17, Philippines: 17, and Bangladesh: 9 of Dharial and its EMS mutant lines) along with Korean varieties and breeding lines (79) were used as genetic materials to perform the experiments. Of this number, 38 belong to
indica and 96 to
japonica subspecies (
Table 1,
Supplementary Table S1). Each lines or varieties were transplanted with the spacing between and within lines of 30 cm × 15 cm, respectively, on a plot maintained with 90 kg/ha N, 45 kg/ha P
2O
5 and 57 kg/ha K
2O during the rice cropping season of 2018, in the experiment field (altitude: 11 m, 35°29′31.4″ N, and 128°44′30.0″ E), located at the National Institute of Crop Science (NICS), Department of Southern Area Crop Science, Miryang, Korea, Other cultivation practices such as pest management were carried out in accordance with the RDA (Rural Development Admini-stration) standard cultivation method.
Prior to analyze protein and amino acids contents, rice grains of each line or variety were dehulled (FC2K, Kett Inc. Tokyo, Japan), and then crushed to fine power with a grinder (Cyclone sample mill, UDY Co., CO, USA), and samples were homogenized. Protein content of 2 repli-cations was analyzed using a carbon/nitrogen analyzer (FP928, LECO, USA). Amino acids content was measured according to the OPA (ortho-phthalaldehyde: Fluorescence Derivatization) method using a fluorescence detector. A homogenized solid sample (protein amount 2-3 mg) was taken and hydrolyzed in about 30 mL 6N hydrogen chloride (HCl) at 130° C for 24 hours, followed by free amino acids analysis by OPA-FMOC derivatization. After the reaction was sequentially mixed with borate buffer, OPA/MPA and FMOC reagent, HPLC system (Ultimate 3000, Dionex Co., Sunnyvale, CA, USA) was used for amino acid content measurement. The analytical column was an Inno C18 column (4.6 mm × 150 mm, 5 μm, Youngjin biochrom, Korea). The mobile phase A was 40 mM sodium phosphate (pH 7.0), and the mobile phase B was DW: acetonitrile: methanol = 10 : 45 : 45 (v/v/v) as gradient conditions (
Table 2). The flow rate was 1.5 mL/minutes and the column temperature was set at 40°C. UV detector (338 nm) and FL detector (1260 FLD, Agilent, CA, USA) were used as detectors. OPA derivatives were detected at emission 450 nm and excitation 340 nm wavelengths, and FMOC derivatives were detected at emission 305 nm and excitation 266 nm wavelengths.
In the perspective of investigating the environmental effects of lysine content, Milyang320 and the comparative cultivar Nampyeong, grown in 5 different regional adap-tability test sites (Miryang, Jeonju, Suwon, Gangwon; Chuncheon, and Gyeonggi; Hwaseong), were subjected to the Ninhydrin method to analyze the constituent amino acids. After hydrolysis pretreatment, Ninhydrin derivatization analysis was performed using an automatic amino acid analyzer (L-8900, Hitachi Co., Tokyo, Japan). The analytical column was an ion exchange column/Hitachi custom ion exchange resin (60 × 4.6 mm ID, Hitachi Co., Tokyo, Japan). A buffer solution (PH-1, PH-2, PH-3, PH-4, PH-RG, Mitsubishi Chemical Co., Tokyo, Japan) and Ninhydrin coloring kit (Wako Pure Chemical, Osaka, Japan) were used for mobile phase. Amino acid was measured at 570 nm and 440 nm wavelengths using a UV-Vis detector.
Statistical analysis
The data was obtained with a bulk sample for free amino acids and in triplicate for constituent amino acid. The correlation and factor analysis between free amino acids and proteins was applied using Statistical Analysis System (SAS, version 9.4, Cary, NU, USA). One-way analysis of variance (ANOVA) was used, and where applicable, the Duncan's multiple comparison test was used to test the difference between groups at P < 0.05 level. The correlation between amino acid and protein contents was expressed by Pearson's correlation coefficient.
RESULTS
Differential protein contents in tested rice lines
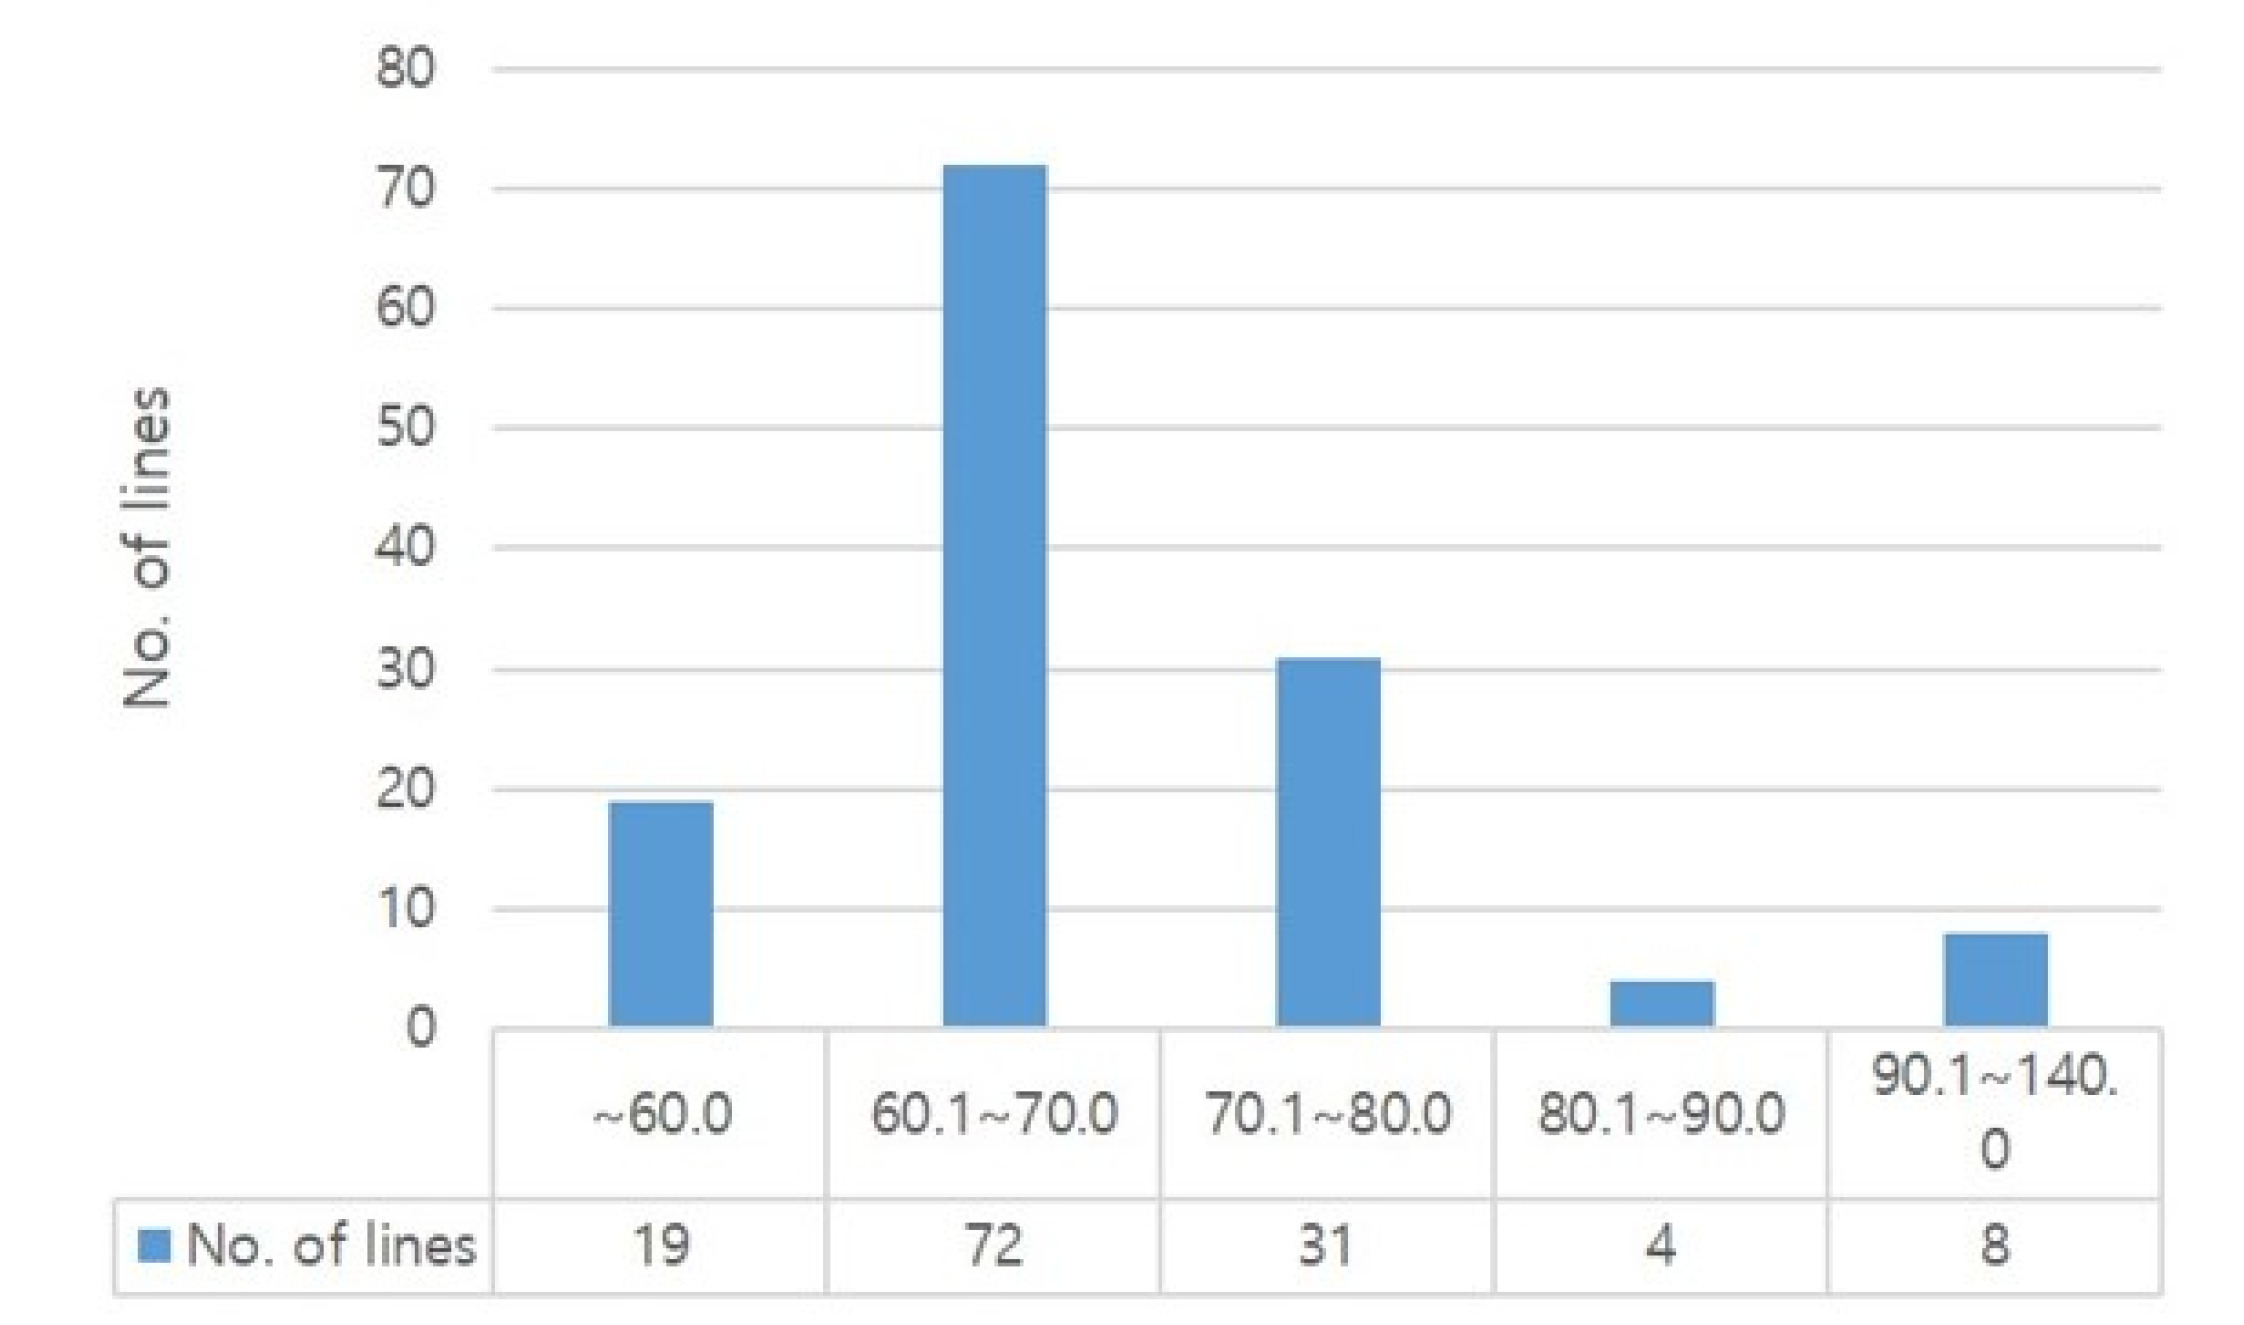
A total of 134 domestic and foreign rice lines were examined for their protein content. Data in
Table 3 indicate that the highest protein contents were recorded in seven (7) rice lines (Dharial mutant C39, C45, C136, C225, C162, C207, C237), and ranged between 12.9% and 14.8%. However, the lowest protein contents of 6.7%-6.9% were observed in YR30635-11-2-4 and Kusahonami. In addition, 37 rice lines had 7.1%-8.0% protein contents, followed by 8.1%-9.0%, 9.1%-10.0%, and 11.1%-12.8% recorded in 57, 17 and 4 rice lines, respectively. Considering all tested lines, an average protein content of 8.7% with lower and upper limits of 6.7% and 14.8%, respectively (
Table 3,
Fig. 1). Among the domestic japonica rice varieties, Jinsumi showed the lowest protein content of 7.3%, while Nunkeunheukchal had 10.4% protein content. Interestingly, the Dharial mutant strains showed a relatively high protein content of 12.9% to 14.8% compared to that of the parent (9.3%). Among the foreign rice varieties, Hasawi IRGC16817, C18, and Galileo showed a high protein content of 10.7%, 10.2%, and 10.1%, respectively. In particular, varieties with high floury endosperm, such as Goami2, Goami4 and Dodamssal which were derived from Ilpum mutation, and Milyang320 derived from LA1 (low allergy, Japan) exhibited protein contents ranging from 9.2% to 9.8%.
We measured the content of essential amino acids in the 134 rice genetic materials. As shown in
Fig. 2, 53.7% (72 lines) of lines were distributed in range of 60.1-70.0 mg/g for total amino acid content. And the average total amino acid content was of 69.31 mg/g, with Dharial mutant C162 having the highest total amino acid content of 130.16 mg/g, followed by Dharial mutants C237 (129.0 mg/g), C45 (124.77 mg/g), and C207 (110.63 mg/g); whereas, Chucheong recorded the lowest amino acid content of 48.02 mg/g (
Table 4,
Supplementary Table S1). In addition, the average lysine content of all rice lines was 2.06 mg/g, and the lowest and highest values ranged between 0.80 and 3.86 mg/g, respectively. Of all tested rice varieties, Dharial had a total amino acid content of 53.7 mg/g which is among the lowest. Dharial mutant lines showed 64.42-130.16 mg/g lysine content, indicating up to 2-fold change (
Supplementary Table S1). Dharial mutant C162, which recorded the highest total protein content, also had a high lysine content of 3.75 mg/g, estimated to be about five times higher than that of the parent.
From another perspective, we analyzed the ratio between lysine and total protein contents in each rice lines. As shown in
Fig. 3, 61 lines (45.5%) were distributed in range of 3.1-3.5% for lysine ratio to total amino acid content. And our data show that the proportion of lysine to the total amino acid content ranged between 1.5% and 4.1% with an average of 3.0%. Meanwhile, the high floury endosperm rice, such as Goami2, Goami4, Dodamssal, Milyang320 derived from Ilpum and LA1, showed a relatively low total amino acid content of 72.61-82.0 mg/g with the lysine content was 2.64 to 3.35 mg/g. However, the proportion of lysine content to the total amino acid ranged between 3.6% and 4.1% which is high compare to the average (
Table 5,
Supplementary Table S1). Similar patterns of increased lysine content of opaque-2 mutants in maize were previously reported (
Mertz et al. 1964;
Jia et al. 2013). In correlation coefficient study, the total amino acid content showed a very strong positive correlation with the total protein content. However, in case of lysine, there was no significant correlation with total amino acid and protein contents. In essence, a very strong correlation was obtained between valine and isoleucine (R = 0.947) and a low negative correlation exists among most essential amino acids (
Table 6,
Fig. 4).
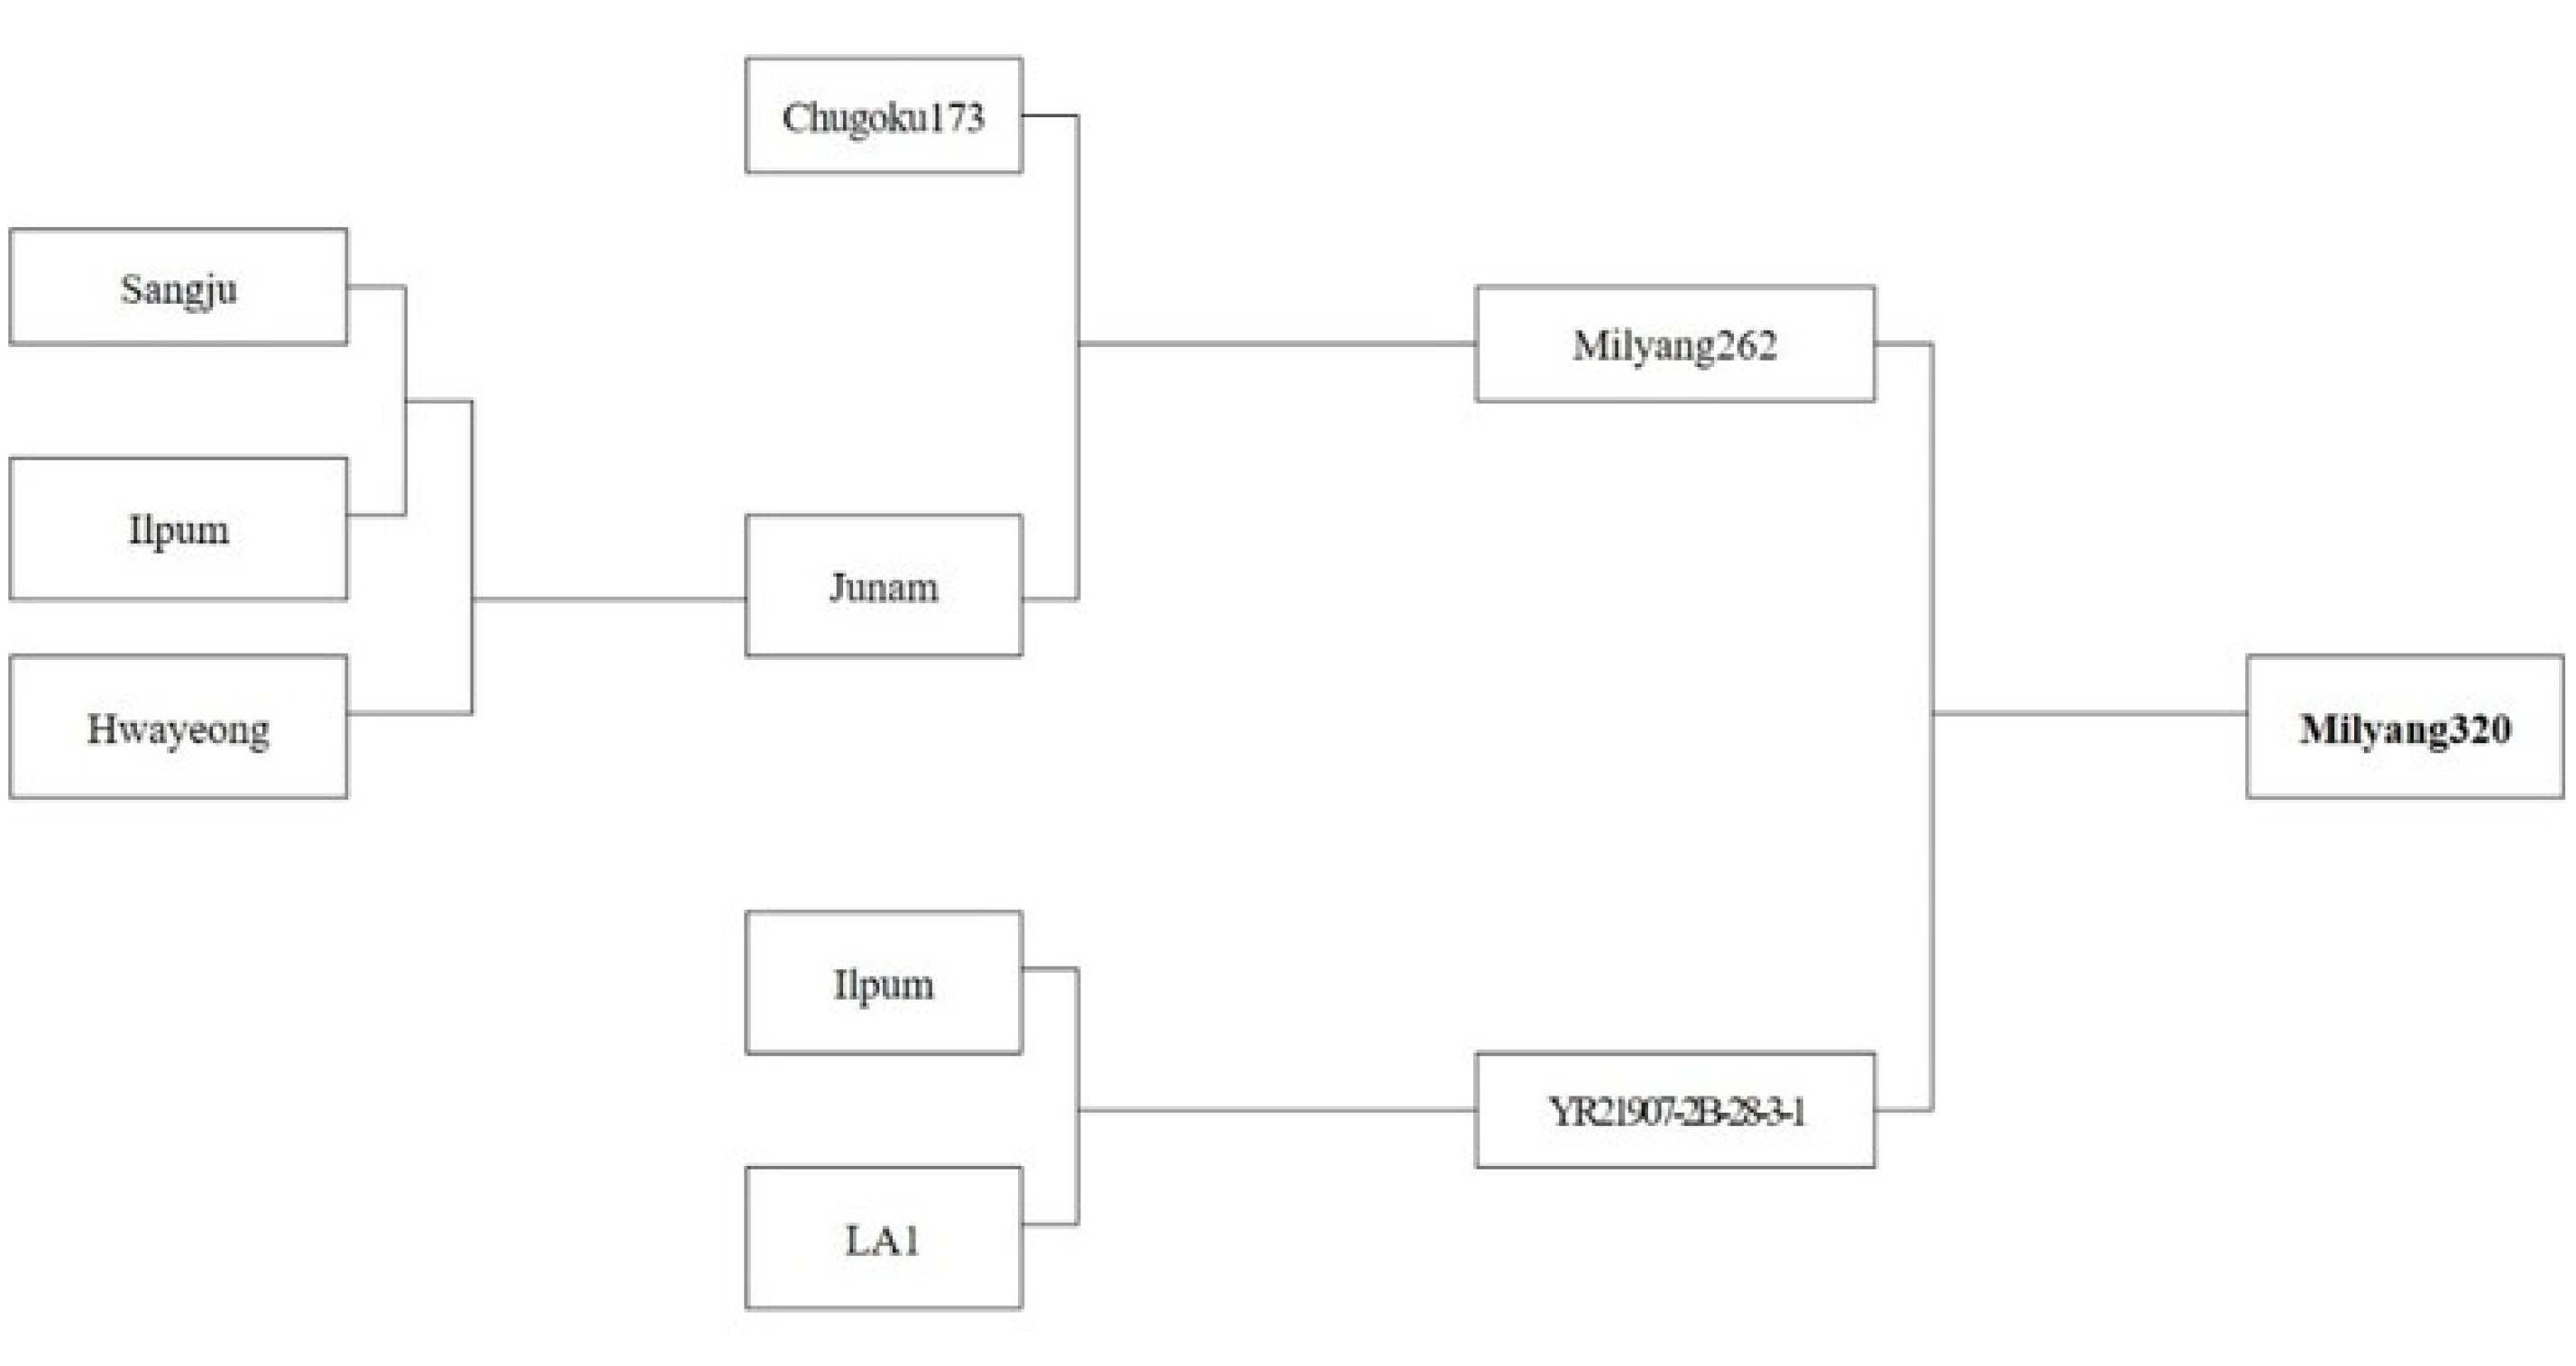
Milyang320 derived from a cross of Geonyang2 (Milyang262, low glutelin content originated from Chugoku173) and YR21907-2B-28-3-1 (low allergy originated from LA1) is a functional rice line showing an opaque endosperm with low amylose content (10.0%) and low glutelin and allergen protein at the same time (
Fig. 5). Compared to Nampyeong, opaque endosperm rice lines Milyang320 and LA1 showed increased lysine content (11% and 30%, respectively) (
Table 7). In addition, in order to investigated the genetic basis underlying the fact that the lysine content of Milyang320 is not affected by the environment, Milyang320 grown at different 5 locations across the nation was studied. And the results indicate that Milyang320 had 0.33% lysine content, which is about 22% increase compared to that of Nampyeong. Thus, this study suggests that lysine content of Milyang320 could be genetically controlled, and its stability was verified when Milyang320 was cultivated in different environments (
Table 8,
Fig. 6).
DISCUSSION
Many efforts have been made to improve the nutritional components of carbohydrate-oriented food crops that are protein deficient, including rice, wheat, and corn. Among them, lysine (Lys), regarded as one of the most important essential amino acids, together with methionine (Met) and trytophan (Thr), are known to be synthesized through the aspartate biosynthesis family pathways, within which lysine and methionine are produced by two different branches, the lysine branch and the threonine-methionine branch that compete for the same carbon/amino substrate (
Galili 2002). It is said that the common method for amino acids analysis is challenging (
Kim et al. 2007), and the content of amino acids is also known to be greatly affected by the cultivation environment (
Zhao et al. 2015). Recently, the use of molecular biology approaches has increased, and important achievements have been reported, including anther culture (
Yi et al. 2005) and chemical mutation breeding (
Kumamaru et al. 1997) to increase the content of lysine. Thus, it is necessary to activate various mutant breeding programs to improve the protein and ingredients contents in food crops. Our data showed that in the Dharial weedy rice originated from Bangladesh used in this study, protein and total amino acid contents were relatively low with 9.3% and 53.7 mg/g, respectively. Whereas, the mutant lines showed a relatively high protein and amino acid content range of 12.9%-14.8% and 64.42-130.16 mg/g, respectively. However, the ratio of lysine to total amino acid was 1.8%-3.0%, which was lower than the average of 3.0% (
Supplementary Table S1). Then, in case of Dharial mutant line showing a high amino acid content, lysine content increased concomitant with the increase in protein content. Therefore, it appears that it may not be recommendable to use rice lines with high protein directly in breeding programs to increase the lysine content. However, as shown in
Table 6 and
Fig. 4, a strong positive correlation was observed between the protein content and the total amino acid content. In this regard, simply increasing the protein content is could be an alternative for biofortification of rice through mutation breeding.
Unlike the report by
Sekhar and Reddy (1982), a variety with a high lysine content could not be identified in the flavor variety in the present study. This could be the cause of different cultivation environments, such as fertilization and temperature as well as the narrow range of genetic resources used. However, the proportion of lysine was found to be relatively high in floury endosperm lines as in the mutants of corn and rice (
Mertz et al. 1964;
Kumamaru et al. 1997). Based on the reference, we analyzed the content of lysine and total amino acid from Milyang320 and LA1 showing floury endosperm, and our data confirmed that the lysine contents of floury rice were higher than that of a normal endosperm rice Nampyeong (
Table 7). Such an example of a high floury characteristic can be an indicator to help effectively select a line with a high lysine content in mutant breeding programs, which is costly and time consuming for selection and analysis. In case of Milyang320, the lysine content was constantly high compare to that of control cultivar Nampyeong across the 5 different environment locations (
Table 8,
Fig 6), which would indicate that the lysine content of Milyang320 is controlled genetically and is stable across cultivation environments. Therefore, it is thought that the high lysine content lines such as Dharial mutants (high in protein content) and Milyang320 (high lysine ratio to the total amino acids) could be used as breeding materials to improve lysine content as well as for biofortification of rice.
SUPPLEMENTARY MATERIALS
ACKNOWLEDGEMENTS
This work was supported by the Rural Development Administration (Project title: Development of functional rice variety for fusion and complex of valuable charac-teristics, Project No.: PJ01428202), Republic of Korea. We would like also to appreciate Dr. Nkulu Rolly Kabange (DSACS, NICS, RDA) for kindly helping with English revision.
Fig. 1Distribution of protein content used in free amino acid analysis.
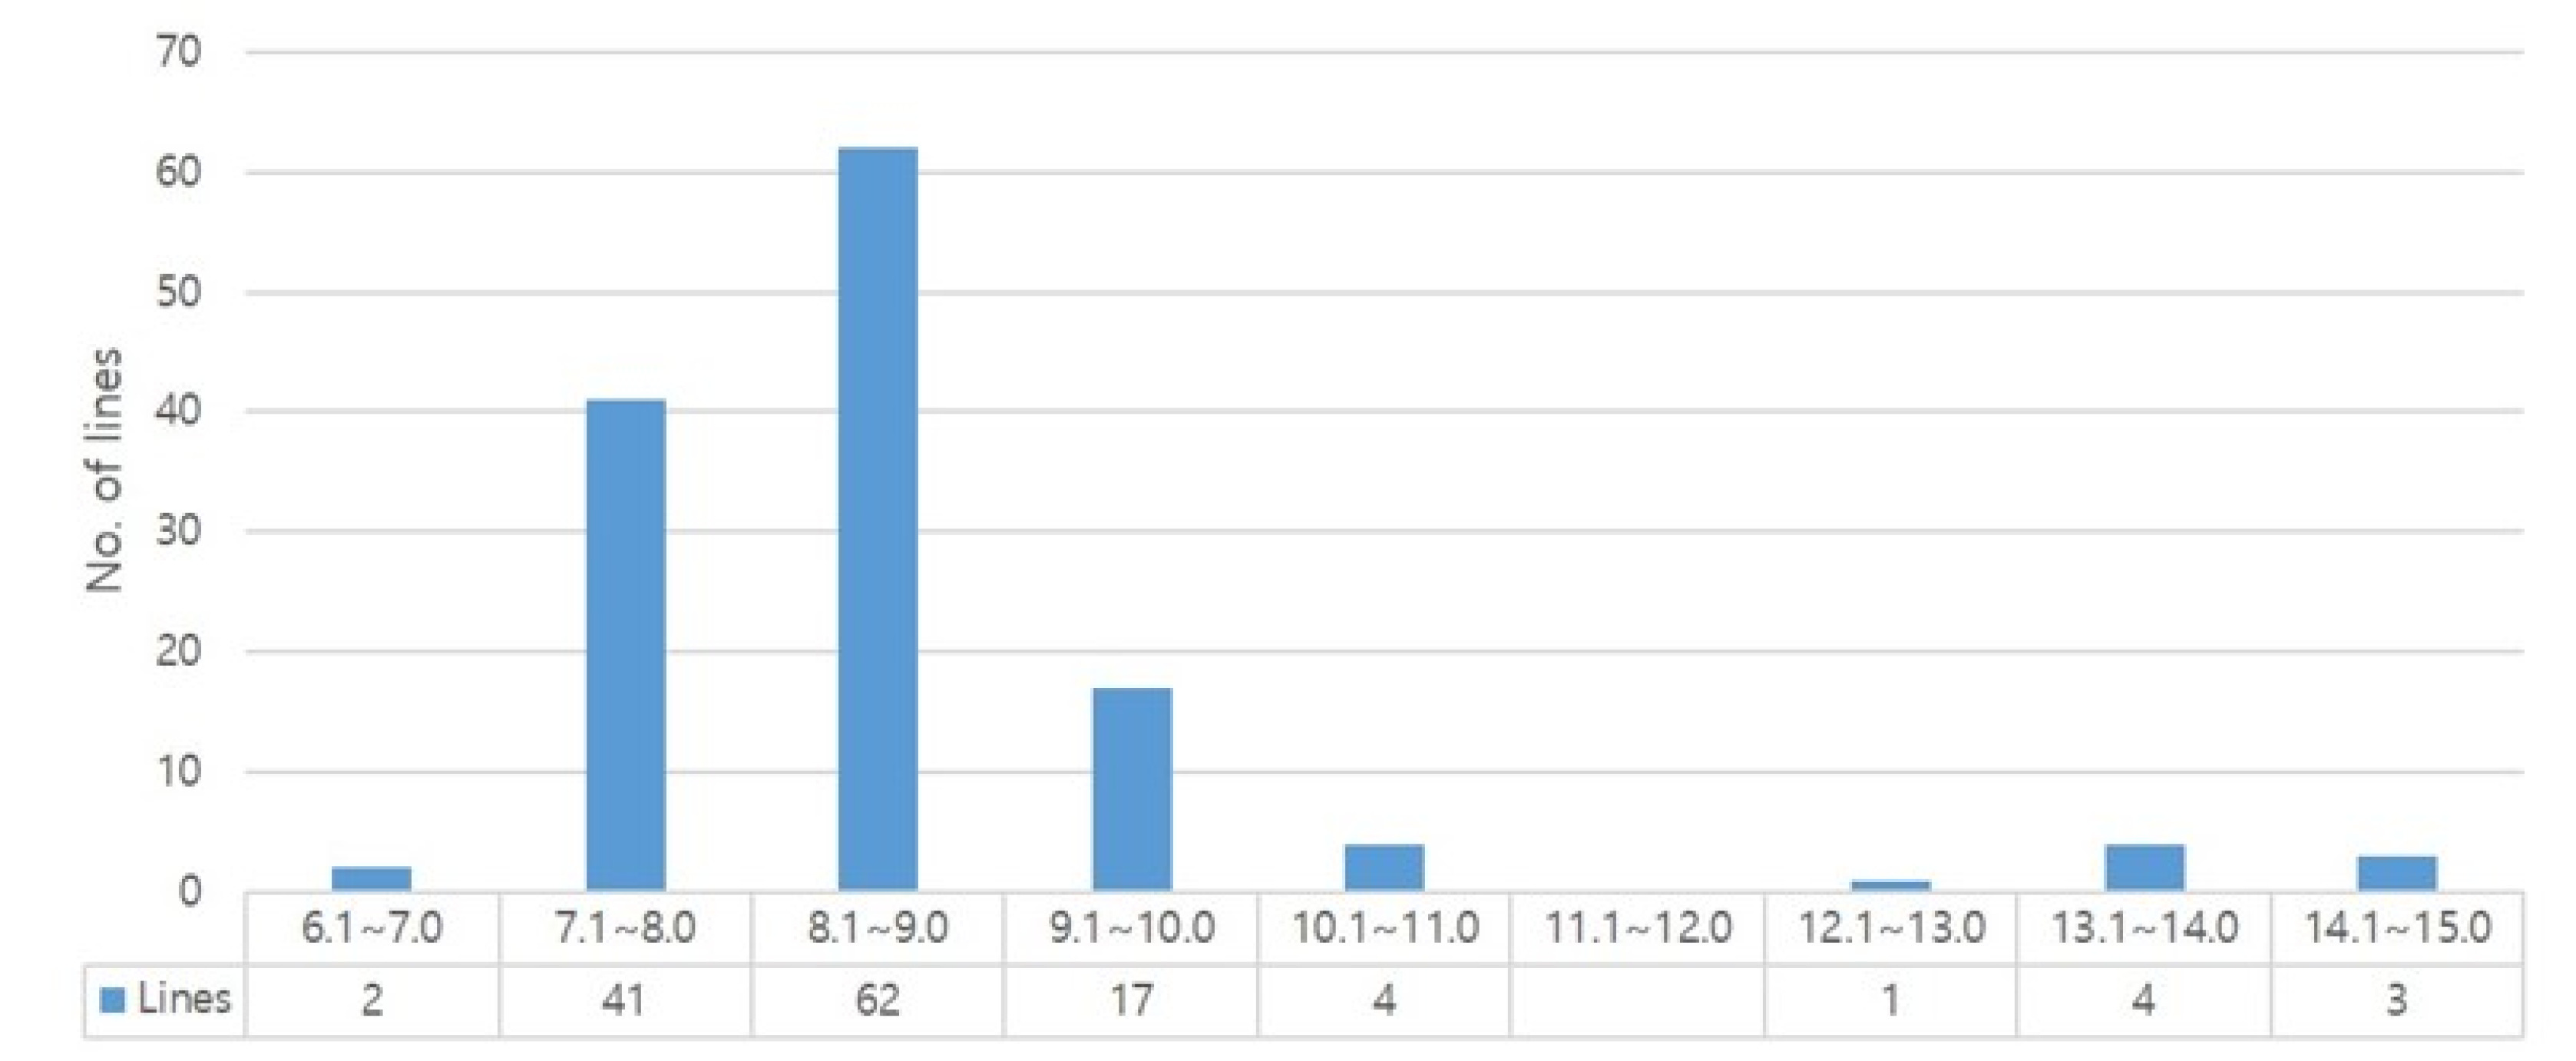
Fig. 2Distribution of total amino acid content.

Fig. 3Distribution of lysine ratio to total amino acid content.
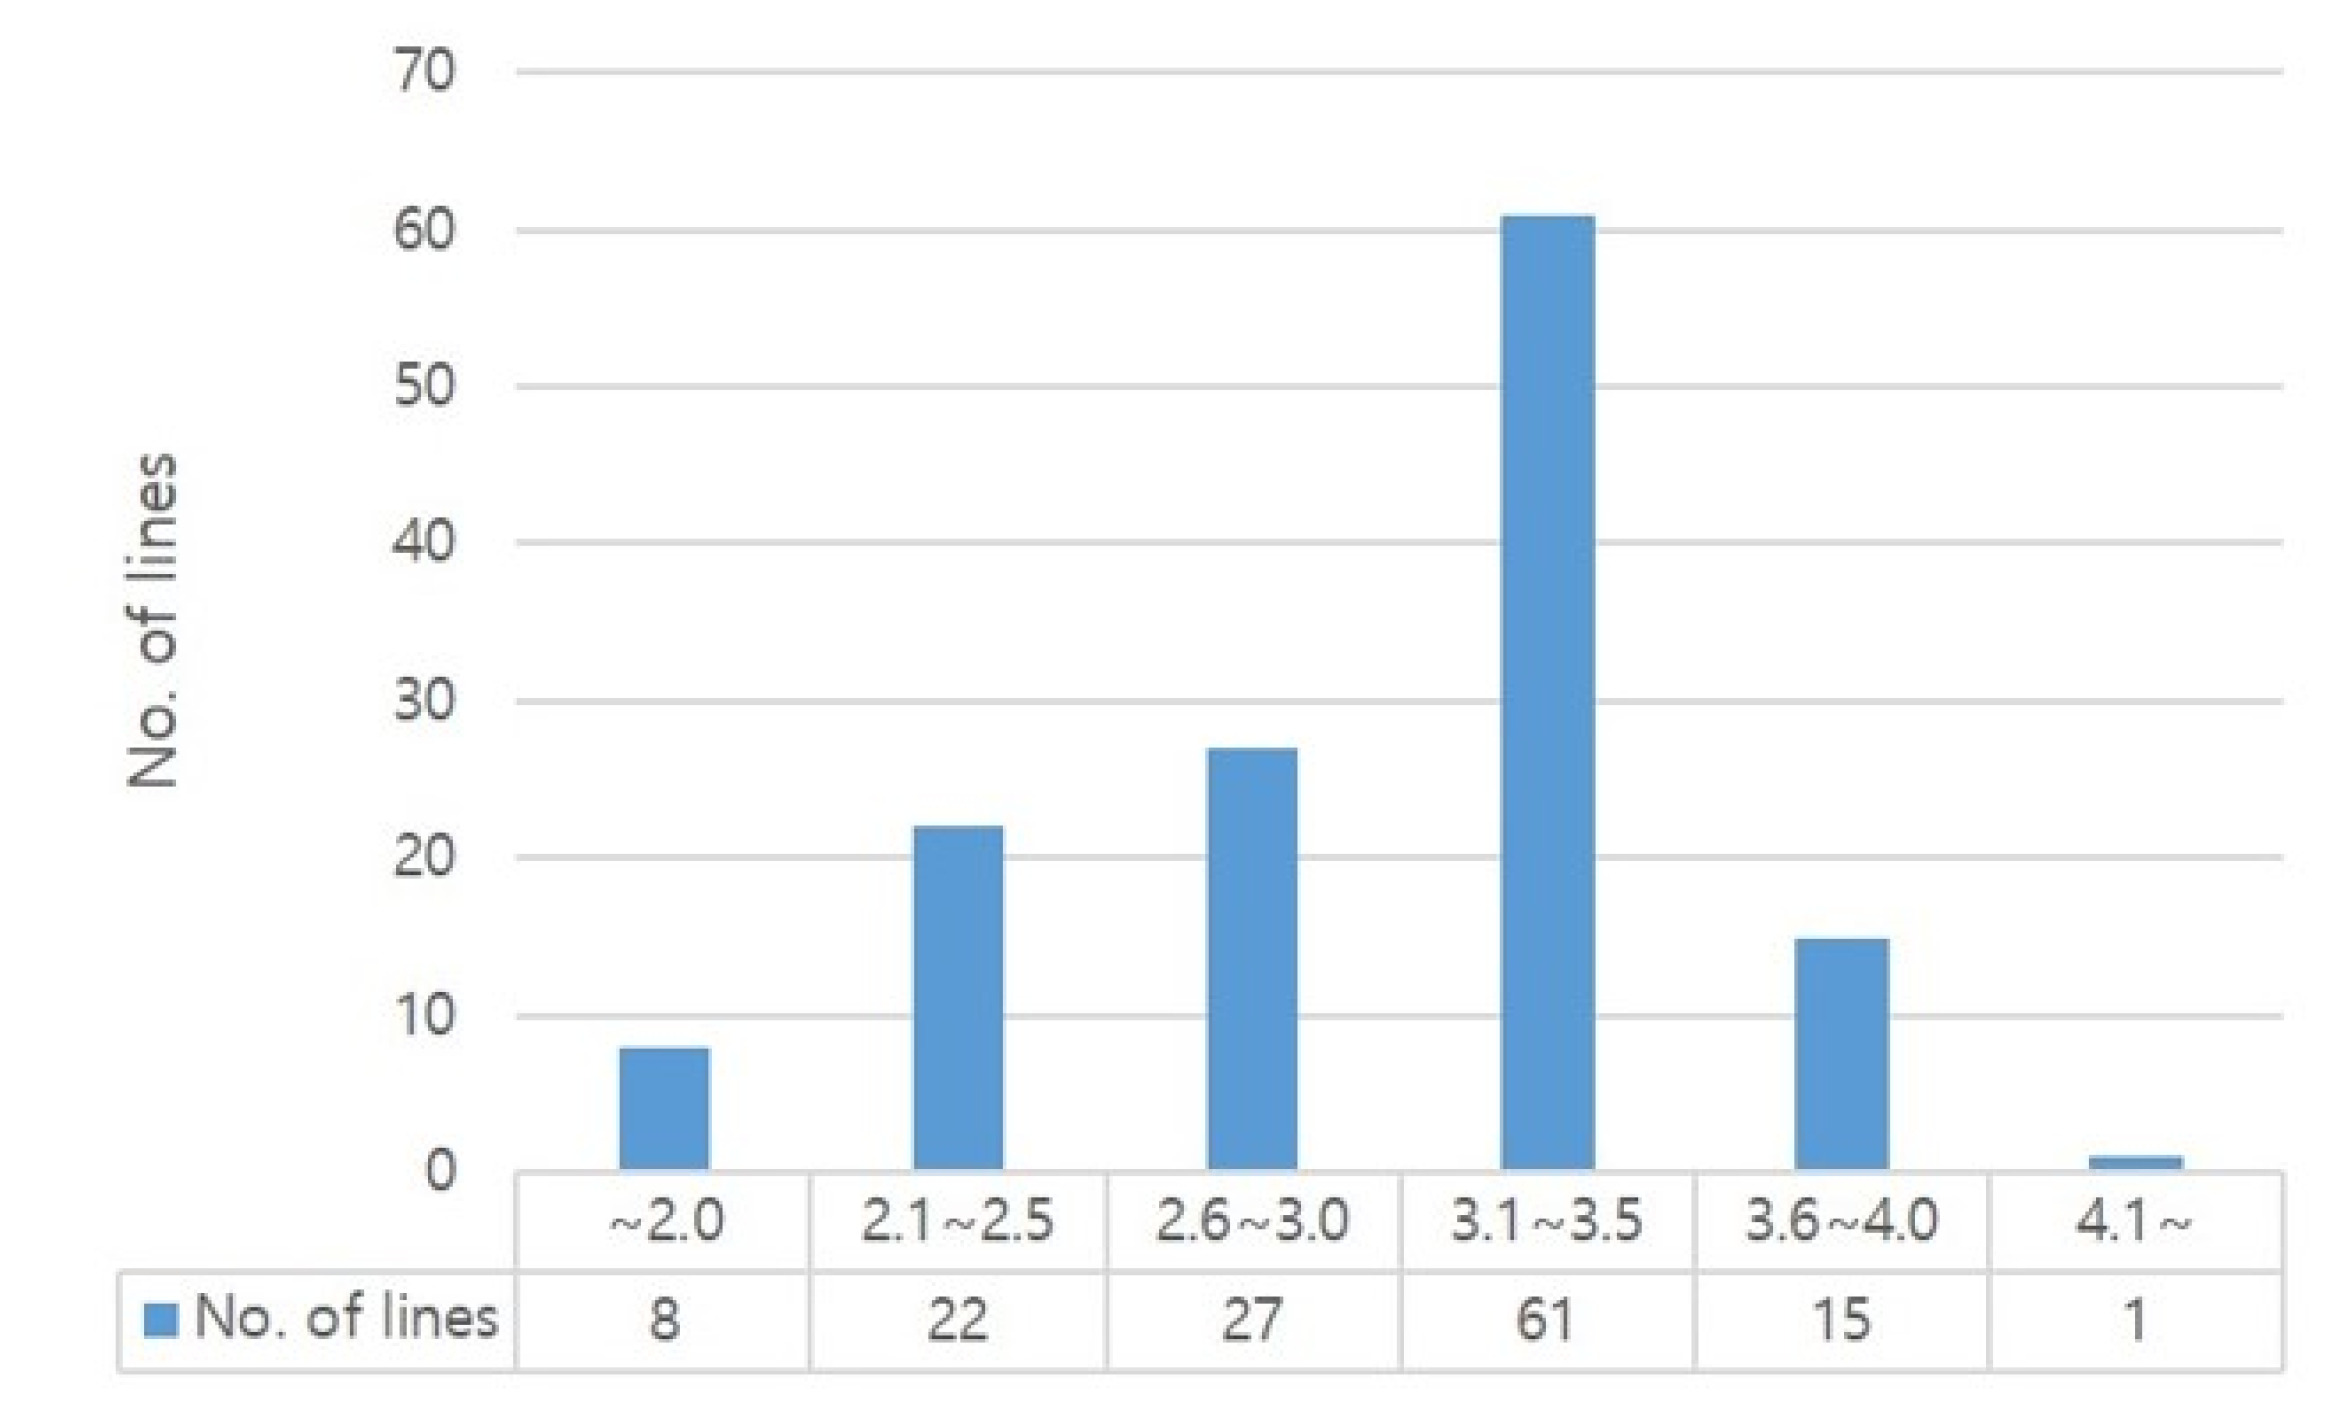
Fig. 4Factor analysis of essential amino acids and protein content.
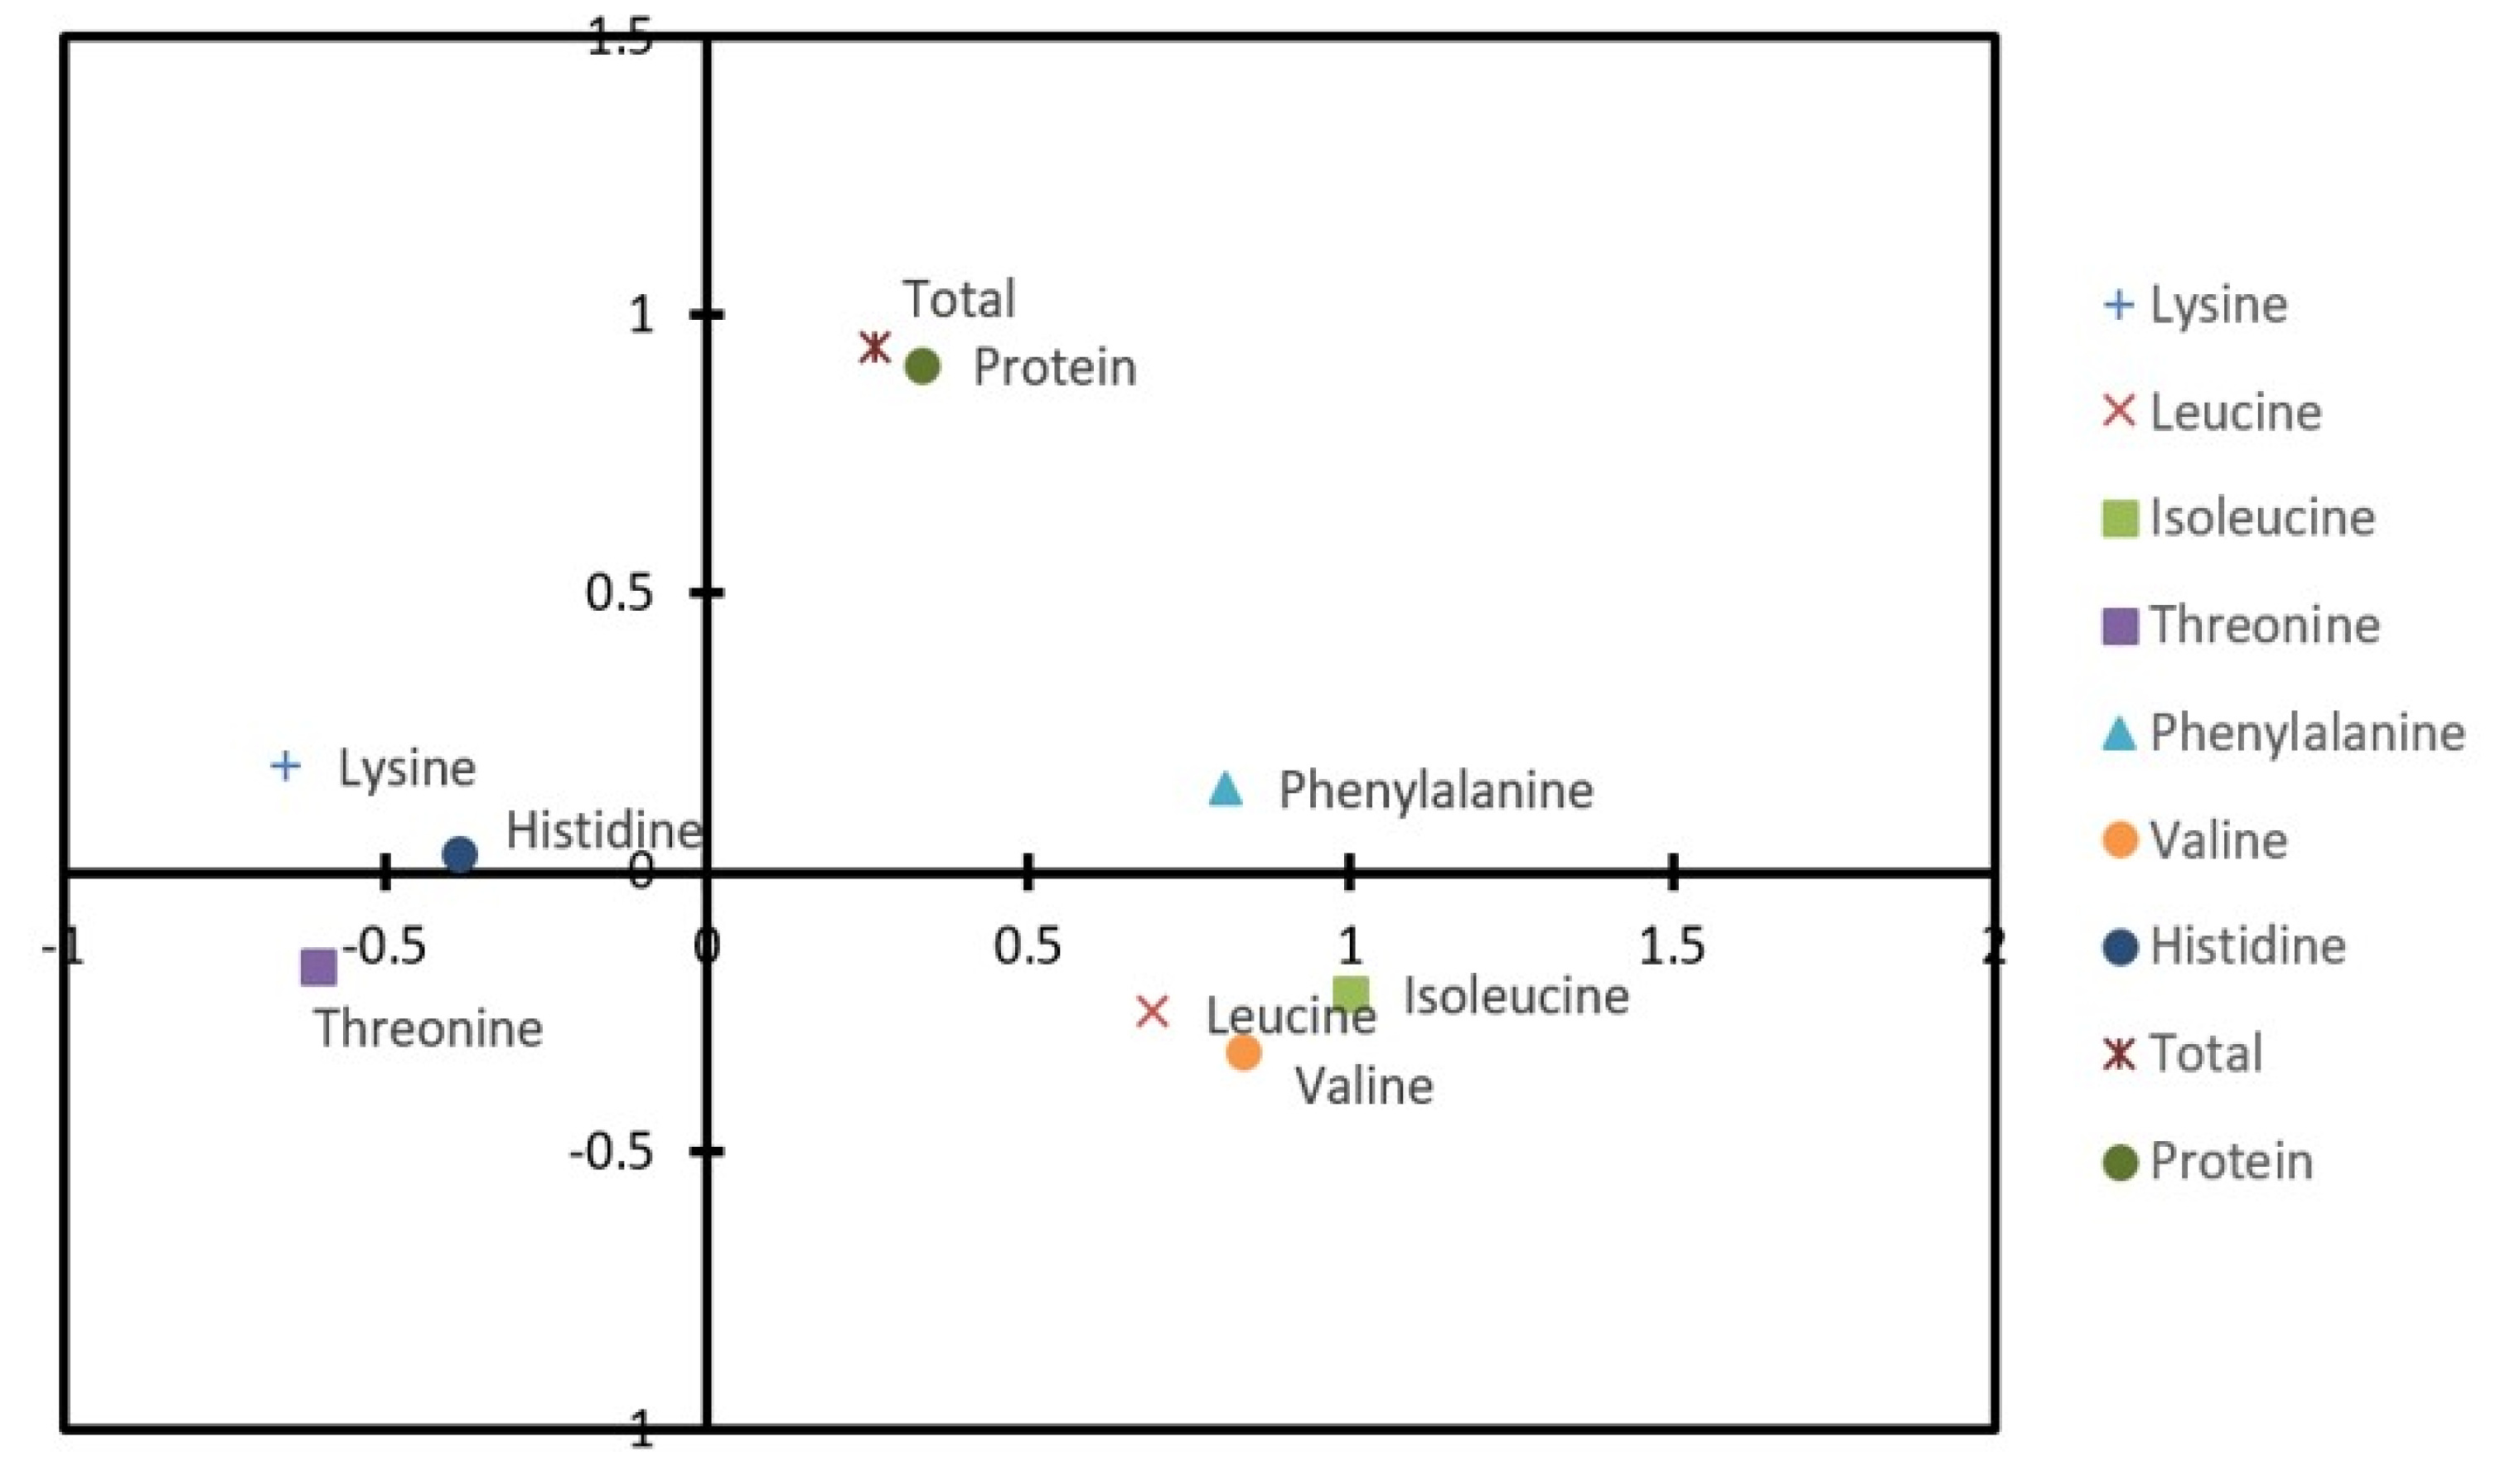
Fig. 5Genealogical diagram of ‘Milyang320’.

Fig. 6Lysine content of ‘Milyang320’ cultivated on 5 different regions.
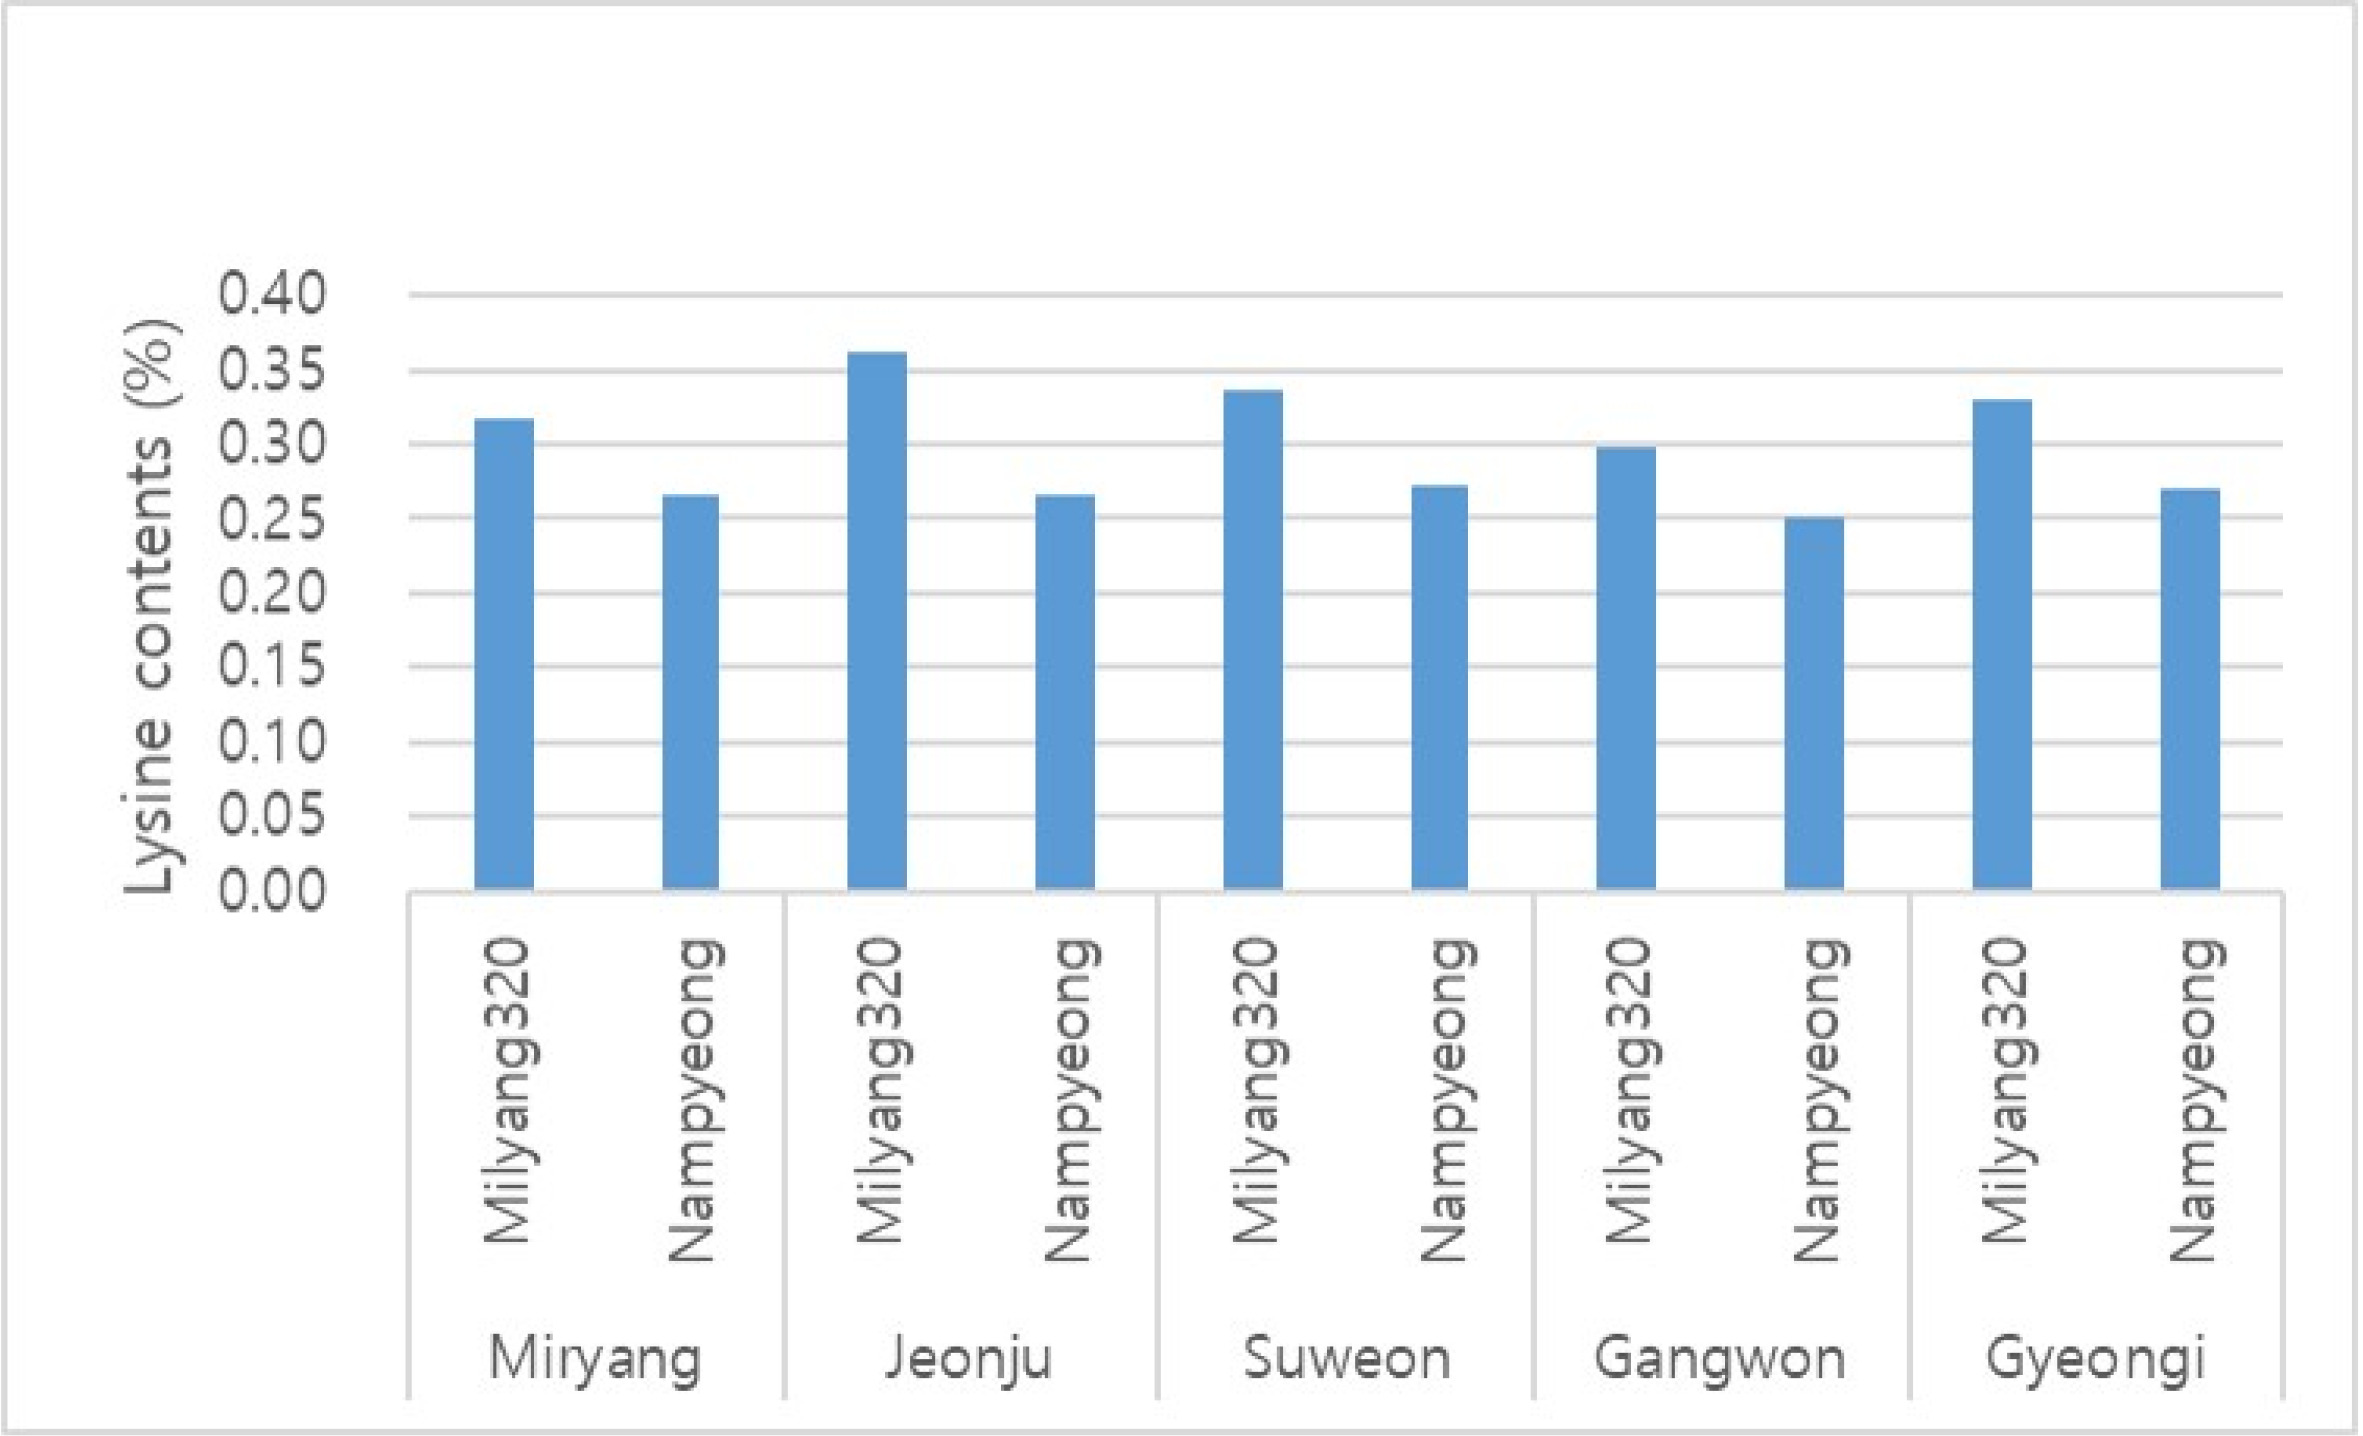
Table 1Number of plant materials used in free amino acid content analysis.
Table 1
|
Origin |
Subspecies |
Total |
|
Japonica
|
Indica
|
|
Korea |
70 |
9 |
79 |
|
Japan |
13 |
4 |
17 |
|
China |
7 |
1 |
8 |
|
Philippines |
2 |
15 |
17 |
|
EU |
2 |
0 |
2 |
|
USA |
2 |
0 |
2 |
|
Bangladesh |
0 |
9 |
9 |
|
Total |
96 |
38 |
134 |
Table 2HPLC conditions for the analysis of free amino acid.
Table 2
|
Time (minutes) |
Mobile phase (A) |
Mobile phase (B) |
|
0.0 |
95 |
5 |
|
3.0 |
95 |
5 |
|
24.0 |
45 |
55 |
|
25.0 |
20 |
80 |
|
31.0 |
20 |
80 |
|
34.5 |
95 |
5 |
|
35.0 |
95 |
5 |
Table 3Protein contents of 134 lines used in free amino acids analysis.
Table 3
|
No. of lines |
lines |
Protein contents (%) |
|
2 |
YR30635-11-2-4, Kusahonami |
6.7-6.9 |
|
37 |
Baekogchal, Boramchan, Geumgang1, Haiami, Heugjinmi, Hopum, Hwaseong, Hyeonpum, Ilmi, Jinsumi, Junam, Keunnun, Keunpum, Miho, Saeilmi, Saeilpum, Saenuri, Samkwang, Seolgaeng, Yeonghojinmi, Youngjin, Milyang330, YR30100-15-4-2, YR30098-4B-377, YR29150-1, Koshihikari, Milky Queen, Satojiman, Akenohoshi, Dragon Eye ball 100, Hosiaoba, IR24, Kasalath, LGC-1, Midorinomochi, Sasanishiki BL4, YR27499-B-B-B-327-1-1 |
7.1-8.0 |
|
57 |
Aranghyangchal, Aromi, Baegjinju1, Chucheong, Dasan2, Deuraechan, Dongjin1, Geonganghongmi, Geonyang2, Goami, Hanareum2, Hanareum4, Hanareumchal, Heughyangchal, Heugnam, Hongjinju, Hwawang, Hyangmibyeo2, Jeogjinju, Jeogjinjuchal, Jinmi, Jopyeong, Josaengheugchal, Mipum, Nampyeong, Odae, Saegoami, Saemimyeon, Sanggol, Shingil, Shingwang, Shinpyeong, Milyang331, YR30636-1-3-1, YR29278-18-3-1-2, YR30054-4B-137, YR30056-4B-180, YR28744-B-B-B-1, Akidagomachi, Apo, Bugkyeong2012-2, Cheongmu, Habataki, IR64, IR72, Gillim collection 1, IR66, IR73103-B-1-1-2-1-K1, Kinuhikari, Lemont, LGC-soft, IC19 |
8.1-9.0 |
|
Manjushree, Musashino7, N29, Odorokimochi, Sanghaehyanghyeolna |
|
17 |
Anmi, Danpyeong, Dodamssal, Goami2, Goami4, Heugjinju, Unkwang, Milyang320, Basmati389, Cakmak, Hawn, Kendao12, LA1, Langdao7, IC35, Sanya4, Dharial |
9.1-10.0 |
|
4 |
Nunkeunheukchal, C18, Hasawi IRGC16817, Galileo |
10.1-11.0 |
|
0 |
- |
11.1-12.8 |
|
7 |
Dharial derived mutant C39, C45, C136, C225, C162, C207, C237 |
12.9-14.8 |
Table 4Content of essential amino acids among leading valuable lines used in the analysis.
Table 4
|
Lines |
Amino acids contents (mg/g) |
|
Aspartic acid |
Glutamic acid |
Serine |
Histidine |
Glycine |
Threonine |
Arginine |
Alanine |
Tyrosine |
Valine |
Phenyl-alanine |
Isoleucine |
Leucine |
Lysine |
Proline |
Total |
|
Aromi |
7.18 |
16.16 |
4.15 |
1.72 |
3.25 |
3.50 |
6.20 |
4.55 |
2.11 |
4.53 |
4.19 |
3.19 |
6.41 |
1.90 |
2.16 |
71.20 |
|
Chucheong |
5.11 |
10.83 |
3.22 |
1.43 |
2.60 |
2.57 |
4.27 |
3.62 |
0.84 |
2.86 |
2.61 |
1.87 |
4.35 |
1.08 |
0.75 |
48.02 |
|
Dharial mutant C39 |
6.69 |
14.11 |
3.82 |
1.56 |
2.94 |
3.26 |
6.12 |
4.09 |
1.83 |
4.05 |
3.72 |
2.78 |
5.74 |
1.78 |
1.93 |
64.42 |
|
Dodamssal |
7.56 |
14.96 |
4.26 |
1.93 |
3.64 |
4.01 |
6.76 |
4.67 |
2.00 |
4.31 |
4.17 |
2.96 |
6.35 |
2.64 |
2.39 |
72.61 |
|
Geonyang2 |
6.96 |
16.71 |
4.51 |
1.87 |
3.78 |
3.06 |
6.91 |
5.14 |
2.75 |
4.78 |
4.29 |
3.28 |
7.59 |
2.03 |
1.49 |
75.17 |
|
Dharial mutant C45 |
12.74 |
28.12 |
7.30 |
3.43 |
5.90 |
5.27 |
10.98 |
7.67 |
4.05 |
7.70 |
7.63 |
5.52 |
11.35 |
3.86 |
3.25 |
124.77 |
|
Goami |
7.45 |
16.35 |
4.50 |
1.91 |
3.69 |
3.98 |
6.34 |
4.82 |
1.99 |
4.28 |
4.26 |
2.97 |
6.69 |
2.40 |
2.12 |
73.74 |
|
Goami2 |
8.99 |
16.49 |
5.05 |
2.28 |
4.55 |
4.72 |
7.49 |
5.55 |
2.28 |
4.87 |
4.59 |
3.34 |
7.18 |
3.35 |
2.07 |
82.80 |
|
Goami4 |
8.99 |
15.92 |
4.82 |
2.22 |
4.42 |
4.31 |
7.47 |
5.34 |
2.20 |
4.74 |
4.46 |
3.26 |
6.79 |
3.12 |
1.80 |
79.87 |
|
Haiami |
6.94 |
14.00 |
3.94 |
1.90 |
3.37 |
3.33 |
5.16 |
4.22 |
1.02 |
3.75 |
3.64 |
2.58 |
5.75 |
2.36 |
2.57 |
64.52 |
|
Hanareum2 |
7.04 |
15.05 |
4.29 |
1.90 |
3.57 |
4.00 |
6.01 |
4.56 |
1.99 |
4.15 |
4.05 |
2.85 |
6.35 |
2.37 |
1.56 |
69.76 |
|
Milyang23 |
7.13 |
16.10 |
4.47 |
1.86 |
3.53 |
3.88 |
6.99 |
4.77 |
2.25 |
4.53 |
4.38 |
3.18 |
6.78 |
2.15 |
1.17 |
73.16 |
|
Nampyeong |
6.42 |
14.14 |
4.18 |
1.64 |
3.49 |
3.78 |
6.26 |
4.27 |
1.92 |
3.65 |
3.75 |
2.55 |
5.82 |
2.08 |
0.92 |
64.88 |
|
Nunkeunheukchal |
8.82 |
18.32 |
5.29 |
2.28 |
4.31 |
4.48 |
8.07 |
5.49 |
2.52 |
4.75 |
4.90 |
3.36 |
7.43 |
2.53 |
1.58 |
84.12 |
|
Saeilmi |
5.99 |
13.06 |
3.73 |
1.57 |
0.05 |
3.02 |
5.51 |
4.05 |
1.40 |
3.65 |
3.52 |
2.49 |
5.31 |
1.57 |
1.74 |
56.65 |
|
Dharial mutant C162 |
12.87 |
29.56 |
7.52 |
3.51 |
5.53 |
5.50 |
11.86 |
7.94 |
4.64 |
7.94 |
7.94 |
5.64 |
11.80 |
3.75 |
4.16 |
130.16 |
|
Milyang320 |
8.06 |
16.08 |
4.56 |
2.49 |
3.78 |
3.63 |
7.05 |
5.34 |
2.45 |
5.04 |
4.39 |
3.48 |
7.37 |
2.87 |
2.40 |
78.97 |
|
Basmati389 |
6.92 |
14.85 |
4.03 |
1.68 |
3.13 |
3.70 |
6.36 |
4.49 |
2.32 |
4.58 |
4.15 |
3.30 |
6.47 |
1.42 |
1.54 |
68.94 |
|
IR72 |
6.48 |
15.01 |
4.11 |
1.68 |
3.31 |
3.92 |
6.12 |
4.59 |
2.17 |
4.23 |
4.11 |
3.06 |
6.37 |
1.31 |
0.70 |
67.17 |
|
Koshihikari |
5.22 |
11.47 |
3.19 |
1.43 |
2.57 |
2.92 |
5.28 |
3.52 |
1.60 |
3.35 |
3.13 |
2.38 |
4.93 |
1.08 |
0.64 |
52.72 |
|
Dharial mutant C207 |
10.42 |
25.20 |
6.71 |
2.61 |
5.19 |
5.35 |
10.66 |
7.09 |
4.04 |
6.89 |
7.03 |
5.03 |
10.42 |
2.18 |
1.81 |
110.63 |
|
LA1 |
8.56 |
15.85 |
4.56 |
2.29 |
3.87 |
4.40 |
6.55 |
4.98 |
2.08 |
4.18 |
4.38 |
3.03 |
6.65 |
2.92 |
2.54 |
76.85 |
|
LGC-soft |
5.37 |
13.53 |
3.91 |
1.53 |
3.22 |
3.29 |
6.19 |
4.41 |
2.16 |
3.97 |
3.69 |
2.74 |
6.55 |
1.27 |
2.51 |
64.33 |
|
Dharial mutant C237 |
12.92 |
29.40 |
7.29 |
3.64 |
5.91 |
5.32 |
11.81 |
7.91 |
4.45 |
8.44 |
8.10 |
6.18 |
12.06 |
3.69 |
1.87 |
129.00 |
|
Dharial |
4.50 |
11.52 |
3.56 |
1.54 |
2.61 |
2.71 |
6.17 |
3.86 |
1.76 |
3.51 |
3.56 |
2.43 |
5.10 |
0.80 |
0.08 |
53.70 |
|
Average (134 lines) |
6.99 |
14.93 |
4.14 |
1.88 |
3.40 |
3.61 |
6.41 |
4.49 |
2.06 |
4.20 |
4.03 |
2.94 |
6.24 |
2.06 |
1.82 |
69.19 |
|
Max (134 lines) |
12.92 |
29.56 |
7.52 |
3.64 |
5.91 |
6.37 |
11.86 |
7.94 |
4.64 |
8.44 |
8.10 |
6.18 |
12.06 |
3.86 |
8.38 |
130.16 |
|
Min (134 lines) |
4.50 |
10.83 |
3.15 |
1.32 |
0.05 |
2.57 |
4.27 |
3.45 |
0.84 |
2.70 |
2.61 |
1.87 |
4.35 |
0.80 |
0.08 |
48.02 |
Table 5Ratio of essential amino acids to total amino acid content among leading valuable lines used in the analysis.
Table 5
|
Lines |
Total amino acid (mg/g) |
Ratio of essential amino acids to the total amino acids (%) |
Protein (%) |
|
Lysine |
Leucine |
Isoleucine |
Threonine |
Phenylalanine |
Valine |
Histidine |
|
Aromi |
71.20 |
2.7 |
9.0 |
4.5 |
4.9 |
5.9 |
6.4 |
2.4 |
8.9 |
|
Chucheong |
48.02 |
2.3 |
9.1 |
3.9 |
5.3 |
5.4 |
5.9 |
3.0 |
8.2 |
|
Dharial mutant C39 |
64.42 |
2.8 |
8.9 |
4.3 |
5.1 |
5.8 |
6.3 |
2.4 |
12.9 |
|
Dodamssal |
72.61 |
3.6 |
8.7 |
4.1 |
5.5 |
5.7 |
5.9 |
2.7 |
9.2 |
|
Geonyang2 |
75.17 |
2.7 |
10.1 |
4.4 |
4.1 |
5.7 |
6.4 |
2.5 |
8.8 |
|
Dharial mutant C45 |
124.77 |
3.1 |
9.1 |
4.4 |
4.2 |
6.1 |
6.2 |
2.8 |
13.8 |
|
Goami |
73.74 |
3.3 |
9.1 |
4.0 |
5.4 |
5.8 |
5.8 |
2.6 |
8.9 |
|
Goami2 |
82.80 |
4.1 |
8.7 |
4.0 |
5.7 |
5.5 |
5.9 |
2.7 |
9.8 |
|
Goami4 |
79.87 |
3.9 |
8.5 |
4.1 |
5.4 |
5.6 |
5.9 |
2.8 |
9.5 |
|
Haiami |
64.52 |
3.7 |
8.9 |
4.0 |
5.2 |
5.6 |
5.8 |
2.9 |
7.9 |
|
Hanareum2 |
69.76 |
3.4 |
9.1 |
4.1 |
5.7 |
5.8 |
5.9 |
2.7 |
8.4 |
|
Milyang23 |
73.16 |
2.9 |
9.3 |
4.3 |
5.3 |
6.0 |
6.2 |
2.5 |
9.0 |
|
Nampyeong |
64.88 |
3.2 |
9.0 |
3.9 |
5.8 |
5.8 |
5.6 |
2.5 |
8.3 |
|
Nunkeunheukchal |
84.12 |
3.0 |
8.8 |
4.0 |
5.3 |
5.8 |
5.6 |
2.7 |
10.4 |
|
Saeilmi |
56.65 |
2.8 |
9.4 |
4.4 |
5.3 |
6.2 |
6.4 |
2.8 |
7.6 |
|
Dharial mutant C162 |
130.16 |
2.9 |
9.1 |
4.3 |
4.2 |
6.1 |
6.1 |
2.7 |
14.8 |
|
Milyang320 |
78.97 |
3.6 |
9.3 |
4.4 |
4.6 |
5.6 |
6.4 |
3.2 |
9.2 |
|
Basmati389 |
68.94 |
2.1 |
9.4 |
4.8 |
5.4 |
6.0 |
6.6 |
2.4 |
9.2 |
|
IR72 |
67.17 |
1.9 |
9.5 |
4.6 |
5.8 |
6.1 |
6.3 |
2.5 |
8.7 |
|
Koshihikari |
52.72 |
2.1 |
9.4 |
4.5 |
5.5 |
5.9 |
6.4 |
2.7 |
7.6 |
|
Dharial mutant C207 |
110.63 |
2.0 |
9.4 |
4.6 |
4.8 |
6.4 |
6.2 |
2.4 |
14.3 |
|
LA1 |
76.85 |
3.8 |
8.7 |
3.9 |
5.7 |
5.7 |
5.4 |
3.0 |
9.5 |
|
LGC-soft |
64.33 |
2.0 |
10.2 |
4.3 |
5.1 |
5.7 |
6.2 |
2.4 |
8.5 |
|
Dharial mutant C237 |
129.00 |
2.9 |
9.3 |
4.8 |
4.1 |
6.3 |
6.5 |
2.8 |
14.8 |
|
Dharial |
53.70 |
1.5 |
9.5 |
4.5 |
5.1 |
6.6 |
6.5 |
2.9 |
9.3 |
|
Average (134 lines) |
69.19 |
3.0 |
9.0 |
4.2 |
5.2 |
5.8 |
6.1 |
2.7 |
8.7 |
|
Max (134 lines) |
130.16 |
4.1 |
10.2 |
4.9 |
6.4 |
6.6 |
6.7 |
3.2 |
14.8 |
|
Min (134 lines) |
48.02 |
1.5 |
8.5 |
3.2 |
4.1 |
5.4 |
4.6 |
2.3 |
6.7 |
Table 6Correlation coefficient of essential amino acids and protein content.
Table 6
|
Variables |
Lysine |
Leucine |
Isoleucine |
Threonine |
Phenyl-alanine |
Valine |
Histidine |
Total amino acid |
Protein |
|
Lysine |
1 |
|
|
|
|
|
|
|
|
|
Leucine |
−0.624***
|
1 |
|
|
|
|
|
|
|
|
Isoleucine |
−0.439***
|
0.502***
|
1 |
|
|
|
|
|
|
|
Threonine |
0.036 |
−0.144 |
−0.621***
|
1 |
|
|
|
|
|
|
Phenylalanine |
−0.582***
|
0.549***
|
0.622***
|
−0.264*
|
1 |
|
|
|
|
|
Valine |
−0.379***
|
0.471***
|
0.947***
|
−0.666***
|
0.515***
|
1 |
|
|
|
|
Histidine |
0.319**
|
−0.269**
|
−0.234**
|
0.123 |
−0.207*
|
−0.189*
|
1 |
|
|
|
Total |
0.027 |
−0.019 |
0.045 |
−0.307**
|
0.317**
|
−0.079 |
−0.061 |
1 |
|
|
Protein |
−0.130 |
0.047 |
0.067 |
−0.264**
|
0.406***
|
−0.048 |
−0.105 |
0.918***
|
1 |
Table 7Amino acids contents and ratio of lysine among floury lines ‘Milyang320’.
Table 7
|
Amino acids |
Contents |
|
Ratio of lysine to Nampyeong (%) |
|
Nampyeong |
LA 1 |
Geonyang2 |
Milyang320 |
|
LA1 |
Geonyang2 |
Milyang320 |
|
Cysteine |
0.17 |
0.15 |
0.16 |
0.18 |
|
84 |
92 |
94 |
|
Methionine |
0.17 |
0.16 |
0.16 |
0.20 |
|
90 |
91 |
102 |
|
Apartic acid |
0.63 |
0.71 |
0.62 |
0.73 |
|
109 |
94 |
102 |
|
Treonine |
0.27 |
0.30 |
0.27 |
0.31 |
|
106 |
94 |
101 |
|
Serine |
0.37 |
0.39 |
0.40 |
0.42 |
|
99 |
101 |
98 |
|
Glutamic acid |
1.23 |
1.18 |
1.32 |
1.35 |
|
92 |
102 |
96 |
|
Glycine |
0.33 |
0.35 |
0.34 |
0.38 |
|
101 |
98 |
99 |
|
Alanine |
0.40 |
0.43 |
0.46 |
0.49 |
|
103 |
107 |
106 |
|
Valine |
0.38 |
0.40 |
0.41 |
0.44 |
|
100 |
100 |
100 |
|
Isoleucine |
0.26 |
0.29 |
0.28 |
0.31 |
|
105 |
99 |
102 |
|
Leucine |
0.58 |
0.61 |
0.68 |
0.70 |
|
99 |
109 |
105 |
|
Tyrosine |
0.32 |
0.32 |
0.40 |
0.40 |
|
96 |
120 |
109 |
|
Phenylalanine |
0.39 |
0.41 |
0.40 |
0.42 |
|
100 |
95 |
94 |
|
Lysine |
0.27 |
0.36 |
0.26 |
0.34 |
|
130 |
91 |
111 |
|
Histidine |
0.18 |
0.20 |
0.18 |
0.21 |
|
109 |
94 |
104 |
|
Arginine |
0.57 |
0.57 |
0.59 |
0.61 |
|
94 |
97 |
92 |
|
Proline |
0.37 |
0.38 |
0.39 |
0.42 |
|
97 |
98 |
98 |
|
Tryptophan |
0.07 |
0.08 |
0.08 |
0.09 |
|
105 |
102 |
108 |
|
Total |
6.96 |
7.29 |
7.38 |
8.00 |
|
- |
- |
- |
Table 8Amino acids contents of ‘Milyang320’ cultivated in 5 different regions.
Table 8
|
Amino acids |
Amino acids content based on 5 different regions (%) |
|
Miryang |
|
Jeonju |
|
Suweon |
|
Gangwon (Chuncheon) |
|
Gyeonggi (Hwaseong) |
|
Milyang320 |
Nampyeong |
Milyang320 |
Nampyeong |
Milyang320 |
Nampyeong |
Milyang320 |
Nampyeong |
Milyang320 |
Nampyeong |
|
Apartic acid |
0.67 |
0.60 |
|
0.73 |
0.60 |
|
0.70 |
0.61 |
|
0.62 |
0.53 |
|
0.69 |
0.60 |
|
Treonine |
0.28 |
0.25 |
|
0.30 |
0.26 |
|
0.29 |
0.26 |
|
0.26 |
0.23 |
|
0.29 |
0.25 |
|
Serine |
0.38 |
0.36 |
|
0.40 |
0.36 |
|
0.39 |
0.36 |
|
0.35 |
0.30 |
|
0.39 |
0.35 |
|
Glutamic acid |
1.19 |
1.16 |
|
1.21 |
1.15 |
|
1.24 |
1.17 |
|
1.07 |
0.94 |
|
1.22 |
1.11 |
|
Glycine |
0.34 |
0.31 |
|
0.38 |
0.31 |
|
0.36 |
0.31 |
|
0.32 |
0.28 |
|
0.36 |
0.31 |
|
Alanine |
0.43 |
0.38 |
|
0.46 |
0.38 |
|
0.46 |
0.38 |
|
0.40 |
0.33 |
|
0.45 |
0.38 |
|
Valine |
0.38 |
0.36 |
|
0.40 |
0.35 |
|
0.41 |
0.36 |
|
0.35 |
0.31 |
|
0.40 |
0.35 |
|
Isoleucine |
0.25 |
0.24 |
|
0.27 |
0.23 |
|
0.27 |
0.24 |
|
0.23 |
0.20 |
|
0.26 |
0.23 |
|
Leucine |
0.61 |
0.55 |
|
0.62 |
0.54 |
|
0.63 |
0.55 |
|
0.54 |
0.44 |
|
0.61 |
0.53 |
|
Tyrosine |
0.32 |
0.30 |
|
0.31 |
0.28 |
|
0.32 |
0.25 |
|
0.28 |
0.24 |
|
0.32 |
0.29 |
|
Phenylalanine |
0.37 |
0.36 |
|
0.38 |
0.35 |
|
0.38 |
0.36 |
|
0.33 |
0.30 |
|
0.37 |
0.35 |
|
Lysine |
0.32 |
0.27 |
|
0.36 |
0.27 |
|
0.34 |
0.27 |
|
0.30 |
0.25 |
|
0.33 |
0.27 |
|
Histidine |
0.18 |
0.16 |
|
0.20 |
0.16 |
|
0.20 |
0.17 |
|
0.17 |
0.14 |
|
0.20 |
0.16 |
|
Arginine |
0.57 |
0.57 |
|
0.60 |
0.56 |
|
0.60 |
0.55 |
|
0.52 |
0.47 |
|
0.60 |
0.54 |
|
Proline |
0.41 |
0.39 |
|
0.41 |
0.37 |
|
0.41 |
0.38 |
|
0.38 |
0.33 |
|
0.41 |
0.38 |
|
Total |
6.70 |
6.26 |
|
7.03 |
6.16 |
|
6.99 |
6.21 |
|
6.10 |
5.29 |
|
6.90 |
6.11 |
References
- Cohen H, Israeli H, Matityahu I, Amir R. 2014. Seed-specific expression of a feedback-insensitive form of cystathionine-g-synthase in Arabidopsis stimulates metabolic and transcriptomic responses associated with desiccation stress. Plant Physiol.. 166: 1575-1592.
- Galili G. 2002. New insights into the regulation and functional significance of lysine metabolism in plants. Annu. Rev. Plant Biol.. 53: 27-43.
- Jang S, Han JH, Lee YK, Shin NH, Kang YJ, Kim CK, et al. 2020. Mapping and Validation of QTLs for the Amino Acid and Total Protein Content in Brown Rice. Front. Genet.. 11: 240
- Jia M, Wu H, Clay KL, Jung R, Larkins BA, Gibbon BC. 2013. Identification and characterization of lysine-rich proteins and starch biosynthesis genes in the opaque2 mutant by transcriptional and proteomic analysis. BMC Plant Biology. 13: 1-14.
- Kawakatsu T, Hirose S, Yasuda H, Takaiwa F. 2010. Reducing rice seed storage protein accumulation leads to changes in nutrient quality and storage organelle formation. Plant Physiol.. 154: 1842-1854.
- Kim JS, Kim KJ, MA WCJ, Chung HY. 2007. Development of a method to quantify lysine in small amount of rice grain. Journal of environmental and Sanitary engineering. 22(2): 75-84.
- Krishnan HB. 1999. Characterization of high-lysine mutant of rice. Crop Sci.. 39: 825-831.
- Kumamaru T, Sato H, Satoh H. 1997. High-lysine mutants of rice, Oryza sativa L. Plant Breed.. 116: 245-249.
- Lee TT, Wang MM, Hou RC, Chen LJ, Su RC, Wang CS, et al. 2003. Enhanced methionine and cysteine levels in transgenic rice seeds by the accumulation of sesame 2S albumin. Biosci. Biotechnol. Biochem.. 67: 1699-1705.
- Long XH, Liu QQ, Chan ML, Wang Q, Sun SSM. 2013. Metabolic engineering and profiling of rice with increased lysine. Plant Biotechnology J.. 11: 490-501.
- Mertz ET, Bates LS, Nelson OE. 1964. Mutant gene that changes protein composition and increases lysine content of maize endosperm. Science. 145(3629): 279-280.
- Mosse J, Huet JC, Baudet J. 1988. The Amino Acid Com-position of Rice Grain as a Function of Nitrogen Content as Compared with Other Cereals: A Reappraisal of Rice Chemical Scores. Journal of Cereal Science. 8: 165-175.
- Sekhar BPS, Reddy GM. 1982. Amino Acid Profiles in Some Scented Rice Varieties. Theor. Appl. Genet.. 62: 35-37.
- Ufaz S, Galili G. 2008. Improving the content of essential amino acids in crop plants: goals and opportunities. Plant Physiol.. 147: 954-961.
- Wang L, Zhong M, Li X, Yuan D, Xu Y, Liu H, et al. 2008. The QTL controlling amino acid content in grains of rice (Oryza sativa) are co-localized with the regions involved in the amino acid metabolism pathway. Mol. Breeding. 21: 127-137.
- Wong HW, Q. Liu Q, Sun SSM. 2015. Biofortification of rice with lysine using endogenous histones. Plant Mol. Biol.. 87: 235-248.
- Wu JG, Shi C, Zhang X. 2002. Estimating the amino acid composition in milled rice by near-infrared reflectance spectroscopy. Field Crops Res.. 75: 1-7.
- Yang QQ, Zhang CQ, Chan ML, Zhao DS, Chen JZ, Wang Q, et al. 2016. Biofortification of rice with the essential amino acid lysine: molecular characterization, nutritional evaluation, and field performance. J. Exp. Bot.. 67(14): 4285-4296.
- Yang QQi, Suen PK, Zhang CQ, Mak WS, Gu MH, Liu QQ, et al. 2017. Improved growth performance, food efficiency, and lysine availability in growing rats fed with lysine-biofortified rice. Scientific Reports. 7: 1-11.
- Yi GH, Choi JH, Kim KM, Jeong EG, Park HM, Kim DH, et al. 2005. Generation and DNA characterization of high-lysine mutants by biochemical selection from callus culture of 'Hwayeongbyeo'. Plant resources. 8(1): 60-66.
- Yoo SC. 2017. Quantitative trait loci controlling the amino acid content in rice (Oryza sativa L.). J. Plant Biotechnol.. 44: 349-355.
- Yu J, Peng P, Zhang X, Zhao Q, Zhu D, Sun X, et al. 2005. Seed-specific expression of the lysine-rich protein gene sb401 significantly increases both lysine and total protein content in maize seeds. The United Nations University. Food and Nutrition Bulletin, vol. 26, no. 4 (supplement).
- Zhao W, Park EJ, Chung JW, Park YJ, Chung IM, Ahn JK, et al. 2009. Association Analysis of the Amino Acid Contents in Rice. J. Integ. Plant Biol.. 51(12): 1126-1137.
- Zhao Y, Xi M, Zhang X, Lin Z, Ding C, Tang S, et al. 2015. Nitrogen effect on amino acid composition in leaf and grain of japonica rice during grain filling stage. J. Cereal Sci.. 64: 29-33.
- Zhu X, Galili G. 2003. Increased lysine synthesis coupled with a knockout of its catabolism synergistically boosts lysine content and also transregulates the metabolism of other amino acids in Arabidopsis seeds. The Plant Cell. 15: 845-853.