Abstract
Salinity is the most significant constraint to wheat cultivation in the salinity-affected areas. Saline-prone soils can be brought under cultivation by the development of salt-tolerant lines through molecular breeding aided by diversity analysis and molecular screening. The study aimed to screen for salinity tolerance and elucidate the extent of diversity among 75 wheat varieties and accessions. This molecular analysis and detection used 21 linked SSR markers. The study identified 202 alleles in 75 genotypes of wheat, giving 9.6 alleles on an average for salt tolerance screening. The mean polymorphism information content (PIC) of 0.7599 and the Nei’s (1973) gene diversity of 0.7856 were recorded. The accessions possess higher gene diversity and PIC than the cultivars. The average genetic similarity matrix coefficient was 0.60 within the range of 0.19 and 1.00. Similarity indices based UPGMA cluster analysis separated the 75 germplasm into six clusters. Eight genotypes grouped in sub-cluster Ib together with the positive control BINA Gom-1. Therefore, these eight genotypes were identified as potential salt-tolerant by molecular analysis using SSR markers linked to salinity. The gene diversity estimated, and the germplasm identified as potential salt-tolerant are promising for use in wheat breeding to incorporate salt tolerance in novel cultivars by marker-assisted breeding.
-
Key words: Gene diversity, Salt tolerant, SSR marker, Triticum aestivum, Wheat genotypes
INTRODUCTION
Wheat (
Triticum aestivum L.), an economically important cereal, is grown widely throughout the globe (
Tadesse et al. 2019). It has widely been used as an energy source and nutrition for the human. The hexaploid wheat comprises 95% of the wheat grown in the world and is in breads and various bakery items. The rest is tetraploid wheat and is suitable for the production of macaroni and pasta (
Bushuk 1997). Wheat production is limited by two main factors; the unavailability of water and soil salinity. Among them, salinity plays a major role by restricting plant growth leading to a lower production, in both the arid and the semi-arid areas (
Bai and Dong 2001).
Chandan et al. (2006) opined that the distribution and productivity of major crops are limited by high soil salinity. Wheat yield is also limited by high soil salinity. Wheat productivity and yield would, therefore, be increased by breeding salt-tolerant high-yielding varieties. Wheat production in the world must be increased at least 50% by the year 2050 for satisfying the demand of the growing population (
Tadesse et al. 2019).
Wheat is one of the crops domesticated some 10000 years ago. Wheat is known to comprise of three subgenomes (each of which has 7 chromosomes) organized in seven homoeologous groups, each of the homoeologous groups has three closely related chromosomes, one from each of the three respective subgenomes (
Gupta 2008). The diploid progenitors of the A, B, and D subgenomes were identified earlier (
Gill et al. 2004). Marcussen (2014) reported that A, B and D corresponded to separate sub-genomes derived from three ancestral diploid species with similar but distinct genome structure and gene content that diverged between 2.5 and 6 million years ago. The bread wheat genome size is very large (16 Gb). The high sequence similarity and abundance of repetitive elements in the wheat genome worked as a barrier in early genome-assembly efforts (
IWGSC 2014). Although genome assemblies recently became available, they do not fully reflect genomic variation within the species that could be used for crop improvement (
Walkowiak 2020).
Salinization alone can render approximately 20 million hectares of land to unsuitable for crop production every year (
Malcolm 1993). Irrigated land has encountered a progressive salinization at a rate of around 20% (
Ghassemi and Nix 1995). Later, it was reported that above 800 million ha of land worldwide is affected by salinity alone (
Munns 2005). In Bangladesh, around 30% of lands under cultivation are situated in the coastal belt where about 53% is affected by salinity (
Haque 2006). Salinity creates a serious limitation in growth, development and yield, decreases crop productivity, and impairs economic utilization of land and water resources all over the world (
Arzani 2008); con-sequently, it caused major hindrance to world food security (
Ashraf 2004). Similarly, wheat yield also declined drastically due to soil salinity (
Munns et al. 2006).
Wheat has been considered as a moderately saline tolerant crop. Nonetheless, wheat cultivation in the saline-prone areas of Bangladesh has not yet been profitable due to the lack of suitable salt-tolerant varieties for these areas. Cultivation of salt-tolerant genotypes on saline-affected soils is a reflection of the change to a new strategy of ‘tailoring the plants to fit the soil’ from the previous approach of ‘tailoring the soil to fit the plant.’ The salinity tolerant cultivars are considered to be the substitute for recovery on moderately saline soils with the supplement to amendments in highly saline ones. Moreover, the develop-ment of salt-tolerant variety is the preferred way to overcome the problems associated with salinity and may provide crucial insights into the sensitive varieties when they are exposed to salinity stress. The salt-tolerant variety development is a challenge for wheat breeders worldwide. Finding the salt-tolerant germplasm, however, is relatively difficult because of the complexity of salinity tolerance.
The development of saline tolerant cultivars would be an effective way to overcome the yield loss of wheat due to salinity by bringing the saline-prone areas under wheat cultivation profitably. Sources of saline tolerance in Bangladeshi wheat cultivars are rarely known. Only two cultivars have been claimed to be moderately tolerant to salinity. However, their field performance is still question-able and needs extensive research. Therefore, breeding programs to improve the productivity of wheat under stress conditions is time demanding. Screening of the salt tolerance using a large number of genetic resources referring to the total of genes, gene combinations, or geno-types available for the genetic improvement of crops (
Gepts 2006) would help to identify suitable genotypes for cultivation in saline areas or using them in the breeding program as parents. The selection of cultivars or lines solely based on morphological traits is not enough. The variation among genotypes can now be assessed by various techniques. The use of molecular markers has emerged recently as an efficient tool for assessing genetic variability. Unlike morphological markers, DNA markers are not influenced by the environment, plant developmental stages, or plant tissues, and can provide reliable results (
Al-Faifi et al. 2016).
Although characterization of morphological characters of plants evaluating their field performance is simple and straightforward, the use of particular character linked to polymorphic markers designed from within the genes has been found more efficient due to their direct ability to identify the desired characters (
Poczai et al. 2013). PCR-based simple sequence repeats (SSRs) have been considered preferable markers because of their locus identity, higher value of PIC, and multiple allelism and have been used in screening for various traits in many crops. Since no detailed investigations have yet been conducted regarding the genetic diversity of wheat concerning salt stress in Bangladesh, a study has been performed to evaluate the diversity among 75 wheat varieties and lines using salt tolerance linked SSR markers. The goal of the study is to estimate the genetic variability among the varieties and accessions to select genotypes with a higher level of tolerance to salinity.
MATERIALS AND METHODS
Plant materials
Seeds of 75 genotypes (28 cultivars and 47 breeding lines) were received from the Regional Agricultural Research Station, Jamalpur, Bangladesh (
Table 1). All the wheat plant materials were grown in plastic pots and kept in a plant growth cabinet run at 18℃. The potting soil was sandy loam, fertile and acidic (pH ranges from 5.5 to 6.8). After two weeks, two or three young vigorously growing leaves were cut into pieces and packed in labeled plastic bags to store at −80℃ for DNA extraction in due time.
The leaves stored at −80℃ were used for the DNA extraction by the Cetyl Trimethyl Ammonium Bromide (CTAB) method (
Khan et al. 2004). Then the DNA concentration was estimated with a nanodrop spectro-photometer (NanoDrop One, Thermo Fisher Scientific, U.S.A.) following
Stulnig and Amberger (1994) and
Youssef (2012).
Preliminarily, 31 wheat SSR primer sets linked to salinity tolerance were selected from available reports (
Shahzad et al. 2012;
Vaja et al. 2016). Among the 31 primers, 21 (
Table 2) were selected based on their precise amplification and were used for salt tolerance screening of the studied wheat genotypes. Primer sequences and PCR conditions were obtained from Grain Genes Database for Triticeae and Avena (
http://wheat.pw.usda.gov). PCR amplifications were performed in a Biometra TOne Thermal Cycler (Biometra GmbH, Germany). Each PCR amplification was performed in a 20 mL reaction volume containing 1 µL DNA, 10 µL Master mix (Go-taq green master mix), 1 µL (10 pM) of each of a primer pair and 7 µL nuclease-free H
2O. The DNA samples in the reaction mixture were incubated in the Thermal Cycler at 94℃ for 5 minutes, then 35 cycles comprising 94℃ for 1 minutes, annealing of primer at 58-60℃ for 1 minute and then extension for 2 minutes at 72℃ for amplification. The incubation was terminated with a final extension for 7 minutes at 72℃.
PCR amplified DNA samples were separated on polyacrylamide gels in a 1×TBE buffer. The size of each amplified DNA fragment was estimated using 50 and 100 bp Ladders (PROMEGA, Madison WI., USA). Polymorphisms for each marker were detected separately and observed under a UV trans-illuminator (BioDoc-ItⓇ Imaging System).
Analysis of SSR data
Molecular weights for SSR products were determined using the software AlphaEaseFC 4. The number of alleles, genetic diversity, major allele frequency, and polymorphism information content (PIC) values were estimated by the POWER MARKER version 3.23 (
Liu and Muse 2005). The data on allele frequency were exported in the binary format to analyze with the NTSYS-PC version 2.1 (
Rohlf 2000). Genetic similarity was calculated as DICE coefficient
Nei’s 1973 by 0/1 matrix using the subprogram SIMQUAL, and a dendrogram was then constructed from the resultant similarity matrices using Sequential Agglomerative Hierarchical Nesting (SAHN) based Unweighted Pair Group Method of Arithmetic Means (UPGMA) (
Rohlf 2000). For the estimation of the similarity matrix, null alleles were considered as missing data as a measure of reducing the biased genetic or similarity measures (
Warburton and Crossa 2002).
RESULTS
Characterization by SSR markers
The 75 wheat varieties and accessions were evaluated in this study using 21 SSR markers linked to salinity that were selected based on the known genetic locations so that they can provide the uniform coverages for the chromosomes in the genomes A, B and D that are known to influence salt efficiency (
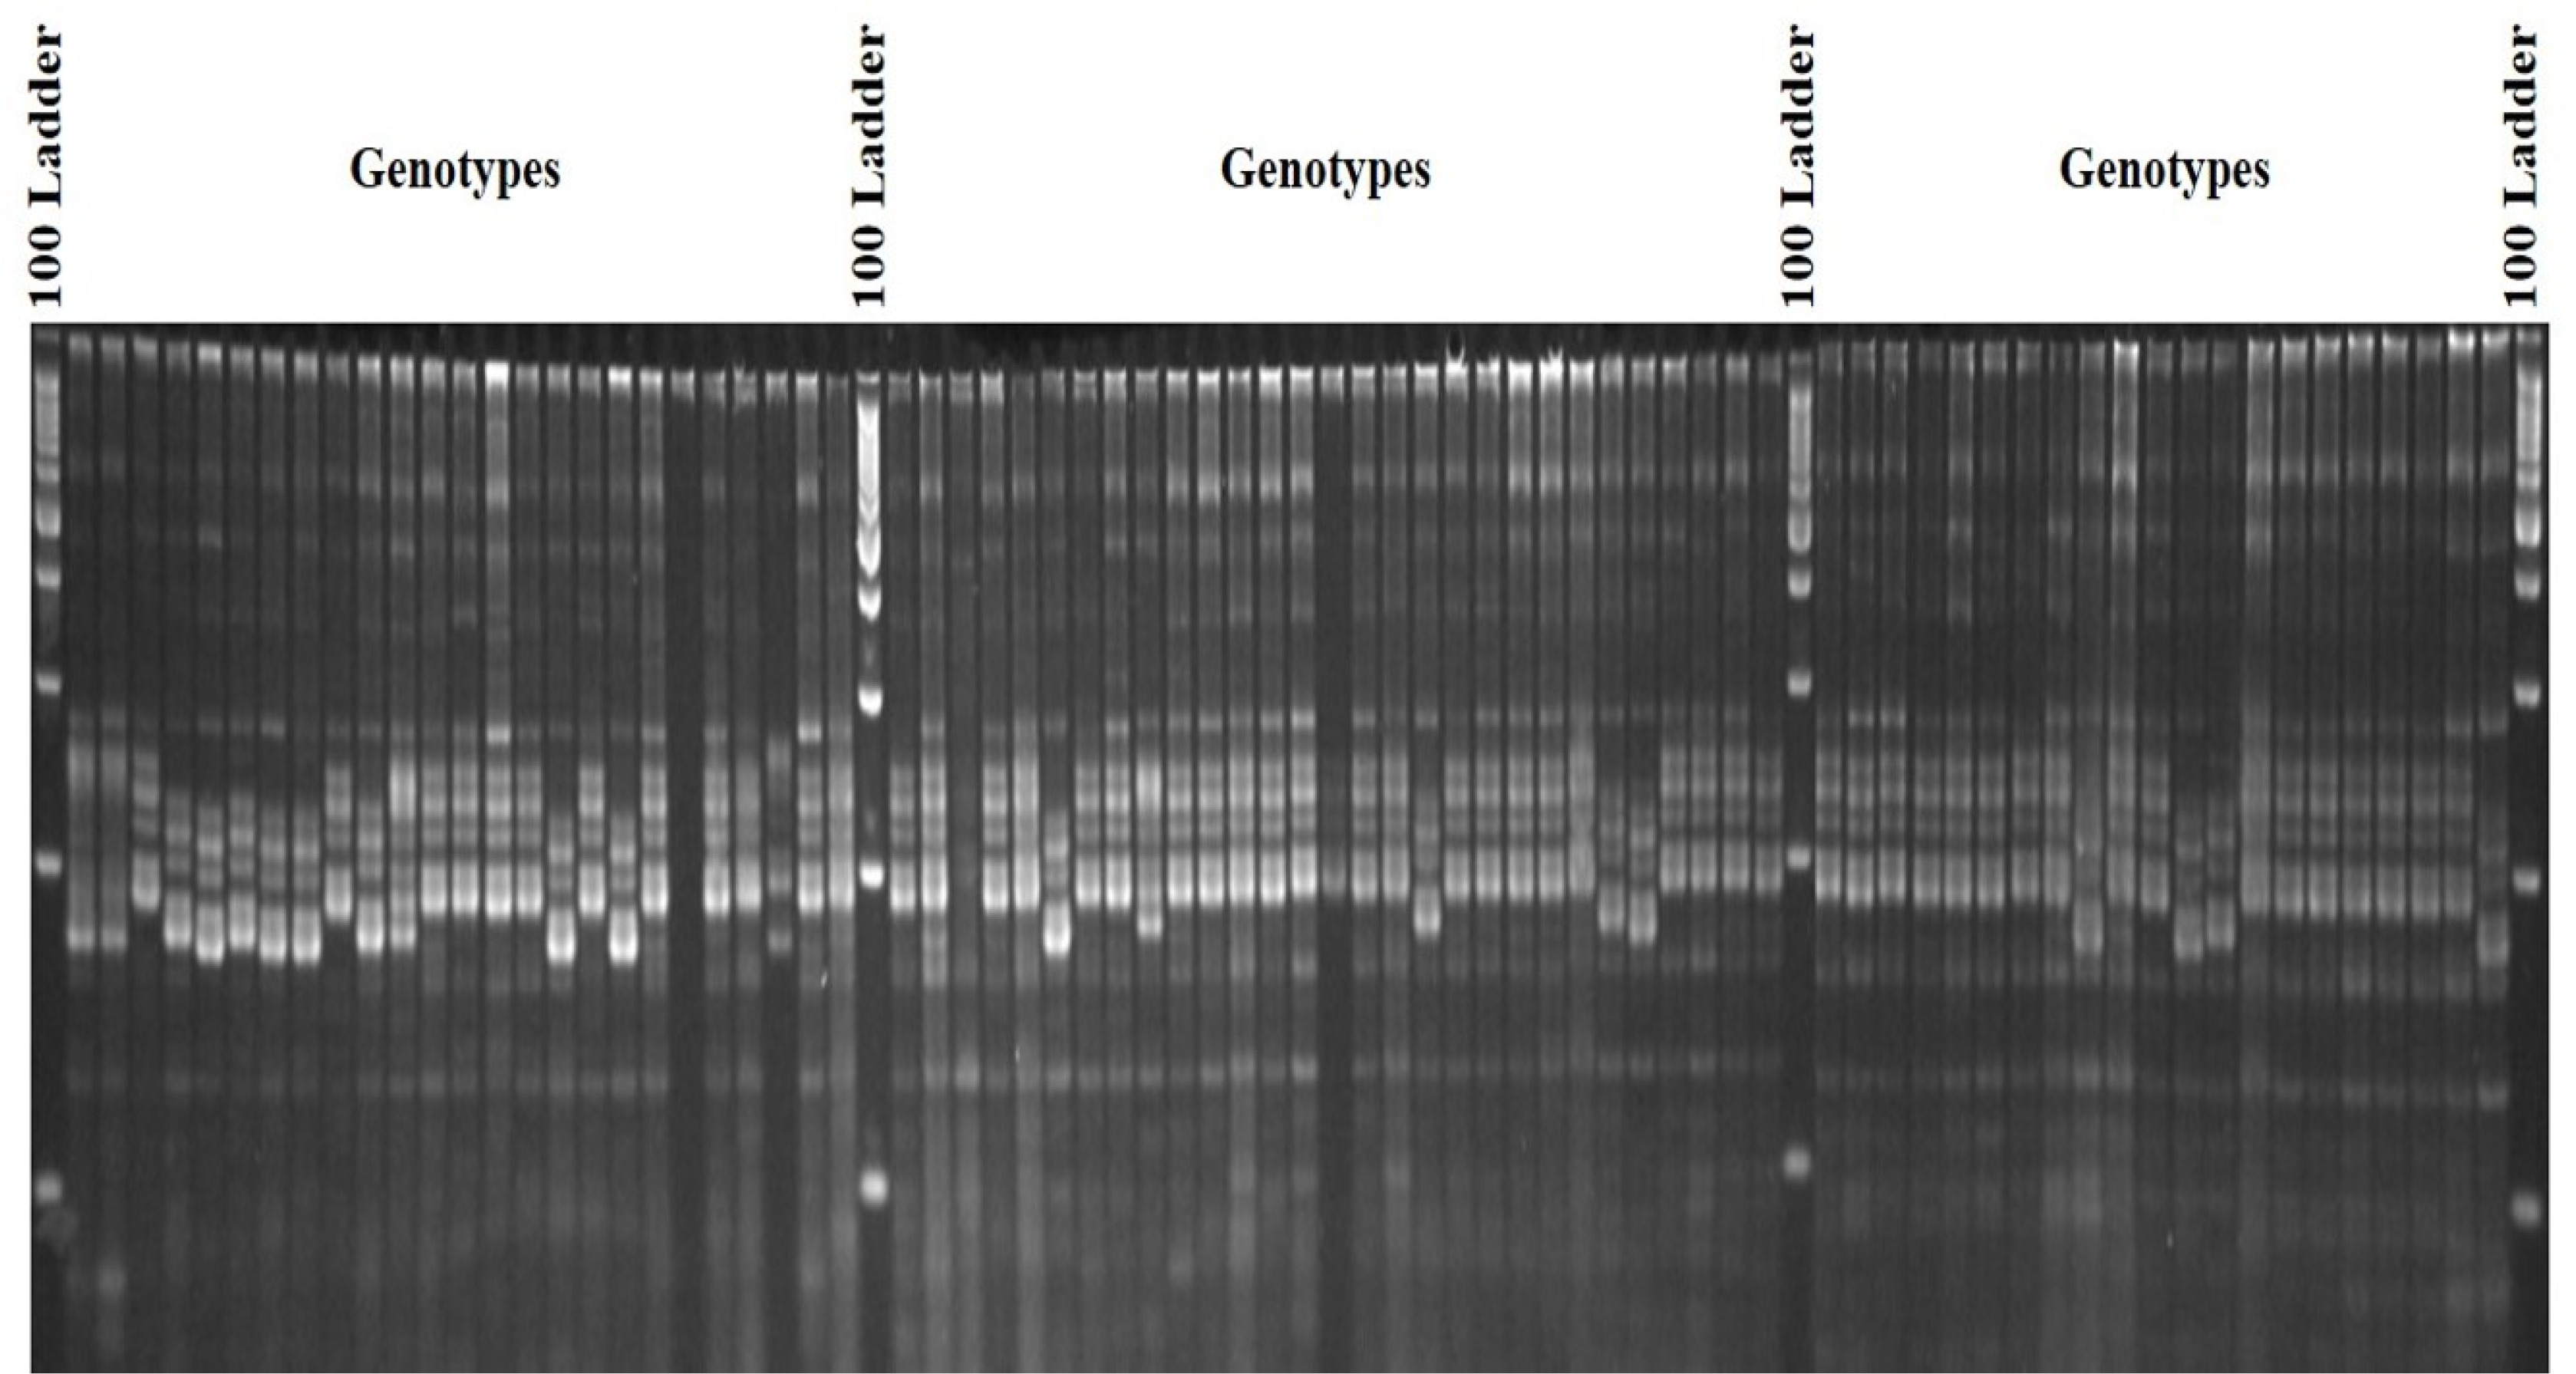
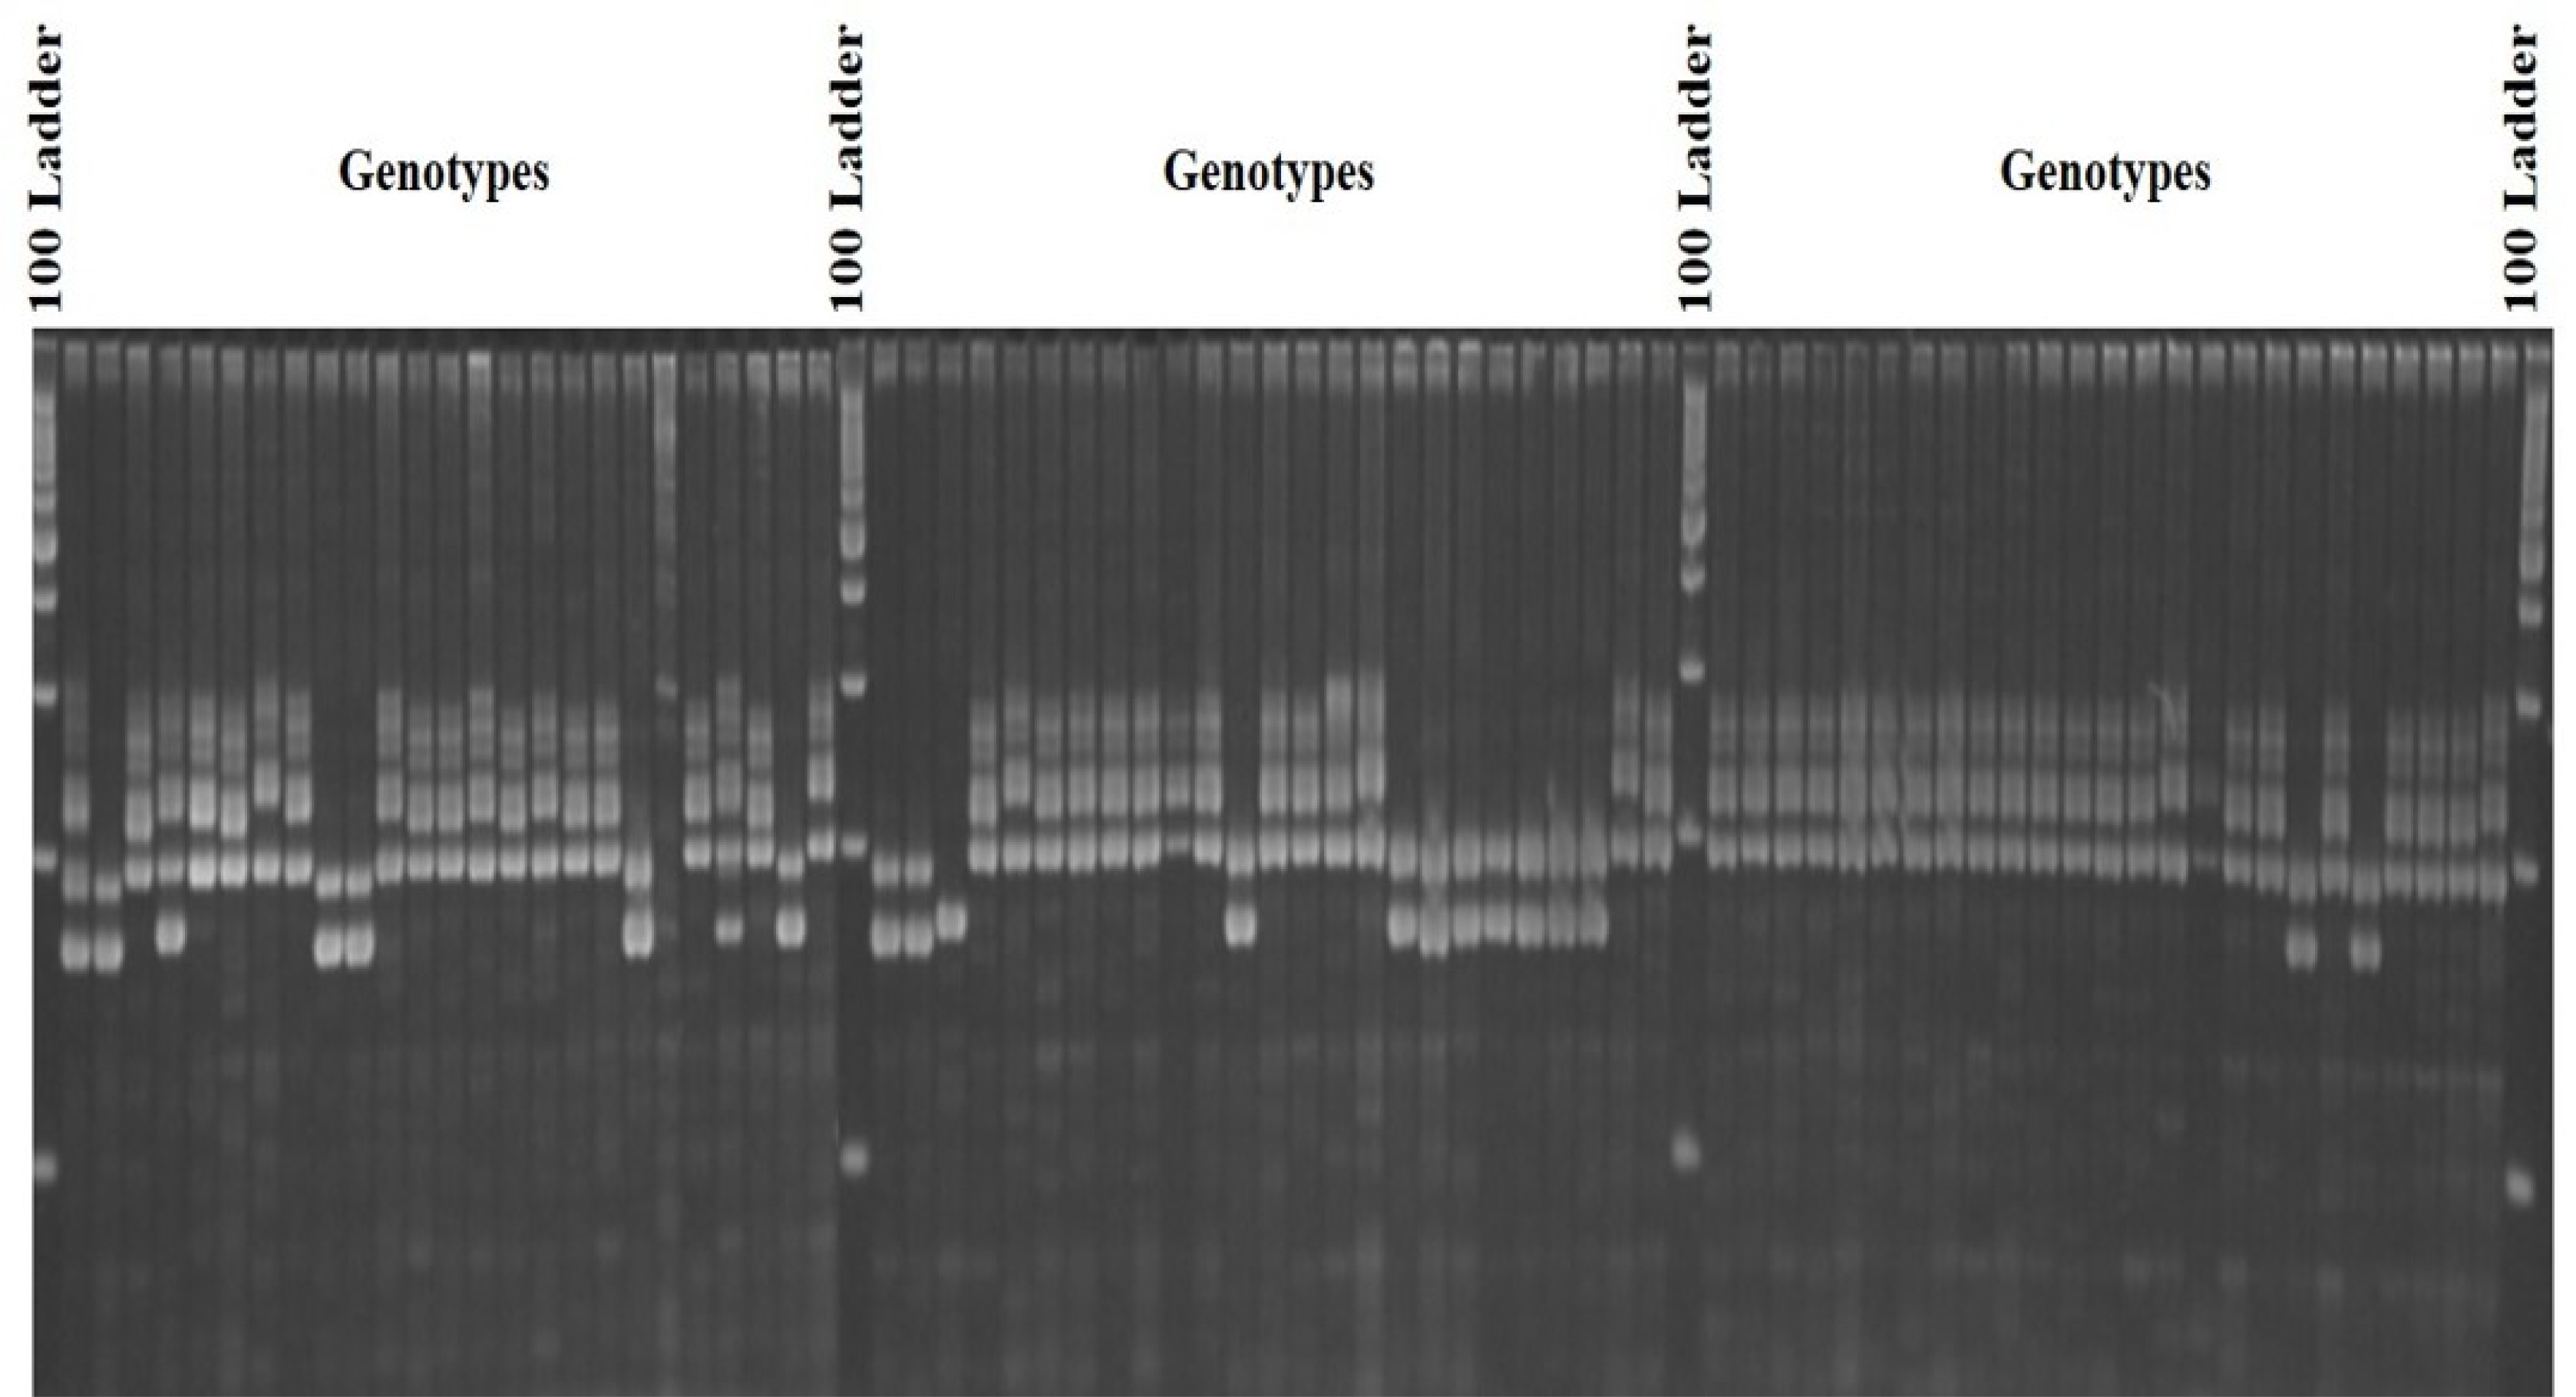
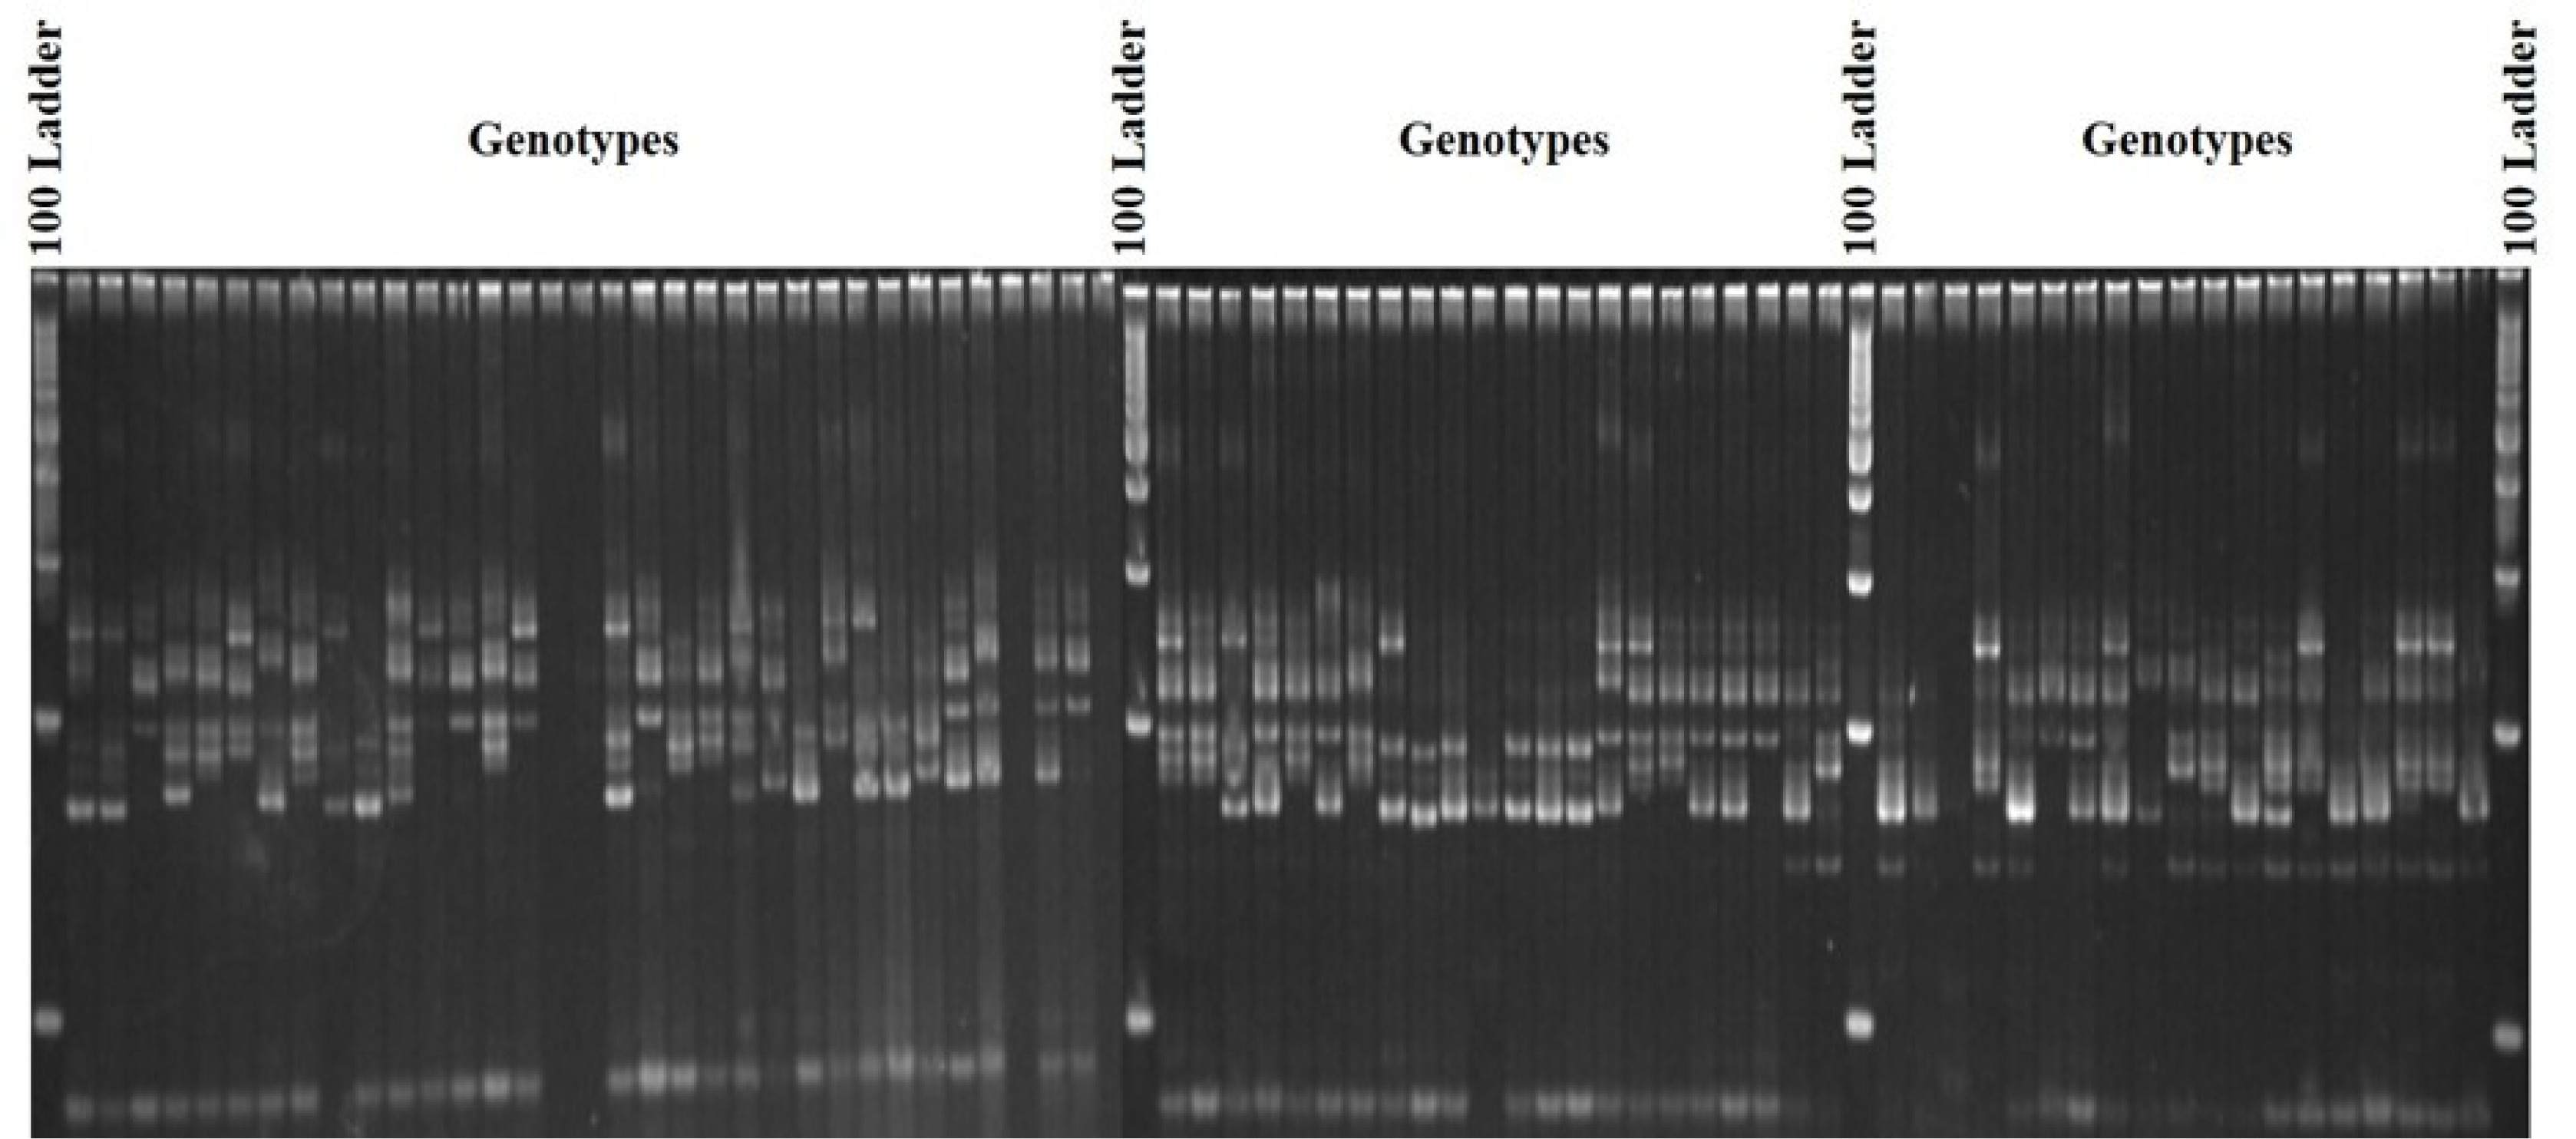
Table 2). It was possible to detect 202 alleles at 21 loci (
Fig. 1-
5,
Supplementary Fig. S1-S16). The most minimum three alleles were detected for marker Xcfd-1, and the maximum 13 alleles were detected for marker Xcfd-54 and Xgwm-493, with an average of 9.6 (
Table 3). It was found that the observed allele sizes were within the expected allele size ranges in most of the primers. Of the 21 SSR loci used, the loci that showed the highest number of null alleles resulted from three loci Xwmc-11, Xgwm-160 and Xgwm-493 (nulls detected in five genotypes). The lowest frequency of null allele was detected by five loci Xcfd-4, Xcfd-13, Xcfd-18, Xwmc-110 and Xwmc-432 (nulls detected in one genotype) with an average 1.47 (
Table 3). PCR amplifications of the genotype-marker combinations exhibiting null alleles were repeated to eliminate the probability that a failed PCR reaction due to experimental errors could be the cause of the null alleles. The major allele or the most common allele at each locus is the allele that is observed at the highest frequency. The major allele in this study ranged from 0.2133 in Xcfd-18 to 0.6933 in Xcfd-13 (
Table 3), giving an average frequency of 0.3340. There were size variations of the major alleles at various loci and the size ranged from 147 bp to 268 bp for Xwmc-154 Xcfd-18, respectively (
Table 3).
The expected heterozygosity, in other words, gene diversity is known as the probability of two randomly chosen alleles from the studied population to be different. The gene diversity as was estimated according to
Nei’s (1973) is presented in
Table 3. The loci Xgwm-493 showed the highest degree of gene diversity (0.8691), while Xcfd-13 had the lowest gene diversity (0.4981) giving the mean gene diversity of 0.7856. It is worth mentioning that markers with a higher number of detectable alleles had higher gene diversity compared to those showing a lower number of alleles revealing lower gene diversity. It is important to note that on average, the accessions had higher gene diversity (0.7228) than the cultivars (0.7167) and the combined population had higher gene diversity (0.7856) than both the sub-populations; cultivars and accessions (
Table 3).
Polymorphism information content (PIC) can measure the nature of the information of microsatellites. The PIC value for each locus was calculated to evaluate the extent of polymorphism among the 75 wheat genotypes. The Xgwm-493 had a higher PIC value of 0.8482 than the PIC value of Xcfd-13 (0.4776). The average value of PIC was 0.7599 (
Table 3). As noted in gene diversity, the accessions had higher PIC (0.6842) than the cultivars (0.6797). Compared to both the sub-populations; cultivars and accessions, the combined population had an average higher (0.7599) PIC (
Table 3).
The coefficients of the genetic similarity matrix for 2775 possible genotype pairs had a range between 0.19 and 1.00 with an average of 0.60 (
Supplementary Table S1-S3). A dendrogram was constructed by cluster analysis. This study estimated a significant degree of diversity among the 75 cultivars and accessions under the study (
Fig. 6). As revealed from the dendrogram, the genotypes were segregated into six major clusters at 0.24 cut-off similarity coefficient. The Cluster I, II, III, IV, V, and VI consisted of 19, 13, 12, 13, 17, and 1 genotype, respectively. Cluster I is composed of the highest number of 19 genotypes (25%), most of which were BARI released varieties. Cluster I is again fairly divided into two sub-clusters; of which, the sub-cluster Ia contained 10 genotypes, (Agroni, Akbar, BARI Gom-20, BARI Gom-19, BARI Gom-21, BARI Gom-23, BARI Gom-22 BARI Gom-25, BARI Gom-24, and BARI Gom-26) all of which are cultivars. In contrast, sub-cluster Ib comprised with 9 genotypes (BARI Gom-27, BARI Gom-28, BARI Gom-29, BINA Gom-1, BARI Gom-30, Borkot, BARI Gom-31, BARI Gom-33, BARI Gom-32) that are also cultivated varieties. Cluster II was constructed by two sub-clusters. Of the two, the sub-cluster IIa comprised of five accessions: 9035, 9036, 9037, 9040, and 9042. Whereas, the other sub-cluster IIb contained eight accessions 9043, 9044, 9045, 9048, 9055, 9056, 9057, and 9060. Cluster III consisted of two sub-clusters. The sub-cluster IIIa contained Sonalika, Sonora-64, accessions 2030, 3015, 6049, and Triticale that belong to both cultivars and accessions. While, the sub-cluster IIIb contained six accessions: 5006, 7023, 7041, 8010, 8011 and 8023. Similarly, Cluster IV was consisted with two sub-clusters containing accessions alone; the sub-cluster IVa included accessions 8036, 8044, 8056, 8049 and 8059, and another sub-cluster IVb consisted of eight accessions 9002, 9003, 9004, 9005, 9006, 9007, 9009 and 9010. Cluster V was composed of two sub-clusters. The sub-cluster Va was constituted with accessions 9011, 9013, 9017, 9014, 9018, 9019, 9020, 9024, 9022, 9025, 9026, and 9033, whereas sub-cluster Vb contained Kalyansona, Kanchan, Pavon-76, Protiva, Kheri, Pavon-76, and Protiva. All are cultivars. On the other hand, Cluster VI had a solitary genotype, Durum. This unique genotype Durum is tetraploid and diverse concerning all other hexaploid genotypes.
DISCUSSION
This study found a high genotypic variation among the wheat genotypes at the DNA level using microsatellite markers. The genotypes of the present study included 28 varieties and 47 accessions. The average allelic richness revealed that the accessions possessed higher levels of polymorphism than the cultivars. It supports that like elsewhere in the world, modern plant breeding might have caused genetic erosion to some extent in commercial wheat cultivars in Bangladesh also. Genetic erosion may occur initially during the replacement of landraces by modern cultivars; and further trends in diversity as a consequence of modern breeding practices (
Fu 2015).
Rauf et al. (2010) showed that the occurrence of the losses of genetic diversity follow spatial and sometimes temporal trends. Released cultivars suffer higher genetic diversity losses, followed by wild germplasm and landraces, respectively. A similar result was evident in this research. They added interesting information that the introduction of the plant increased genetic diversity; selection afterward enhanced genetic differentiation at the expense of genetic diversity, while the subsequent intraspecific hybridization lowered genetic diversity.
SSR analysis indicated that the allele frequency ranged between 3 and 13 and had an average of 9.6 alleles per locus.
Abbasov et al. (2018) found 111 alleles and 10 alleles per locus which was similar to the findings of this study. The highest number of alleles (13) was amplified by the markers Xcfd-54 and Xgwm-493. On the contrary, the lowest number of alleles (3) was produced by Xcfd-1. Several factors, including the structure of the primers and the frequency of annealing sites, might be responsible for creating variations in the number of alleles detected by different primers (
Kernodle et al. 1993). Polymorphic bands that reveal differences among genotypes would be useful in examining and establishing systematic relation-ships among genotypes (
Hadrys et al. 1992).
The highest frequencies of null alleles were resulted by three loci and the lowest numbers of null alleles were detected by five loci with an average 1.47, in this study. Null alleles are the alleles that fail to amplify during PCR, probably due to the polymorphisms at the hybridization sites of any or both of the primers (
Dakin and Avis 2004). Null alleles can arise due to a point mutation(s) in one or both primers binding sites and thereby inhibiting primer annealing. The high frequency of null alleles detected here is consistent with many previous reports.
In this study, D genome-based SSR markers were found to produce a higher number of alleles than A and B genomes, respectively. Therefore, the D genome appeared as the richest genome in identifying polymorphisms. In addition, the modern cultivars produced a lesser number of alleles than the accessions, which in hexaploid wheat is largely controlled by the D genome (
Gorham et al. 1987;
Dvořák and Gorham 1992). Eleven markers were found as rare alleles because they were amplified in less than 5% genotypes only. Among them, ten rare allele-producing markers are located on the D genome. According to
Gorham et al. (1987) the D genome controls salinity tolerance. So, these rare alleles contain potential genetic materials that control the tolerance capacity of hexaploid wheat.
Genetic diversity among the existing genotypes is considered as raw material in breeding to spur genetic improvement, both in increasing the yield potential and decreasing reliance on production inputs e.g., fertilizers, water, and pesticides; and assures potential progress in plant breeding and protection against threats of biotic or abiotic stresses to agricultural production (
Gepts 2006). The genetic diversity was estimated by measuring the polymorphic information content (PIC).
Vaiman et al. (1994) classified loci polymorphism into three categories: high, medium or low if PIC > 0.5, 0.5 > PIC > 0.25, and PIC < 0.25, respectively. While in the current study, the values of PIC ranged from 0.4776 in Xcfd-13 to 0.8482 in Xgwm-493, with an average value of 0.7599 per marker. We recorded significantly higher PIC values in this study than those reported from other studies by
Bányai et al. (2006). However,
Uddin and Boerner (2008) reported similar PIC values. The markers we used showed above average PIC values which give an indication that SSR markers used in this study were highly informative. Previous reports suggested that PIC values higher than 0.50 indicate high polymorphism. A positive correlation of PIC values with the number of alleles as well as allele size range for microsatellites was found in this study. Similar correlation was also reported by Guzmán
et al. (2019). This study also revealed a high correlation between the number of alleles and allele size range. The PIC can be considered as a measure of the usefulness of the markers in distinguishing them from one another. The SSRs represent the most attractive marker system in wheat (
Hammer et al. 2000) and have a successful use in characterizing the genetic diversity in advanced wheat breeding materials (
Dreisigacker et al. 2004), and wheat variety improvement and management program (
Leonova et al. 2011;
Jaiswal et al. 2017;
Haque et al. 2020).
In general, the genotypes with salt-tolerance tend to cluster together which might be an indication of the efficiency of SSR markers to distinguish between sensitive and tolerant genotypes regarding their similarity matrices. The coefficient of similarity matrix ranged between 0.19 and 1.00, giving an average of 0.60 which indicates the presence of a substantial amount of genetic variation among the genotypes used in this study. The dendrogram (UPGMA) constructed based on
Nei’s 1973 genetic distance, separated 75 wheat genotypes distinctly. As all the markers in the present study were related to salt tolerance, genetic similarity-based clustering might be indicative of the genetic potentiality for salt tolerance. The marker-assisted study revealed the distribution of 75 genotypes into 6 clusters. Eight modern varieties (BARI Gom-28, BARI Gom-27, BARI Gom-29, BARI Gom-31, BARI Gom-30, BARI Gom-33, Borkat, BARI Gom-32) were located along with control variety BINA Gom-1 in the same sub-cluster 1b. Some of the cultivars of this group were found either tolerant or moderately tolerant to salinity by morphological, molecular and hydroponic study. In a previous study combined with molecular and morphological evaluation, we reported BARI Gom-28 as a salinity tolerant variety (
Haque et al. 2020). On the other hand, BINA Gom-1 has been released as Salinity tolerant up to 12 dSm
−1. In a recent research on the performance of wheat germplasm under salinized condition (EC 15 dSm
−1) grown in hydroponics system at the seedling stage, we observed BARI Gom-28 to be tolerant while BINA Gom-1, BARI Gom-29, BARI Gom-30 and BARI Gom-32 to be moderately tolerant by SES scoring (unpublished data). Therefore, these genotypes are potential candidates for salt-tolerant based on molecular studies by SSR markers linked to salinity tolerance. However, further phenotypic and genotypic studies are necessary before confirmation.
CONCLUSION
We detected considerable genetic variation among the cultivars and accessions. The accessions had higher genetic diversity compared to the cultivars. We also identified eight genotypes (BARI Gom-27, BARI Gom-29, BARI Gom-28, BARI Gom-30, BARI Gom-32, BARI Gom-31, BARI Gom-33, Borkat) as salt-tolerant according to the UPGMA cluster analysis. The genotypes preliminarily identified as salt-tolerant in this study will be further screened at the seedling stage in the hydroponic system as well as at the reproductive stage in the field for validation in our next experiments. These genotypes will be valuable genetic resources for incorporating salt tolerance traits in future wheat cultivars for Bangladesh.
SUPPLEMENTARY MATERIALS
ACKNOWLEDGEMENTS
The authors acknowledge the research grant from the Ministry of Education, Government of the People’s Republic of Bangladesh. This work was also partially supported under the framework of the international cooperation program of the National Research Foundation of Korea (2018K2A9A1A01090458).
-
FUNDING
This research was funded by the “Ministry of Education, Government of the People’s Republic of Bangladesh, grant number 2018/687/MOE” and “National Research Foundation of Korea grant number 2018K2A9A1A01090458”.
-
CONFLICT OF INTEREST
The author declares of no commercial or financial conflicts of interest with any person or organization.
Fig. 1Banding pattern of alleles at locus Xcfd-18 in 75 wheat genotypes (Genotypes sequence in figure according to the sequence in
Table 1).

Fig. 2Banding pattern of alleles at locus Xcfd-49 in 75 wheat genotypes (Genotypes sequence in figure according to the sequence in
Table 1).

Fig. 3Banding pattern of alleles at locus Xwmc-17 in 75 wheat genotypes (Genotypes sequence in figure according to the sequence in
Table 1).

Fig. 4Banding pattern of alleles at locus Xwmc-24 in 75 wheat genotypes (Genotypes sequence in figure according to the sequence in
Table 1).
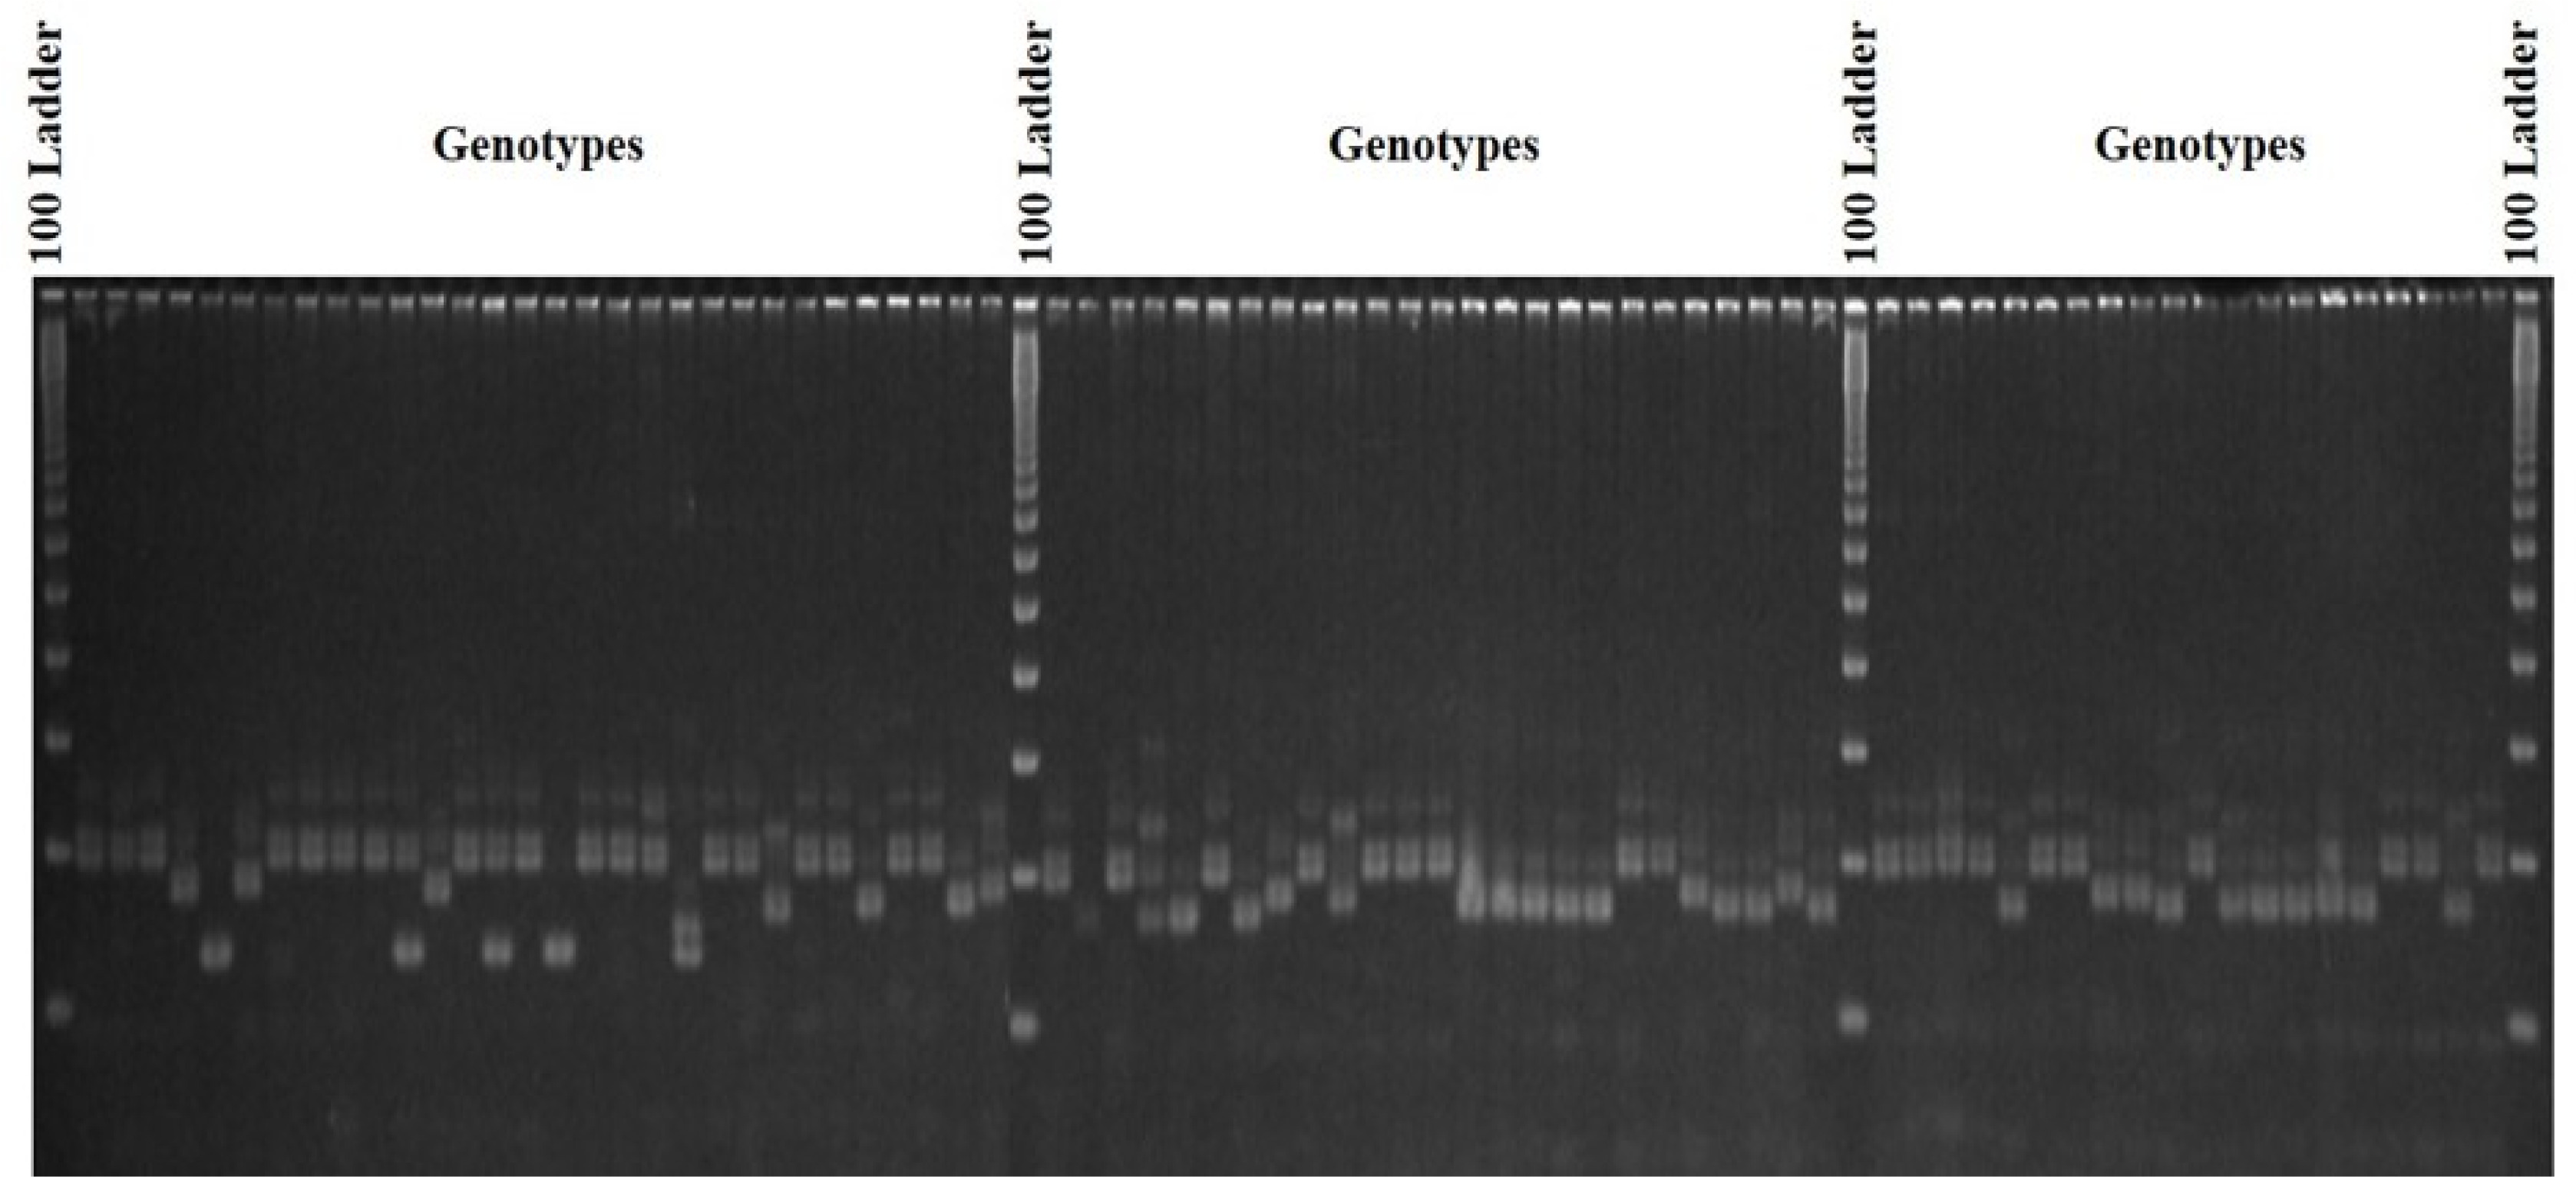
Fig. 5Banding pattern of alleles at locus Xwmc-432 in 75 wheat genotypes (Genotypes sequence in figure according the sequence in
Table 1).
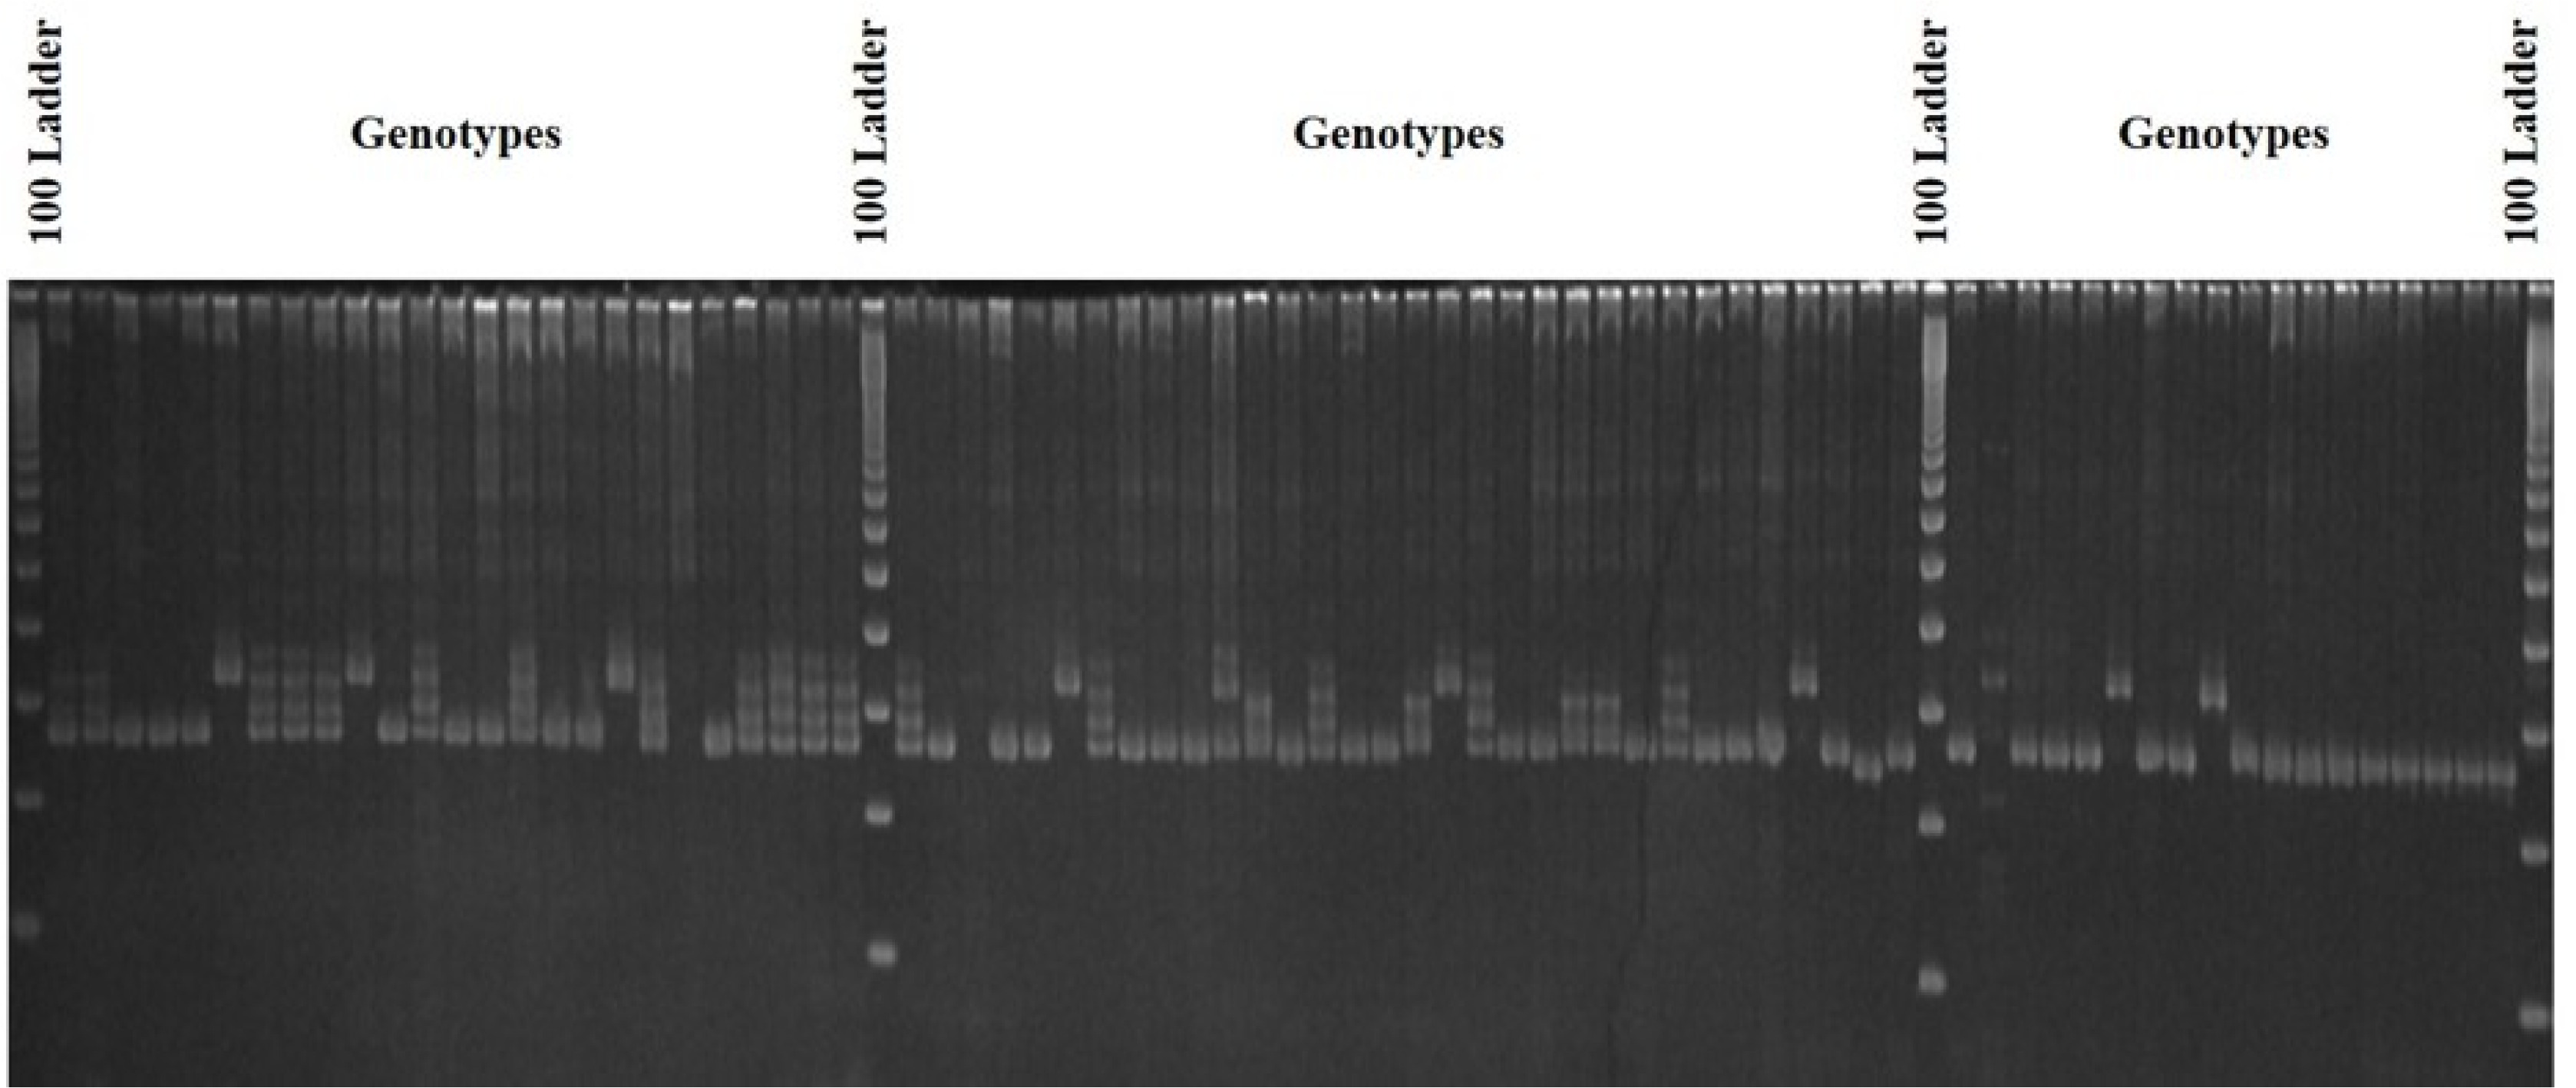
Fig. 6UPGMA dendrogram for 75 wheat genotypes showing the genetic diversity.
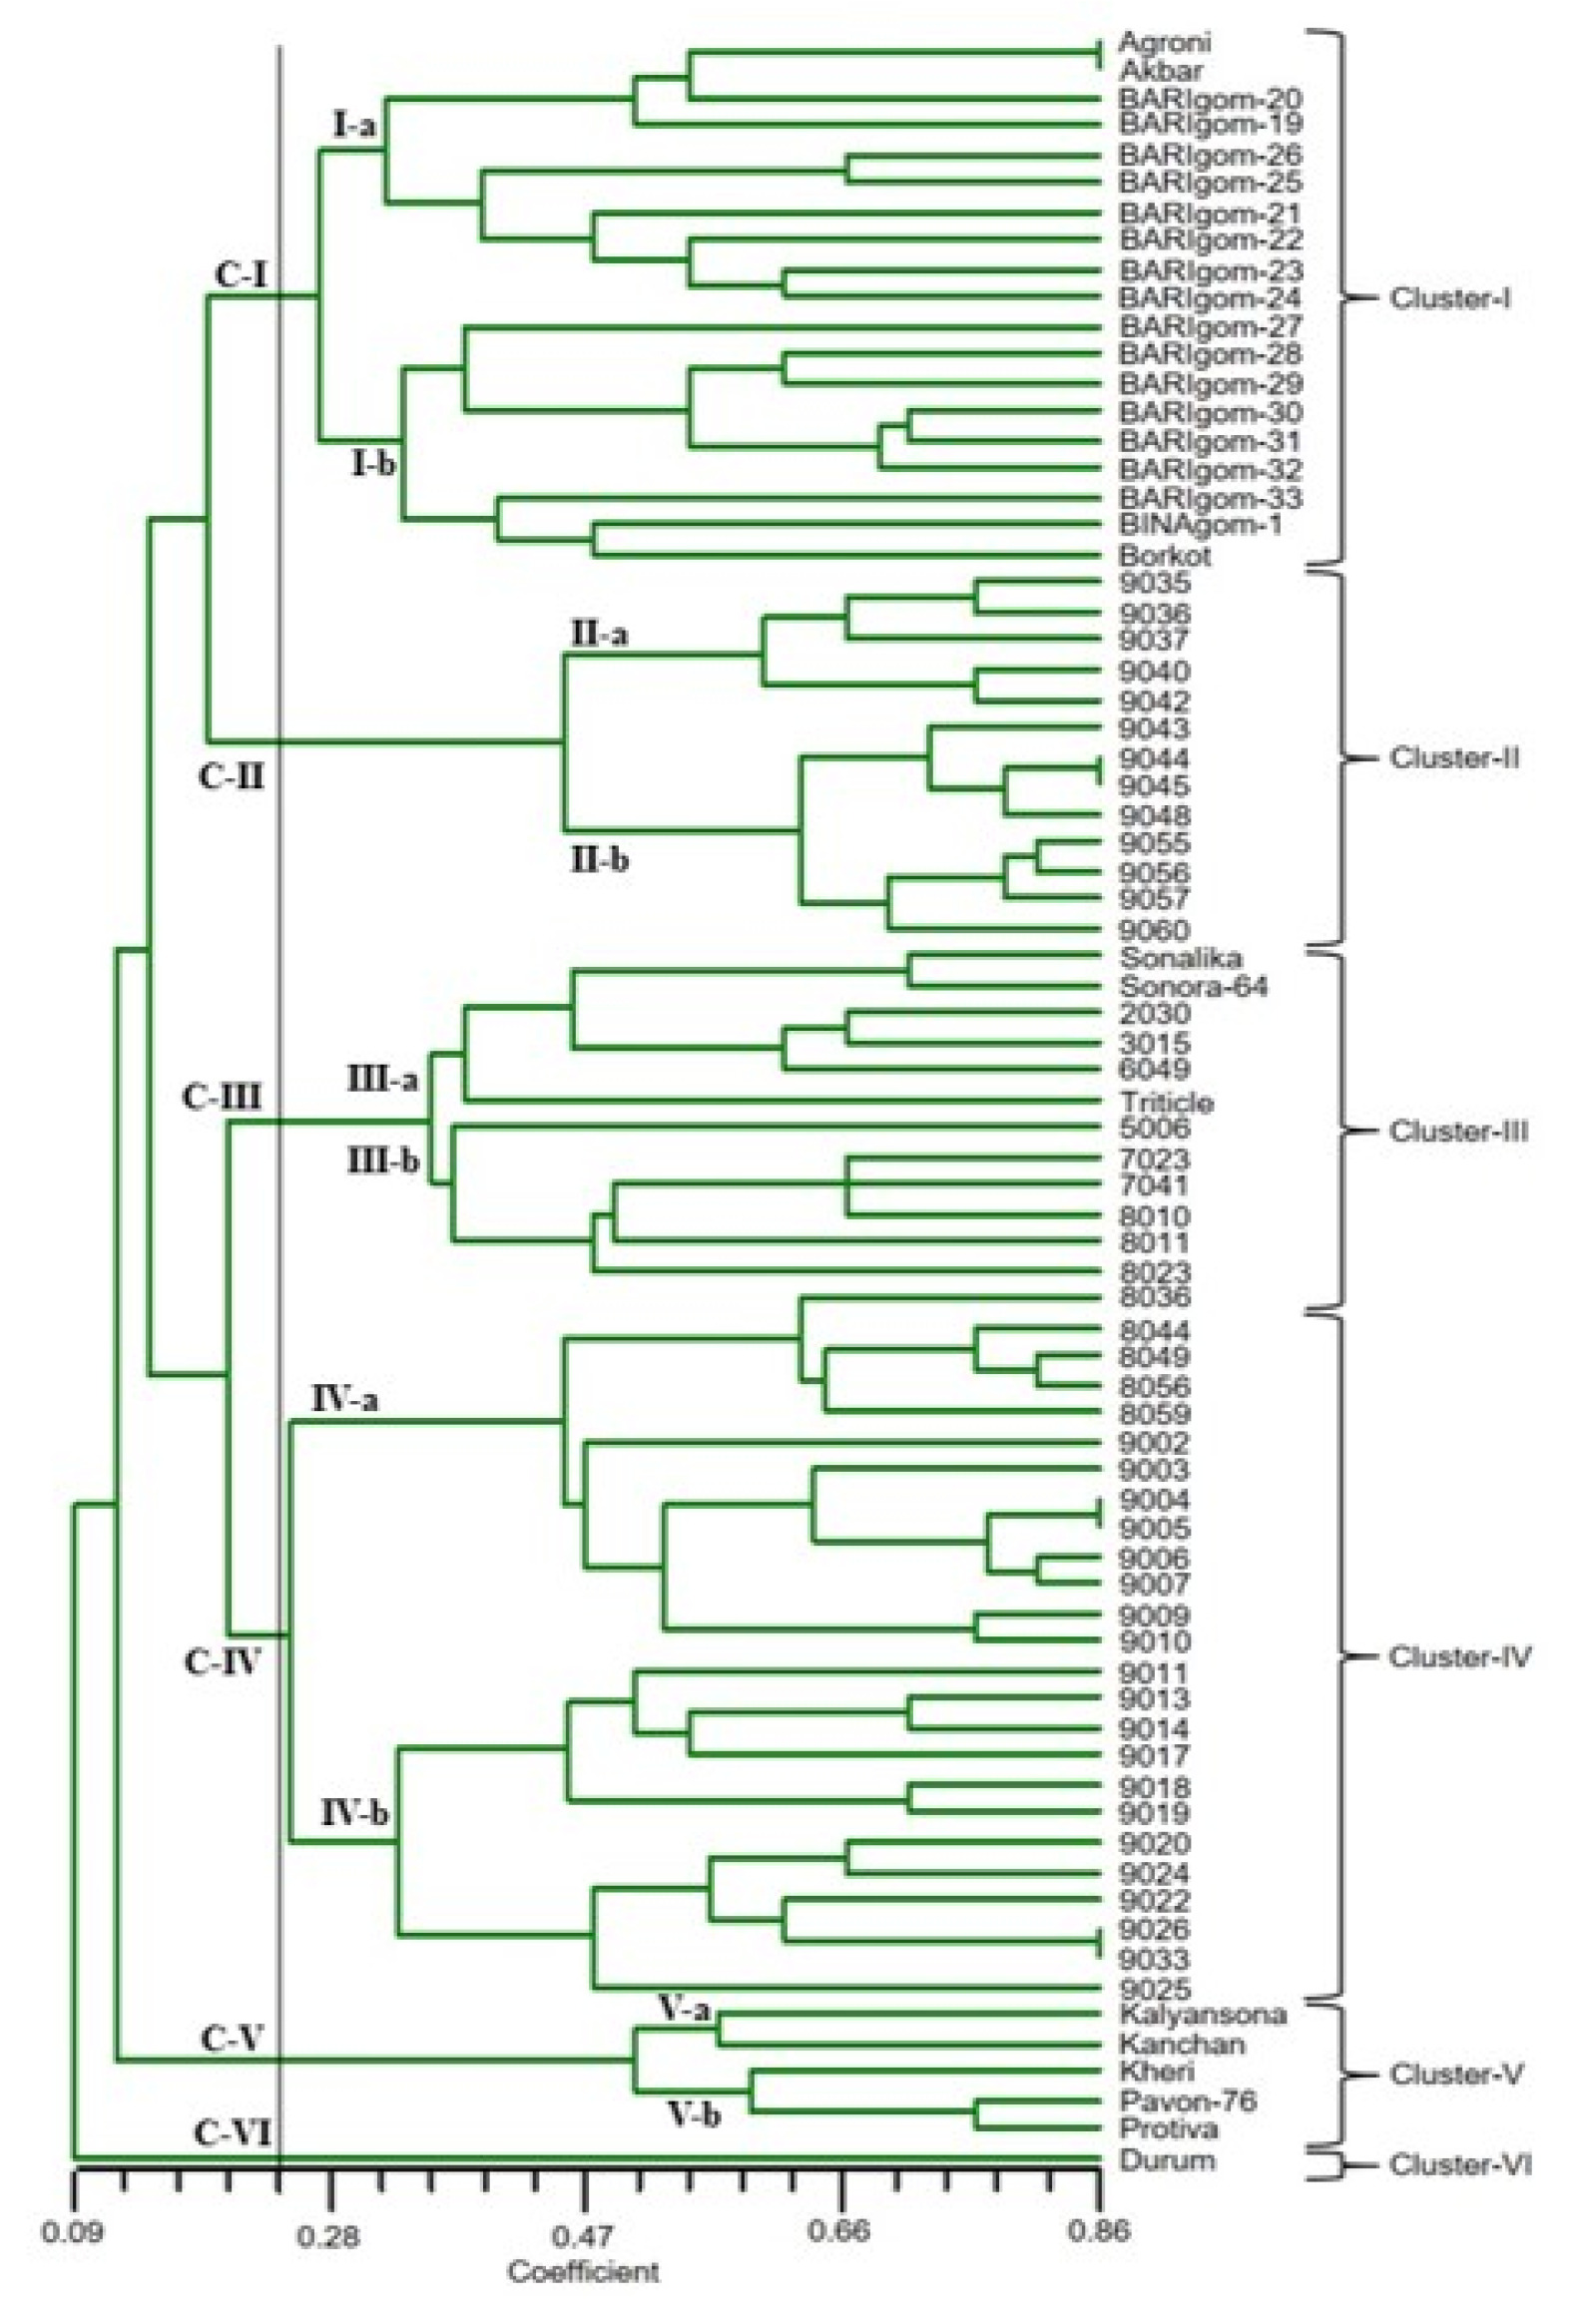
Table 1List of the studied genotypes. Cultivars (1-28), breeding line (29-75).
Table 1
|
Serial. No. |
Germplasm name |
Serial. No. |
Germplasm name |
|
1 |
Aghrani |
39 |
8044 |
|
2 |
Akbar |
40 |
8049 |
|
3 |
BARI Gom- 19 |
41 |
8056 |
|
4 |
BARI Gom- 20 |
42 |
8059 |
|
5 |
BARI Gom- 21 |
43 |
9002 |
|
6 |
BARI Gom- 22 |
44 |
9003 |
|
7 |
BARI Gom- 23 |
45 |
9004 |
|
8 |
BARI Gom- 24 |
46 |
9005 |
|
9 |
BARI Gom- 25 |
37 |
9006 |
|
10 |
BARI Gom- 26 |
48 |
9007 |
|
11 |
BARI Gom- 27 |
49 |
9009 |
|
12 |
BARI Gom- 28 |
50 |
9010 |
|
13 |
BARI Gom- 29 |
51 |
9011 |
|
14 |
BARI Gom- 30 |
52 |
9013 |
|
15 |
BARI Gom- 31 |
53 |
9014 |
|
16 |
BARI Gom- 32 |
54 |
9017 |
|
17 |
BARI Gom- 33 |
55 |
9018 |
|
18 |
BINA Gom- 1 |
56 |
9019 |
|
19 |
Barkat |
57 |
9020 |
|
20 |
Durum |
58 |
9022 |
|
21 |
Kalayan Sona |
59 |
9024 |
|
22 |
Kanchan |
60 |
9025 |
|
23 |
Kheri |
61 |
9026 |
|
24 |
Pavon- 76 |
62 |
9033 |
|
25 |
BARI Gom-18 |
63 |
9035 |
|
26 |
Sonalika |
64 |
9036 |
|
27 |
Sonora- 64 |
65 |
9037 |
|
28 |
Triticale |
66 |
9040 |
|
29 |
2030 |
67 |
9042 |
|
30 |
3015 |
68 |
9043 |
|
31 |
5006 |
69 |
9044 |
|
32 |
6049 |
70 |
9045 |
|
33 |
7023 |
71 |
9048 |
|
34 |
7041 |
72 |
9055 |
|
35 |
8010 |
73 |
9056 |
|
36 |
8011 |
74 |
9057 |
|
37 |
8023 |
75 |
9060 |
|
38 |
8036 |
|
|
Table 2
Table 2
|
Primer name |
Sequence |
AT |
Expected allele size (bp) |
|
Xcfd-1 |
ACCAAAGAACTTGCCTGGTG |
56 |
150-230 |
|
AAGCCTGACCTAGCCCAAAT |
|
Xcfd-4 |
TGCTCCGTCTCCGAGTAGAT |
56 |
220-270 |
|
GGGAAGGAGAGATGGGAAAC |
|
Xcfd-13 |
CCACTAACCAAGCTGCCATT |
56 |
180-254 |
|
TTTTTGGCATTGATCTGCTG |
|
Xcfd-18 |
CATCCAACAGCACCAAGAGA |
56 |
150-200 |
|
GCTACTACTATTTCATTGCGACCA |
|
Xcfd-46 |
TGGTGGTATAGTCGTTGGAGC |
56 |
150-175 |
|
CCACACACACACACCATCAA |
|
Xcfd-49 |
TGAGTTCTTCTGGTGAGGCA |
56 |
150-214 |
|
GAATCGGTTCACAAGGGAAA |
|
Xcfd-54 |
TCGTTCCAAAATGCATGAAA |
60 |
170-200 |
|
AAGGGCCAGAAATCTGTGTG |
|
Xcfd-183 |
ACTTGCACTTGCTATACTTACGAA |
56 |
150-179 |
|
GTGTGTCGGTGTGTGGAAAG |
|
Xwmc-11 |
TTGTGATCCTGGTTGTGTTGTGA |
56 |
130-250 |
|
CACCCAGCCGTTATATATGTTGA |
|
Xwmc-17 |
ACCTGCAAGAAATTAGGAACTC |
51 |
150-200 |
|
CTAGTGTTTCAAATATGTCGGA |
|
Xwmc-18 |
CTGGGGCTTGGATCACGTCATT |
61 |
230-280 |
|
AGCCATGGACATGGTGTCCTTC |
|
Xwmc-24 |
GTGAGCAATTTTGATTATACTG |
51 |
150-200 |
|
TACCCTGATGCTGTAATATGTG |
|
Xwmc-96 |
TAGCAGCCATGCTTAGCATCAA |
61 |
250-300 |
|
GTTTCAGTCTTTCACGAACACG |
|
Xwmc-110 |
GCAGATGAGTTGAGTTGGATTG |
56 |
170-200 |
|
GTACTTGGAAACTGTGTTTGGG |
|
Xwmc-154 |
ATGCTCGTCAGTGTCATGTTTG |
60 |
147-200 |
|
AAACGGAACCTACCTCACTCTT |
|
Xwmc-405 |
GTGCGGAAAGAGACGAGGTT |
60 |
218-250 |
|
TATGTCCACGTTGGCAGAGG |
|
Xwmc-406 |
TATGAGGGTCGGATCAATACAA |
60 |
217-250 |
|
CGAGTTTACTGCAAACAAATGG |
|
Xwmc-432 |
ATGACACCAGATCTAGCAC |
51 |
189-235 |
|
AATATTGGCATGATTACACA |
|
Xwmc-503 |
GCAATAGTTCCCGCAAGAAAAG |
51 |
237-300 |
|
ATCAACTACCTCCAGATCCCGT |
|
Xgwm-160 |
TTCAATTCAGTCTTGGCTTGG |
60 |
234-299 |
|
CTGCAGGAAAAAAAGTACACCC |
|
Xgwm-493 |
TTCCCATAACTAAAACCGCG |
60 |
172-212 |
|
GGAACATCATTTCTGGACTTTG |
Table 3Genetic diversity parameters of 21 microsatellite markers evaluated in 75 wheat genotypes as whole population and sub-populations of cultivars and accessions.
Table 3
|
Marker |
Genome No |
Obtained allele size |
Allele No |
Rare allele |
Null allele |
Major allele |
|
Whole population |
|
Cultivars |
|
Accessions |
|
Frequency |
Size (bp) |
GD |
PIC |
GD |
PIC |
GD |
PIC |
|
Xcfd-1 |
6A/6B/6D |
220-224 |
3 |
0 |
0 |
0.4400 |
224 |
|
0.6482 |
0.5748 |
|
0.5612 |
0.4650 |
|
0.6148 |
0.5334 |
|
Xcfd-4 |
3B |
249-281 |
7 |
2 |
1 |
0.2667 |
261 |
|
0.7957 |
0.7649 |
|
0.6633 |
0.6003 |
|
0.7370 |
0.6908 |
|
Xcfd-13 |
6B |
198-352 |
10 |
6 |
1 |
0.6933 |
253 |
|
0.4981 |
0.4776 |
|
0.6378 |
0.6136 |
|
0.3884 |
0.3591 |
|
Xcfd-18 |
5D |
165-202 |
9 |
2 |
1 |
0.2133 |
202 |
|
0.8462 |
0.8276 |
|
0.7449 |
0.7020 |
|
0.7551 |
0.7191 |
|
Xcfd-46 |
7D |
177-196 |
9 |
4 |
3 |
0.2933 |
180 |
|
0.7989 |
0.7717 |
|
0.8010 |
0.7732 |
|
0.7316 |
0.6912 |
|
Xcfd-49 |
6D |
167-214 |
12 |
6 |
0 |
0.2533 |
167, 204 |
|
0.8252 |
0.8038 |
|
0.6709 |
0.6198 |
|
0.8348 |
0.8145 |
|
Xcfd-54 |
4B/4D |
178-258 |
13 |
7 |
2 |
0.3467 |
238 |
|
0.8103 |
0.7903 |
|
0.8240 |
0.8020 |
|
0.7334 |
0.6952 |
|
Xcfd-183 |
5D |
188-201 |
7 |
1 |
2 |
0.3467 |
190 |
|
0.7755 |
0.7442 |
|
0.5740 |
0.5298 |
|
0.7361 |
0.6967 |
|
Xwmc-11 |
3A |
145-215 |
8 |
3 |
5 |
0.3733 |
169 |
|
0.7705 |
0.7399 |
|
0.7423 |
0.7041 |
|
0.6999 |
0.6621 |
|
Xwmc-17 |
7A/7B |
176-189 |
6 |
0 |
0 |
0.3067 |
184 |
|
0.7922 |
0.7619 |
|
0.7168 |
0.6650 |
|
0.7524 |
0.7089 |
|
Xwmc-18 |
2D |
238-270 |
11 |
3 |
0 |
0.2667 |
268 |
|
0.8295 |
0.8099 |
|
0.8112 |
0.7851 |
|
0.6455 |
0.5795 |
|
Xwmc-24 |
1A |
118-153 |
11 |
7 |
0 |
0.4400 |
150 |
|
0.7300 |
0.6980 |
|
0.6454 |
0.6265 |
|
0.6971 |
0.6444 |
|
Xwmc-96 |
3A/4A/5A/7A/5D |
249-267 |
11 |
5 |
0 |
0.3467 |
260 |
|
0.8028 |
0.7812 |
|
0.8418 |
0.8217 |
|
0.7125 |
0.6742 |
|
Xwmc-110 |
5A |
166-227 |
9 |
4 |
1 |
0.4533 |
169 |
|
0.7250 |
0.6935 |
|
0.4184 |
0.3966 |
|
0.7560 |
0.7146 |
|
Xwmc-154 |
2B |
123-152 |
10 |
3 |
0 |
0.2667 |
147 |
|
0.8480 |
0.8312 |
|
0.7041 |
0.6474 |
|
0.8248 |
0.8010 |
|
Xwmc-405 |
7A/5B/1D/7D |
206-228 |
11 |
4 |
0 |
0.2400 |
210 |
|
0.8530 |
0.8366 |
|
0.7755 |
0.7444 |
|
0.7578 |
0.7238 |
|
Xwmc-406 |
1B |
210-229 |
11 |
4 |
2 |
0.2933 |
210 |
|
0.8409 |
0.8243 |
|
0.8265 |
0.8053 |
|
0.6854 |
0.6384 |
|
Xwmc-432 |
1D |
148-230 |
9 |
2 |
1 |
0.3733 |
148 |
|
0.7662 |
0.7362 |
|
0.7602 |
0.7292 |
|
0.6347 |
0.5965 |
|
Xwmc-503 |
2D |
220-270 |
11 |
5 |
2 |
0.2933 |
263 |
|
0.8228 |
0.8024 |
|
0.7730 |
0.7475 |
|
0.8058 |
0.7831 |
|
Xgwm-160 |
4A |
172-195 |
11 |
4 |
5 |
0.2533 |
185 |
|
0.8558 |
0.8406 |
|
0.7526 |
0.7181 |
|
0.8275 |
0.8062 |
|
Xgwm-493 |
3B |
178-196 |
13 |
5 |
5 |
0.2533 |
184 |
|
0.8619 |
0.8482 |
|
0.8061 |
0.7770 |
|
0.8493 |
0.8351 |
|
Mean |
|
- |
9.6 |
3.66 |
1.47 |
0.3340 |
- |
|
0.7856 |
0.7599 |
|
0.7167 |
0.6797 |
|
0.7228 |
0.6842 |
References
- Abbasov M, Akparov Z, Gross T, Babayeva S, Izzatullayeva V, Hajiyev E, et al. 2018. Genetic relationship of diploid wheat (Triticum spp.) species assessed by SSR markers. Genet. Resour. Crop Evol.. 65(5): 1441-1453.
- Al-Faifi SA, Migdadi HM, Algamdi SS, Khan MA, Ammar MH, Al-Obeed RS, et al. 2016. Development, charac-terization and use of genomic SSR markers for assessment of genetic diversity in some Saudi date palm (Phoenix dactylifera L.) cultivars. Electron. J. Biotechnol.. 21: 18-25.
- Arzani A. 2008. Improving salinity tolerance in crop plants: a biotechnological view. In Vitro Cell Dev. Biol. Plant. 44(5): 373-383.
- Ashraf M. 2004. Some important physiological selection criteria for salt tolerance in plants. Flora : Morphol. Distrib. Funct. Ecol. Plants. 199(5): 361-376.
- Bai QJ, Dong ST. 2001. Agricultural high-efficient water usage and sustainable development of water saving agriculture. Journal of Shandong Agricultrual University. 32: 331-335.
- Bányai J, Szűcs P, Karsai I, Mészáros K, Kuti C, Láng L, et al. 2006. Cultivar identification by molecular markers. Cereal Res. Commun. 34(2-3):865-870..
- Bushuk W. Braun HJ, Altay F., Kronstad W.E., Beniwal S.P.S., McNab A., 1997. Wheat breeding for end-product use. editors. Wheat: Prospects for Global Improvement. Developments in Plant Breeding. vol 6: Springer. Dordrecht:
- Chandan M. 2006. Rituala of Dogra Community: A Socio-Cultural Analysis of 'Maile'Congregation at Jhiri Mela of Jammu Region. Unpublished M. phil Thesis in Sociology University of Jammu.
- Dakin EE, Avis JC. 2004. Microsatellite null alleles in parentage analysis. Heredity. 93: 504-509.
- Dreisigacker S, Zhang P, Warburton ML, Van Ginkel M, Hoisington D, Bohn M, et al. 2004. SSR and pedigree analyses of genetic diversity among CIMMYT wheat lines targeted to different megaenvironments. Crop Sci.. 44(2): 381-388.
- Dvořák J, Gorham J. 1992. Methodology of gene transfer by homoeologous recombination into Triticum turgidum: transfer of K+/Na+ discrimination from Triticum aestivum. Genome. 35(4): 639-646.
- Fu YB. 2015. Understanding crop genetic diversity under modern plant breeding. Theor. Appl. Genet.. 128(11): 2131-2142.
- Gepts P. 2006. Plant genetic resources conservation and utilization: the accomplishments and future of a societal insurance policy. Crop Sci.. 46: 2278-2292.
- Ghassemi FJAJ, Nix HA. 1995. Salinization of land and water resources: human causes, management and case studies. CABI/University of New South Wales Press Ltd. Randwick, NSW, Australia..
- Gill BS, Appels R, Botha-Oberholster AM, Buell CR, Bennetzen JL, Chalhoub B, et al. 2004. A workshop report on wheat genome sequencing: International Genome Research on Wheat Consortium. Genetics. 168(2): 1087-1096.
- Gorham J, Hardy C, Jones RW, Joppa LR, Law CN. 1987. Chromosomal location of a K/Na discrimination character in the D genome of wheat. Theor. Appl. Genet.. 74(5): 584-588.
- Gupta PK, Mir RR, Mohan A, Kumar J. 2008. Wheat genomics: present status and future prospects. Int. J. Plant Genomics..
- Guzmán FA, Moore S, de Vicente MC. 2020. Microsatellites to enhance characterization, conservation and breeding value of Capsicum germplasm. Genet. Resour. Crop Evol.. 67: 569-585.
- Hadrys H, Balick M, Schierwater B. 1992. Applications of random amplified polymorphic DNA (RAPD) in molecular ecology. Mol. Ecol.. 1(1): 55-63.
- Hammer K, Filatenko AA, Korzun V. 2000. Microsatellite markers-a new tool for distinguishing diploid wheat species. Genet. Resour. Crop Evol.. 47(5): 497-505.
- Haque MS, Mollick S, Saha NR, Begum SN. 2020. Evaluation of wheat cultivars for salinity tolerance at seedling stage based on morphological and molecular markers. J. Bangladesh Agril. Univ.. 18(2): 234-244.
- Haque SA. 2006. Salinity problems and crop production in coastal regions of Bangladesh. Pak. J. Bot.. 38(5): 1359-1365.
- International Wheat Genome Sequencing Consortium (IWGSC)2014. A chromosome-based draft sequence of the hexaploid bread wheat (Triticum aestivum) genome. Science. 345: 6194
- Jaiswal S, Sheoran S, Arora V, Angadi UB, Iquebal MA, Raghav N, et al. 2017. Putative microsatellite DNA marker-based Wheat genomic resource for varietal improvement and management. Front. Plant Sci.. 8: 2009
- Kernodle SP, Cannon RE, Scandalios JG. 1993. Concentration of primer and template qualitatively affects product in RAPD-PCR. Biotechniques. 1: 362-364.
- Khan IA, Awan FS, Ahmad A, Khan AA. 2004. A modified mini-prep method for economical and rapid extraction of genomic DNA in plants. Plant Mol. Biol. Report.. 22(1): 89-89.
- Leonova I, Budashkina E, Kalinina N, Röder M, Börner A, Salina E.. 2011. Triticum aestivum-Triticum timopheevii introgression lines as a source of pathogen resistance genes. Czech J. Genet. Plant Breed.. 47: S49-S55.
- Liu K, Muse SV. 2005. PowerMarker: an integrated analysis environment for genetic marker analysis. Bioinformatics. 21(9): 2128-2129.
- Malcolm CV. Davidson N, Galloway R, 1993. The potential of halophytes for rehabilitation of degraded land. editors. Productive use of saline land ACIAR Proc. Proc. Workshop. Perth, Western Australia: pp. 8-11.
- Marcussen T, Sandve SR, Heier L, Spannagl M, Pfeifer M, Jakobsen KS, et al. 2014. International Wheat Genome Sequencing Consortium. Ancient hybridizations among the ancestral genomes of bread wheat. Science. 345: 6194.
- Munns R, James RA, Läuchli A. 2006. Approaches to increasing the salt tolerance of wheat and other cereals. J. Exp. Bot.. 57(5): 1025-1043.
- Munns R. 2005. Genes and salt tolerance: bringing them together. New Phytol.. 167(3): 645-663.
- Nei M. 1973. Analysis of gene diversity in subdivided populations. Proc. Natl. Acad. Sci. U.S.A.. 70(12): 3321-3323.
- Poczai P, Varga I, Laos M, Cseh A, Bell N, Valkonen JP, et al. 2013. Advances in plant gene-targeted and functional markers: a review. Plant Methods. 9(1): 6
- Rauf S, da Silva JT, Khan AA, Naveed A. 2010. Consequences of plant breeding on genetic diversity. Int. J. Plant Breed.. 4(1): 1-21.
- Rohlf FJ. 2000. NTSYS-pc: Numerical taxonomy and multi-variate analysis system, version 2.1 Exeter Software. Setauket. New York, U.S.A..
- Shahzad A, Ahmad M, Iqbal M, Ahmed I, Ali GM. 2012. Evaluation of wheat landrace genotypes for salinity tolerance at vegetative stage by using morphological and molecular markers. Genet. Mol. Res.. 11(1): 679-692.
- Stulnig TM, Amberger A. 1994. Exposing contaminating phenol in nucleic acid preparations. Biotechniques. 16(3): 402-404.
- Tadesse W, Sanchez-Garcia M, Assefa SG, Amri A, Bishaw Z, Ogbonnaya FC, et al. 2019. Genetic gains in wheat breeding and its role in feeding the world. Crop Breed. Genet. Genom.. 1: e190005.
- Uddin MS, Boerner A. 2008. Genetic diversity in hexaploid and tetraploid wheat genotypes using microsatellite markers. Plant Tissue Cult. Biotechnol.. 18(1): 65-73.
- Vaiman D, Mercier D, Moazami-Goudarzi K, Eggen A, Ciampolini R, Lépingle A, et al. 1994. A set of 99 cattle microsatellites: characterization, synteny mapping, and polymorphism. Mammalian Genome. 5(5): 288-297.
- Vaja KN, Gajera HP, Katakpara ZA, Patel SV, Golakiya BA. 2016. Microsatellite Markers Based Genetic Diversity Analysis for Salt Tolerance in Wheat Genotypes. Ind. J. Agric. Biochem.. 29(2): 140-145.
- Walkowiak S, Gao L, Monat C, Haberer G, Kassa MT, Brinton J, et al. 2020. Multiple wheat genomes reveal global variation in modern breeding. Nature. 1-7.
- Warburton ML, Crossa J. 2002. Data analysis in the CIMMYT applied biotechnology center: for finger-printing and genetic diversity studies.
- Wen W, Franco J, Chavez-Tovar VH, Yan J, Taba S. 2012. Genetic characterization of a core set of a tropical maize race Tuxpeño for further use in maize improvement. PLoS One. 7(3): 32626
- Youssef M. 2012. Khirshyat 1.0: a simple micro-program for some molecular biology protocols. Genes, Genomes and Genomics. 6: 102-105.