Abstract
Faba bean is amongst the most important food legumes in the world. Ninety landraces and six released faba bean accessions were evaluated for variability parameters, correlation, and path coefficients for nineteen traits at two locations over two years. There were significant differences (P < 0.05) to very high significant differences (P < 0.001) among accessions for all traits considered in all environments except for leaf width, days to flowering, number of seeds per pod, and seed filling period which were non-significant at Girar Jerso in 2018 and number of branches per plant was also non-significant at Degem in 2018. In this study phenotypic coefficient of variation, genotypic coefficient of variation, and broad-sense heritability also revealed medium to high values for most traits. Genetic gains expected from selecting the top 5% of the genotypes, as a percent of the mean varied from 0.49% to 145.83%. High heritability coupled with high genetic advance as percent of mean was observed for most of the traits, indicating an improvement in these traits through simple selection. Path coefficient analysis indicated, traits that had a positive direct effect and correlation with grain yield, could be used as a reliable indicator in indirect selection for higher grain yield.
-
Key words: Heritability, Genetic advance, Correlation, Path
INTRODUCTION
Faba bean (
Vicia faba L., 2n = 2x = 12) is an old-world grain legume of the family Leguminosae (
Purseglove 1968). It is also variously known as the broad bean, horse bean, tic bean, and field bean. Depending on the cultivars used, environmental factors, and the number of pollinating insects; the rate of outcrossing ranged from 4-89% (
Rashid and Bernier 1994). The average degree of outcrossing is about 35% (
Bond and Poulsen 1983). The origin of faba bean is still in the debate because archaeological remains and/or wild relatives have not been found (
Cubero 2011). The faba bean is tolerating no exchange of genes with any other species including its close relative
Vicia narbonensis and it is also genetically isolated (
Hawtin and Hebblethwaite 1983). It is the most important cool season food legume, ranking in the world fourth after chickpeas, garden pea and lentil (
Kaur et al. 2014). It is an excellent source of protein ranging from 27-34% (
Haciseferogullari et al. 2003).
In Ethiopia, faba bean is widely grown in the mid and high altitudes of 1800-3000 m.a.s.l, where the mean rainfall ranges from 650 to 1500 mm and serves as a multipurpose crop (
CSA, 2016). Ethiopia ranked second next to China in faba bean production in the world (
FAO, 2019). Faba bean is grown worldwide for both human food and animal feed and plays an important role in the national economy and agricultural production because of its high nutritional value. The annual pro-duction of faba beans in the world is 4-5 million tons (
Merga et al. 2019). It provides the predominant affordable dietary source of protein to subsistence farmers and urban populations across North Africa, the Horn of Africa, and the Middle and Near East as well as parts of China thus partly compensating for the large deficiency in animal protein sources (
Haciseferogullari et al. 2003). According to Muehlbauer and Abebe (
www.hort.purdue.edu/newcrop/cropfactsheets/fababean.html), the whole dried faba bean seeds contain 344 calories per 100 g, 10.1% moisture, 1.3 g fat, 59.4 g total carbohydrate and provides a balanced diet of lysine-rich protein, carbohydrates, fiber, and phytochemicals (
Burstin et al. 2011) and essential amino acids (
Alghamdi 2009). In many developing countries of Africa, Asia, and Latin America where many people cannot afford to buy meat; faba bean is used for human nutrition, animal and poultry feed because of its high protein and other essential nutrient content (
El Fiel et al. 2002). Likewise, in Ethiopia, faba bean is the leading protein source for the rural people and used to make various traditional dishes (
Senayit and Asrat 1994), which otherwise includes mainly cereals or root crops. The mature seeds that are rich in proteins and minerals such as calcium, phosphorus as well as vitamins are eaten cooked or fresh (
FAO 2019). In addition to providing food for humans and maintaining soil fertility, it is also used as fodder, a break crop to reduce cereal diseases, insect pests, and weeds (
Chintalapati 2001), and attracts pollinators through its beautiful flowers (
Marzinzig et al. 2018). Yields of cereal crops following faba bean are also improved and the need for artificial nitrogen fertilizer applications is reduced for subsistence farmers (
Agegnehu and Fessehaie 2006).
Desta (1988) also reported that it can restore soil fertility through fixing atmospheric nitrogen and provides large cash for producers and foreign exchange for the country. The crop is a good source of income for small-scale farmers and fetches higher prices than cereals in the local market (
Gezahegn and Dawit 2006). In addition, the country used to earn a good share of its foreign currency from faba bean export and has high potential if production is substantially improved beyond the local demand.
Faba bean prevails a high degree of genetic variability due to the presence of an intermediate crossing system between autogamy and allogamy (
Hanelt and Mettin 1989). Yield improvement is a major breeding objective in faba bean even though the selection of superior genotypes based on the yield alone is less efficient due to the complexity of the yield that is quantitatively inherited with low heritability value (
Bond 1966). Heritability and genetic advance were considered important selection parameters. The estimation of heritability together with the genetic advance is more useful to predict the gain according to selection than the estimation of heritability alone.
Since grain yield is a complex trait and highly influenced by many genetic factors and environmental fluctuations, direct selection for yield per se is not very effective (
Lawes et al. 1983). In a plant breeding program, an effective selection depends upon the evidence on the genetic variability and association of yield-related traits with grain yield. Identification of secondary traits, which are positively associated with grain yield and possess high genetic variability and high heritability helps in formulating efficient multiple trait selection indices, as it provides means of direct and indirect effects of component characters (
Lawes et al. 1983).
Singh (1990) reported that the efficiency of selection for traits with high (80% or more) heritability was fairly easy as compared to those with low heritability (less than 40%). Hence, quantifying and determining the association of grain yield with important yield contributing traits using correlation and path coefficient analysis is of paramount importance since it provides a better understanding of the association of different characters with grain yield (
Negahi et al. 2014). The study of associations among various traits is also useful to breeders in selecting genotypes possessing groups of desired traits. Correlation analysis describes the mutual relationship between different pairs of characters without providing the nature of the cause and effect relationship of each character. Correlation analysis is not able to provide detailed and actual knowledge in the relation between a dependent variable and predictor variables. Hence, the path analysis was also done to evaluate the direct and indirect influence of each trait on grain yield (
Chitra and Rajamani 2010). This method, developed by
Wright (1921) as a statistical tool, allows studying complex relationships between traits. Many researchers have studied cause-and-effect relationships among grain yield and yield-related traits in faba beans. The benefit of path analysis is that it permits the splitting of the correlation coefficient into its components. One component is the direct effect of a predictor variable upon its response variable. The second component is the indirect effects of a yield component on the grain yield through the other traits (
Dewey and Lu 1959).
The present study aimed to estimate the variability, heritability, genetic advance for yield and yield components of ninety-six accessions of faba bean, and interrelationships of yield with some important yield components and to partition the observed genotypic correlations into their direct and indirect effects for further improvement of faba bean.
MATERIALS AND METHODS
Planting material
The plant materials used in this study consisted of a total of ninety-six accessions of faba bean of which ninety were landraces obtained from the Ethiopian Biodiversity Institute (EBI) and with six were released varieties obtained from Holetta Agricultural Research Center (HARC) and Debrebirhan Agricultural Research Center (DbARC). The origin, names, and numbers of accessions are presented in
Table 1. In addition, the geographic origin, from which sampling was done for the landrace accessions is shown in
Fig. 1 below. The acces-sions were sown within the second and third week of June for Girar Jerso and Degam districts, respectively during the 2018 and 2019 main cropping seasons.
The experimental design was laid out in 4 × 24 (4 incomplete blocks in replication and 24 plots in an incomplete block) alpha-lattice designs (
Patterson and Williams 1976) with two replications. The plot size consisted of 1 row of 2 m long spaced 0.4 m and 0.1 m inter-row and intra-row spacing, respectively, and 1 m between the adjacent incomplete block and 1.5 m between replications were left for easy movement and management activities. Diammonium phosphate (DAP) fertilizer was applied at the recommended rate of 100 kg/ha at sowing. Sowing was done by hand drilling at a seed rate of 20 seeds per row. Weeding and other cultural practices were done as per the recommendation adopted for the area.
Data on different traits were collected on a plot and plant basis (from ten sample plants from each plot). The perfor-mance of each accession for the traits was estimated by the mean values of ten samples. Leaf length, leaf width, leaf area, number of pods per node, internode length, lowest pod height, plant height, number of pods per plant, number of seeds per pod, number of branches per plant, pod length, pod width, number of seeds per plant and thousand seed weight were recorded on plant basis; whereas days to flowering, days to maturity, seed filling period, seed yield per plot and grain yield per hectare were estimated on a plot basis.
Data analysis
The mean values of the recorded data were subjected to analysis of variance according to
Gomez and Gomez (1984) to test the level of significance among the accessions for different traits. Analysis of variance was performed separately for each environment before running the combined analysis. Error mean squares from each environment for significant traits were tested for homogeneity of variance to ensure that the combined analysis of variance across environments was appropriate or not using Bartlett’s test. The mean separation was done using Duncan’s Multiple Range Test (DMRT) for the trait grain yield. Finally, statistical analysis was carried out using the R program.
The variability present in the genotypes was estimated by simple measures, namely, range, mean, standard error, phenotypic (σ
2p) and genotypic (σ
2g) variances, and phenotypic (PCV) and genotypic (GCV) coefficient of variation.
Sharma (1998) was used to estimate phenotypic and genotypic variances using mean squares. Both genotypic and phenotypic coefficients of variability were computed based on
Burton and De Vane (1953). The estimates of GCV and PCV were categorized based on
Sivasubramanian and Menon (1973) as follows: 0-10%: low, 10-20%: medium, 20%, and above: high.
Lush (1940) formula was used to compute heritability (h
2b) in the broad sense for all traits. Heritability was also categorized as low, medium, and high as given by
Johnson et al. (1955) as follows: 0-30%: low, 30-60%: medium, 61%, and above: high. Genetic advance (GA) for each trait was computed using the formula adopted from
Johnson et al. (1955) and
Allard (1960). Genetic advance as percent of the mean (GAM) was categorized as low, medium, and high as given by
Johnson et al. (1955) as follows: 0-10%: low, 10-20%: medium, 20%, and above: high.
Genotypic and phenotypic correlations between grain yield and yield component traits were estimated using the method described by
Miller et al. (1958). The coefficients of correlations at a phenotypic level were tested for their significance by comparing the value of the correlation coefficient with the tabulated r-value at the g-2 degree of freedom. However,
Robertson (1959) formula was used to test for the significance of correlation coefficients at a genotypic level. The methodology proposed by
Dewey & Lu (1959) was used to perform the path analysis for grain yield and its components keeping grain yield as a resultant variable and its components as causal variables.
RESULTS
Analysis of variances
The analysis of variance for different traits at Girar Jerso and Degem are presented in
Tables 2 and
3, respectively. There were significant differences (
P < 0.05) to very high significant differences (
P < 0.001) among accessions for all traits considered in all environments except for leaf width, days to flowering, number of seeds per pod, and seed filling period which were non-significant at Girar Jerso in 2018 and number of branches per plant was also non-significant at Degem in 2018. Results obtained from the test of homogeneity for an error of variance exhibited the calculated Chi-square test (x
2) value surpasses the corresponding tabular (x
2) value at 5% and 1% level of significance for most traits (
Table 4). Therefore, the hypothesis of homogeneous variance was rejected according to
Gomez and Gomez (1984). Consequently, the analysis of variance and other statistical analyses were run for the four environments separately.
The mean performances and ranges of nineteen traits for the 96 accessions evaluated in this study are presented in
Table 5. Data revealed that there is wider range of variability observed for most of the studied traits. Mean performances of all traits of the accessions also varied across the test environments. Based on the mean perfor-mance of the trait grain yield, 11.5%, 25%, and 26% of the accessions surpassed the standard check, Hachalu at Girar Jerso in 2018, at Degem in 2018, and at Degem in 2019, respectively. At Girar Jerso in 2019, 4.2% of the accessions surpassed the standard check, Moti. The Duncan’s Multiple Range Test (DMRT) was used for the mean comparison for the trait grain yield (
Supplementary Table S1). The three top high yielding landrace accessions 2931, 30017 and 29532 are significantly different from all of the accessions including released varieties since their means are indicated by different letters as compared to other accessions.
Estimates of σ
2p, σ
2g, PCV, GCV, h
2b, GA, and GAM at Girar Jerso and Degem districts are presented in
Tables 6 and
7, respectively. The estimates of σ
2p and σ
2g were the highest for thousand seed weight followed by seed yield per plot and the lowest for the number of pods per node followed by the number of seeds per pod at all environments. At Girar Jerso and Degem districts, high to moderate PCV and GCV were observed for the traits leaf length, leaf width, leaf area, number of pods per node, lowest pod height, number of pods per plant, number of branches per pant, pod length, number of seeds per plant, seed yield per plot, thousand seed weight and grain yield. On the other hand, the lowest PCV and GCV was observed for days to maturity.
Moderate to high h2b for most of the traits also revealed in this study. At Girar Jerso in 2018, the h2b was ranged from 19.81% for leaf area to 68.73% for days to maturity. At Girar Jerso and Degem in 2019 high h2b were exhibited for most of the traits except for the traits pod width (23.20%), seed yield per plot (31.01), and grain yield (48.24) at Girar Jerso in 2019 but only for pod width (48.07) at Degem in 2019. Whereas at Degem in 2018, the high h2b has revealed for the traits leaf length (99.08%), leaf width (99.25%), leaf area (99.99%), days to flowering (90.42%), days to maturity (91.17%), seed filling period (95.05%), and thousand seed weight (89.70%). On the other hand, moderate h2b was exhibited for the traits number of pods per plant (41.36%), pod length (35.74%), the number of seeds per plant (48.70%), seed yield per plot (44.11%), and grain yield (30.77%). The low h2b was observed for the number of pods per node (24.35%), internode length (13.72%), lowest pod height (20.12%), plant height (21.03%), number of seeds per pod (20.17%), number of branches per plant (15.11%), and pod width (24.49%).
Genetic advance as percent of mean revealed a medium to high variation for most of the traits under study in all environments. Overall GAM ranged from 0.49% for thousand seed weight at Degem in 2018 to 145.83% for a number of branches per plant at Girar Jerso in 2019. Leaf length, leaf width, leaf area, number of pods per node, and number of seeds per pod exhibited high GAM at Girar Jerso in 2019, Degem in 2018, and Degem in 2019. On the other hand, the traits such as internode length, lowest pod height, plant height, number of pods per plant, seed yield per plot, and thousand seed weight revealed high GAM at Girar Jerso in 2018, Girar Jerso in 2019, and Degem in 2019. Pod length exhibited high GAM at Girar Jerso in 2019 and Degem in 2019, while medium GAM exhibited at Girar Jerso in 2018 and Degem in 2018.
On the other hand, traits such as leaf area, number of pods per node, number of branches per plant at Girar Jerso in 2018; pod width at Girar Jerso in 2019; and traits such as number of pods per node, internode length, lowest pod height, and number of branches per plant at Degem in 2018 with high PCV values have less h2b. In the current study, plant height, thousand seed weight, and grain yield with high h2b were followed by a high GA at Girar Jerso in 2018, while at Girar Jerso in 2019 high h2b and high GA obtained for most of the traits except days to flowering, pod width, days to maturity, seed yield per plot, and grain yield. At Degem in 2018, leaf length, leaf width, and leaf area exhibited high h2b followed by high GA, whereas most of the traits under study revealed high h2b and high GA except for days to flowering, pod width, days to maturity, and seed filling period at Degem in 2019. However, days to maturity and days to flowering possessed high h2b with low GAM, at Girar Jerso in 2018, and Girar Jerso in 2019, respectively. While, days to flowering and days to maturity also possessed high h2b with low GAM at Degem in 2018 and Degem in 2019.
Correlation analysis
Simple phenotypic and genotypic correlation coefficients of the studied traits for the individual environments are shown in
Tables 8-
11, respectively. Significant positive genotypic and phenotypic correlation coefficients were detected between grain yield and number of pods per plant (0.23*, 0.20*), number of branches per plant (0.30**, 0.21*), number of seeds per plant (0.20*, 0.24*), and seed yield per plot (0.69**, 0.74**) at Girar Jerso in 2018. While, at Girar Jerso in 2019, grain yield revealed significant positive correlation coefficients with leaf length (0.52**, 0.38**), leaf width (0.35**, 0.28**), leaf area (0.48**, 0.37**), lowest pod height (0.31**, 0.23*), plant height (0.49**, 0.40**), number of pods per plant (0.34**, 0.37**), number of seeds per pod (0.34**, 0.22*), number of branches per plant (0.34**, 0.37**), pod length (0.39**, 0.27**), number of seeds per plant (0.42**, 0.39**), and seed yield per plot (0.82**, 0.77**) at both genotypic and phenotypic levels, respectively. Genotypic and phenotypic correlation coefficients revealed a positive and significant association of grain yield with leaf length (0.36**, 0.25*), plant height (0.76**, 0.36**), seed yield per plot (0.77**, 0.82**), and thousand seed weight (0.34**, 0.22*) at Degem in 2018. Whereas, at Degem in 2019, grain yield showed a positive and significant association with seed yield per plot (0.82**, 0.82**) and thousand seed weight (0.25*, 0.22*) at both genotypic and phenotypic levels, respectively. On the other hand, grain yield showed negative and significant correlations with days to flowering (‒0.21*) and number of pods per node (‒0.23*) at Degem in 2018 at genotypic level. In addition, grain yield showed non-significant genotypic and phenotypic correlation width days to maturity at all environments.
In the present study, path coefficient analysis was done on the basis of genotypic correlation coefficients and the results are presented in
Tables 12-
15, respectively. At Girar Jerso in 2018, days to flowering, and the number of branches per plant exerted negative direct effects on grain yield but exhibited a positive correlation with grain yield due to their positive indirect effects through the number of seeds per pod, the number of seeds per plant, and seed yield per plot. The number of seeds per pod also showed negative direct effects and a positive correlation with grain yield due to its positive indirect effects through days to flowering, number of branches per plant, number of seeds per plant, and seed yield per plot. On the other hand, the number of seeds per plant, and seed yield per plot exerted a positive direct effect and also had a positive association with grain yield.
At Girar Jerso in 2019, leaf length, leaf area, plant height, number of pods per plant, pod length, and seed yield per plot exerted negative direct effects on grain yield but exhibited a positive correlation with grain yield due to their positive indirect effects through leaf width, lowest pod height, number of seeds per pod, number of branches per plant, and number of seeds per plant. Whereas, leaf width, lowest pod height, number of seeds per pod, number of branches per plant, pod width, and number of seeds per plant exerted positive direct effect and also had a positive association with grain yield. Leaf width exerted the highest positive direct effects followed by the number of seeds per plant and both traits also exhibited a positive correlation with grain yield.
At Degem in 2018, internode length exerted negative direct effects on grain yield but exhibited a positive correlation with grain yield due to its positive indirect effects through leaf length, days to flowering, number of pods per node, plant height, number of seeds per pod, and thousand seed weight. The number of pods per plant exerted negative direct effects on grain yield and also had a positive association with grain yield, due to its positive indirect effects through leaf length, days to flowering, number of pods per node, plant height, and pod width. Pod width exerted negative direct effects on grain yield but exhibited a positive correlation with grain yield due to its positive indirect effects through the number of pods per plant, the number of seeds per pod, and thousand seed weight. Seed yield per plot also exerted negative direct effects on grain yield but exhibited a positive correlation with grain yield due to its positive indirect effects through leaf length, leaf width, plant height, and the number of seeds per pod. Even though the number of pods per node associated negatively and significantly with grain yield, this trait exerted positive direct effects on grain yield. The negative association of the number of pods per node with grain yield attributed to the negative indirect effects of this trait through internode length, number of pods per plant, thousand seed weight, and number of seeds per pod. Leaf length, plant height, number of seeds per pod, and thousand seed weight exerted positive direct effects on grain yield and also had a positive association with grain yield.
At Degem in 2019, seed yield per plot exerted negative direct effects on grain yield but exhibited a positive correlation with grain yield due to its positive indirect effects through leaf length, internode length, and pod width. Thousand seed weight also exerted negative direct effects on grain yield but exhibited a positive correlation with grain yield due to its positive indirect effects through internode length and pod width. On the other hand, leaf length, internode length, and pod width exerted a positive direct effect and also had a positive association with grain yield.
DISCUSSION
Analysis of variance
The analysis of variance due to faba bean accessions exhibited significant to very high significant differences for most of the traits in all environments, showing that there are differences between the all environments which are significant enough to realize the genetic performance of faba bean accession. It is evident from the results that mean squares due to accessions were very highly significant for grain yield, thousand seed weight, seed yield per plot, days to maturity, number of seeds per plot, and number of pods per plant, suggesting an adequate amount of genetic variability among accessions tested and can provide further chances for effective selection in the future breeding program. This revealed that there is sufficient possibility for the selection of promising accessions from the present gene pool for yield and its components.
Alghamdi (2007) also observed a highly significant difference between faba bean genotypes on traits such as flowering date, maturity date, number of branches per plant, number of seeds per plant, number of pods per plant, and thousand seed weight.
Peyman (2014) found a highly significant difference between faba bean genotypes for seed yield per plot, number of seeds per pod, number of pods per plant, thousand seeds weight, and pod length.
Peyman (2015) reported a highly significant difference with pod length, days to maturity, thousand seed weight, and number of seeds per plant.
Ammar et al. (2015) similarly measured a highly significant difference between faba bean genotypes with traits: days to flowering and maturity, plant height, number of branches per plant, number of pods per plant, and number of seeds per plant. These results are similar to the findings of other scholars like
Million and Habtamu (2012),
Fatih (2017),
Peyman (2015), and
Fatih et al. (2017) with faba bean for most of the traits.
The mean and ranges of the traits in
Table 5 revealed that there is a wider range of variability observed for most of the studied traits. Overall grain yield for accessions ranged from 0.29 to 3 t/ha. Accession 29531 gave the highest mean grain yield (3 t/ha) in all environments. The accessions 25298 and 26859 gave the lowest grain yield with values of 0.29 t/ha and 0.66 t/ha at Girar Jerso in 2018 and Girar Jerso in 2019, respectively. While at Degem during 2018 and 2019 main cropping season accession 25018 gave the lowest grain yield of 0.64 t/ha. The high yielding accession 29531 had a yield advantage of 11.46%, 26.04%, and 26.04% as compared with that of the best check Hachalu at Girar Jerso in 2018, Degem in 2018 and Degem in 2019, respectively. Similarly, at Girar Jerso in 2019, the high yielding accession 29531 had a yield advantage of 4.17% as compared with the best check Moti. Hence, the result of the range of parameters suggested that there were considerable differences observed in all of the traits in all environments. This is primarily attributed to differences in the accessions evaluated and the test environment due to the differences in their climatic and agro-ecological parameters such as rainfall, temperature, and edaphic conditions. These results reflect the selection prospects for these traits to improve the performance through a breeding program. In agreement with this study,
Sheelamary and Shivani (2015) reported a wider range of variability on the traits of plant height, number of pods per plant, and seed yield per plot.
The estimated values of σ
2p were in the range of 0.07 for number of pods per node at Girar Jerso in 2019 to 14,405.54 for thousand seed weight at Degem in 2019, while the estimated values of σ
2g were in the range of 0.03 at Degem 2018 to 13,399.54 for thousand seed weight at Degem in 2019. Hence, the wide ranges of σ
2p and σ
2g in the current study indicated the existence of variability in the tested faba bean accessions for improvement. In order to improve grain yield and its related traits, knowledge of the extent of genetic variability that is measured by GCV and PCV (
Jiang et al. 2014) is also crucial for any breeding program. Genotypic and phenotypic coefficients of variation were reported as the major tools used to measure the variability that exists in a given population (
Burton and Devane 1953). As compared to PCV, the magnitude of genetic variation of GCV is better assessed, so breeders commonly focus on traits with high GCV estimates (
Kebebew et al. 2015). The study revealed that the PCV was generally higher than the GCV for all traits, indicating a more or less equal genetic effect on the trait. High to moderate GCV values for most of the traits in this study also suggested the possibility of improving these traits through selection since these traits played a great role in the contribution of the total variation. Moreover, the difference between PCV and GCV was very narrow which indicated the importance of genetic variance in the inheritance of the studied traits. The closeness of PCV and GCV values also showed a little environmental effect on the expression of these traits. The minimum differences between PCV and GCV values imply additive gene effects, indicating that genotypes can be improved and selected for these traits. In agreement with the results of this work,
Million and Habtamu (2012) reported high GCV and PCV for a number of pods per plant and grain yield.
Fatih et al. (2017) also reported high GCV and PCV for thousand seed weight and grain yield that concur with this study.
As a guiding factor to breeders for developing a success-ful breeding program, understanding the heritability of economically important traits (
Jiang et al. 2014) and the genetic advance as percent mean (
Elangovan et al. 2014) is very crucial. In this study, moderate to high h
2b for most of the traits was presented in
Tables 6 and
7. Hence, high estimates of h
2b indicated that selection based on mean would be successful in improving these traits since it can be mainly determined by the genetic constitution. On the other hand, the low h
2b value for a few traits indicated a limited possibility of improvement through selection because the environmental effect is more evident than the genetic effect. In agreement with the results of this work,
Peyman (2015) reported high h
2b for the number of seeds per plant and thousand seed weight. The results of this research are also similar to the results of
Bakhiet et al. (2015),
Sheelamary (2015),
Tafere et al. (2013),
Toker (2004),
Alghamdi (2007),
Abo El-zahab et al. (1980), and
Fatih (2017).
Abdul-aziz et al. (2015), and
Alghamdi (2007) reported moderately high h
2b for leaf length, leaf width, leaf area, lowest pod height, plant height, number of pods per plant, number of seeds per plant, number of seeds per pod, and thousand seed weight indicating the possibility of improvement via selection for these traits. In this study, a medium to high h
2b and GCV was associated with a medium to high GAM for most of the traits. This result agrees with the work of
Dixit et al. (1970) who reported high h
2b and GCV that associated with high GAM. Both heritability and GCV also gave the best picture for the expected GAM as reported by
Swarup and Changle (1962). Traits that showed high and moderate h
2b are found to have high GCV values than traits that showed low h
2b. Since most of the variation is genetic as compared to the environment, selection for these traits is relatively easy. On the other hand, traits such as leaf area, number of pods per node, number of branches per plant at Girar Jerso in 2018; pod width at Girar Jerso in 2019; and traits such as number of pods per node, internode length, lowest pod height, and number of branches per plant at Degem in 2018 with high PCV values have less h
2b which means variation for these traits is more of the environment than genetic and it is not advisable to select for these traits. In the current study, plant height, thousand seed weight, and grain yield with high h
2b were followed by a high GA at Girar Jerso in 2018, while at Girar Jerso in 2019 high h
2b and high GA obtained for most of the traits except days to flowering, pod width, days to maturity, seed yield per plot, and grain yield. At Degem in 2018, leaf length, leaf width, and leaf area exhibited high h
2b followed by high GA, whereas most of the traits under study revealed high h
2b and high GA except for days to flowering, pod width, days to maturity, and seed filling period at Degem in 2019. Similarly,
Bora et al. (1998) stated that a high h
2b was followed by a high GA for a number of pods per plant, which indicated high additive gene action and the possibility of trait improvement through selection. Therefore, mass selection and/or other breeding methods based on progeny testing could result in a high possibility of improvement in this trait. However, days to maturity and days to flowering possessed high h
2b with low GAM, at Girar Jerso in 2018, and Girar Jerso in 2019, respectively. While, days to flowering and days to maturity also possessed high h
2b with low GAM at Degem in 2018 and Degem in 2019, indicating the large number of non-additive gene action that could be exploited through heterosis. Hence, though h
2b assessments offer the basis for selection on phenotypic performance, the estimates of h
2b and GA should always be considered concurrently, as high h
2b is not always related to high GA (
Johnson et al. 1955). In addition to this, they also indicated that high h
2b along with high GAM implies the role of additive genes for the expression of the traits, and thus it could be very effective in crop improvement programs upon selection. Therefore, selection based on these traits with a relatively high GAM will result in the improvement of the performance of the genotypes for that trait.
At Girar Jerso in 2018 and Degem in 2019, grain yield showed positive and highly significant (
P < 0.01) association with seed yield per plot at genotypic and phenotypic correlation coefficients. Similarly, at Girar Jerso in 2019, grain yield showed positive and highly significant associations with leaf length, leaf width, leaf area, plant height, number of pods per plant, number of branches per plant, pod length, number of seeds per plant, and seed yield per plant at genotypic and phenotypic correlation coefficients. At Degem in 2018, grain yield also showed positive and highly significant association with plant height and seed yield per plot at genotypic and phenotypic correlation coefficients. Therefore, breeding for improvement of these traits can improve the grain yield of faba bean and breeder can use these traits as a selection criterion. Hence, indirect selection based on these traits can improve grain yield. On the contrary, grain yield revealed negative and non-significant genotypic and phenotypic correlation with some traits, so selection based on these traits will not improve the grain yield of faba bean. In line with the current study,
Tadele et al. (2011) found a positive and significant correlation of grain yield with the number of seeds per pod at the genotypic level at Sinana, Ethiopia. Similarly,
Tadele et al. (2011) found a positive and significant correlation of grain yield with days to flowering, days to maturity, number of pods per plant, number of seeds per pod at the genotypic level at Sinja, Ethiopia. On the other hand,
Tadele et al. (2011) reported a positive and significant correlation of grain yield with plant height, number of seeds per plant, and thousand seed weight at the phenotypic level at Sinja.
Yassin (1973) also found a positive and significant correlation of grain yield with the number of pods per plant at the genotypic level.
Peyman (2014) also reported positive and significant correlations between grain yield and number of pods per plant, number of seeds per pod, and pod length.
Alghamdi (2007);
Azarpou et al. (2012);
Tafere et al. (2013); and Abdella
et al. (2015) reported positive and significant association between grain yield and thousand seed weight. Gemechu and Musa (2002) also observed positive and significant association between grain yield and number of pods per plant.
Ulukan (2003);
Abdelmula et al. (2007); and
Ouji et al. (2011) were reported a positive and significant phenotypic relationship between the number of pods per plant and trait; plant height, seed yield per plot, number of seeds per plant and thousand seed weight. Hence, the positive correlation of the aforementioned traits with grain yield shown that these traits are the most significant ones to be considered for indirect selection to improve grain yield since grain yield can be concurrently improved with a trait for which it exhibited a strong correlation. Days to flowering and the number of pods per node revealed a negative and significant genotypic correlation with grain yield. This indicated a reverse association between days to flowering and number of pods per node with grain yield and improvement for these traits decreases grain yield at Degem in 2018. On the other hand, the non-significant association of grain yield with days to maturity at genotypic and phenotypic level revealed that selection for an increased level of these traits may not bring significant change in grain yield. In contrast to this study, Faith (2017) observed negative and significant phenotypic relationships for grain yield and days to maturity.
Results from the analysis of correlation coefficients revealed that genotypic correlation coefficients are greater than their corresponding phenotypic coefficients. This shows that selection based on phenotypic mean performance may improve the genotypic performance because the effect of environments on the expression of most of the traits is relatively lower. The substantial positive correlations between grain yield and yield-related traits indicate that enhancement of these traits can pay positively towards improved grain yield; and hence, can be considered when indirectly selecting for high grain yield in the process of faba bean breeding. Thus, correlation helps breeders to identify the traits that could be used as selection criteria in a breeding program. These results suggest that improvement of grain yield in faba bean linked with these traits and the selection of these traits might have an impact on grain yield. These results are in agreement with those obtained by
Sheelamary and Shivani (2015), and
Tafere et al. (2013).
The genotypic correlations were further subjected to path coefficient analysis, which involves the partitioning of the correlation coefficients into direct and indirect effects via alternative traits. At Girar Jerso in 2018 the traits number of seeds per plant and seed yield per plot, and at Girar Jerso in 2019 the trait leaf width exerted a positive direct effects and also had a positive association with grain yield. While at Degem in 2018 also the traits leaf width, plant height, number of seeds per pod, and thousand seed weight, and at Degem in 2019 the traits internode length, and pod width exerted a positive direct effect and also had a positive association with grain yield. Since their direct effect and correction with grain yield were positive; these traits could be used as a reliable indicator in indirect selection for higher grain yield. This indicated that selection based on these traits will improve the grain yield at this particular location for the particular crop. It also implies that those traits are the most important component of grain yield. This result also agrees with
Tadele et al. (2011) who reported the number of pods per plant, the number of seeds per pod, thousand seed weight, and pod length had high positive direct effects on grain yield. At Degem in 2018, the number of pods per node exerted positive direct effects on grain yield but associated negatively and significantly with grain yield due to the negative indirect effects of this trait through internode length, number of pods per plant, number of seeds per pod, and thousand seed weight. Under these conditions, a restricted concurrent selection model is to be followed, i.e. restrictions are to be imposed to nullify the undesirable indirect effects through internode length, number of pods per plant, number of seeds per pod, thousand seed weight to use direct effects (
Singh and Kakar 1977). The negative direct effect of days to flowering, number of branches per plant, internode length, lowest pod height, number of pods per plant, and number of seeds per pod was compensated by their indirect positive effect via other traits at Girar Jerso in 2018. At Girar Jerso in 2019 the negative direct effect of leaf length, leaf area, plant height, number of pods per plant, pod length, and seed yield per plot was compensated by its indirect positive effects through leaf width, lowest pod height, number of seed per pod, number of branches per plant, and number of seeds per plant. Internode length, number of pods per plant, pod width, seed yield per plot exerted negative direct effects on grain yield but exhibited a positive correlation with grain yield due to its positive indirect effects through other traits at Degem in 2018. At Degem in 2019 seed yield per plot, and thousand seed weight exerted negative direct effects on grain yield but exhibited a positive correlation with grain yield due to its positive indirect effects through other traits. According to
Singh and Chaudhary (1977), when a trait had a positive correlation and high positive indirect effects on the other hand it had negative direct effects, so emphasis must be given to the indirect effects and consequently, indirect causal factors are to be considered concurrently for selection in this situation.
CONCLUSION
Mean squares due to accession was significant to highly significant for most of the traits in all environments, indicating the existence of sufficient genetic variability for the traits. High PCV and GCV for the studied traits indicated that environmental influences on the expression of these traits were minor. Heritability of most traits was high and moderate indicating that selection based on mean would be successful in improving these traits. High heritability also indicates an additive gene action and, hence, possible trait improvement through selection. The result of GAM indicated an increase of 0.49% to 145.83% magnitude made by selection. The positive and significant genotypic and phenotypic correlation was observed between grain yield and number of pods per plant, number of branches per plant, number of seeds per plant, and seed yield per plot at Girar Jerso in 2018. The positive and significant genotypic and phenotypic correlation was also observed between grain yield and leaf length, leaf width, leaf area, lowest pod height, plant height, number of pods per plant, number of seeds per pod, number of branches per plant, pod length, number of seeds per plant, and seed yield per plot at Girar Jerso in 2019. There was a significant positive genotypic and phenotypic correlation between grain yield and leaf length, plant height, seed yield per plot, and thousand seed weight at Degem in 2018, while seed yield per plot and thousand seed weight at Degem in 2019. So, these traits are likely to be successfully employed for the selection of high yielding faba bean accessions in the respective environments. Based on correlation and path analysis, the traits viz., internode length, lowest pod height, number of pods per plant, number of branches per plant, number of seeds per plant, and seed yield per plot at Girar Jerso in 2018 and the traits viz., leaf length, leaf width, lowest pod height, plant height, number of seeds per plant, and seed yield per plot at Girar Jerso in 2019 should be given consideration while performing selection for the improvement of grain yield in faba bean. On the other hand, the traits viz., internode length, plant height, number of pods per plant, number of seeds per pod, seed yield per plot, and thousand seed weight at Degem in 2018 and the traits viz., internode length, seed yield per plot, and thousand seed weight at Degem in 2019 should also be given consideration while performing selection for the improvement of grain yield in faba bean.
SUPPLEMENTARY MATERIALS
ACKNOWLEDGEMENTS
The authors are grateful to the EBI for providing faba bean landrace accessions; DbARC and HARC for providing released varieties.
-
CONFLICT OF INTEREST
We announce that there is no conflict of interest.
Fig. 1Map of Ethiopia showing the collection sites.
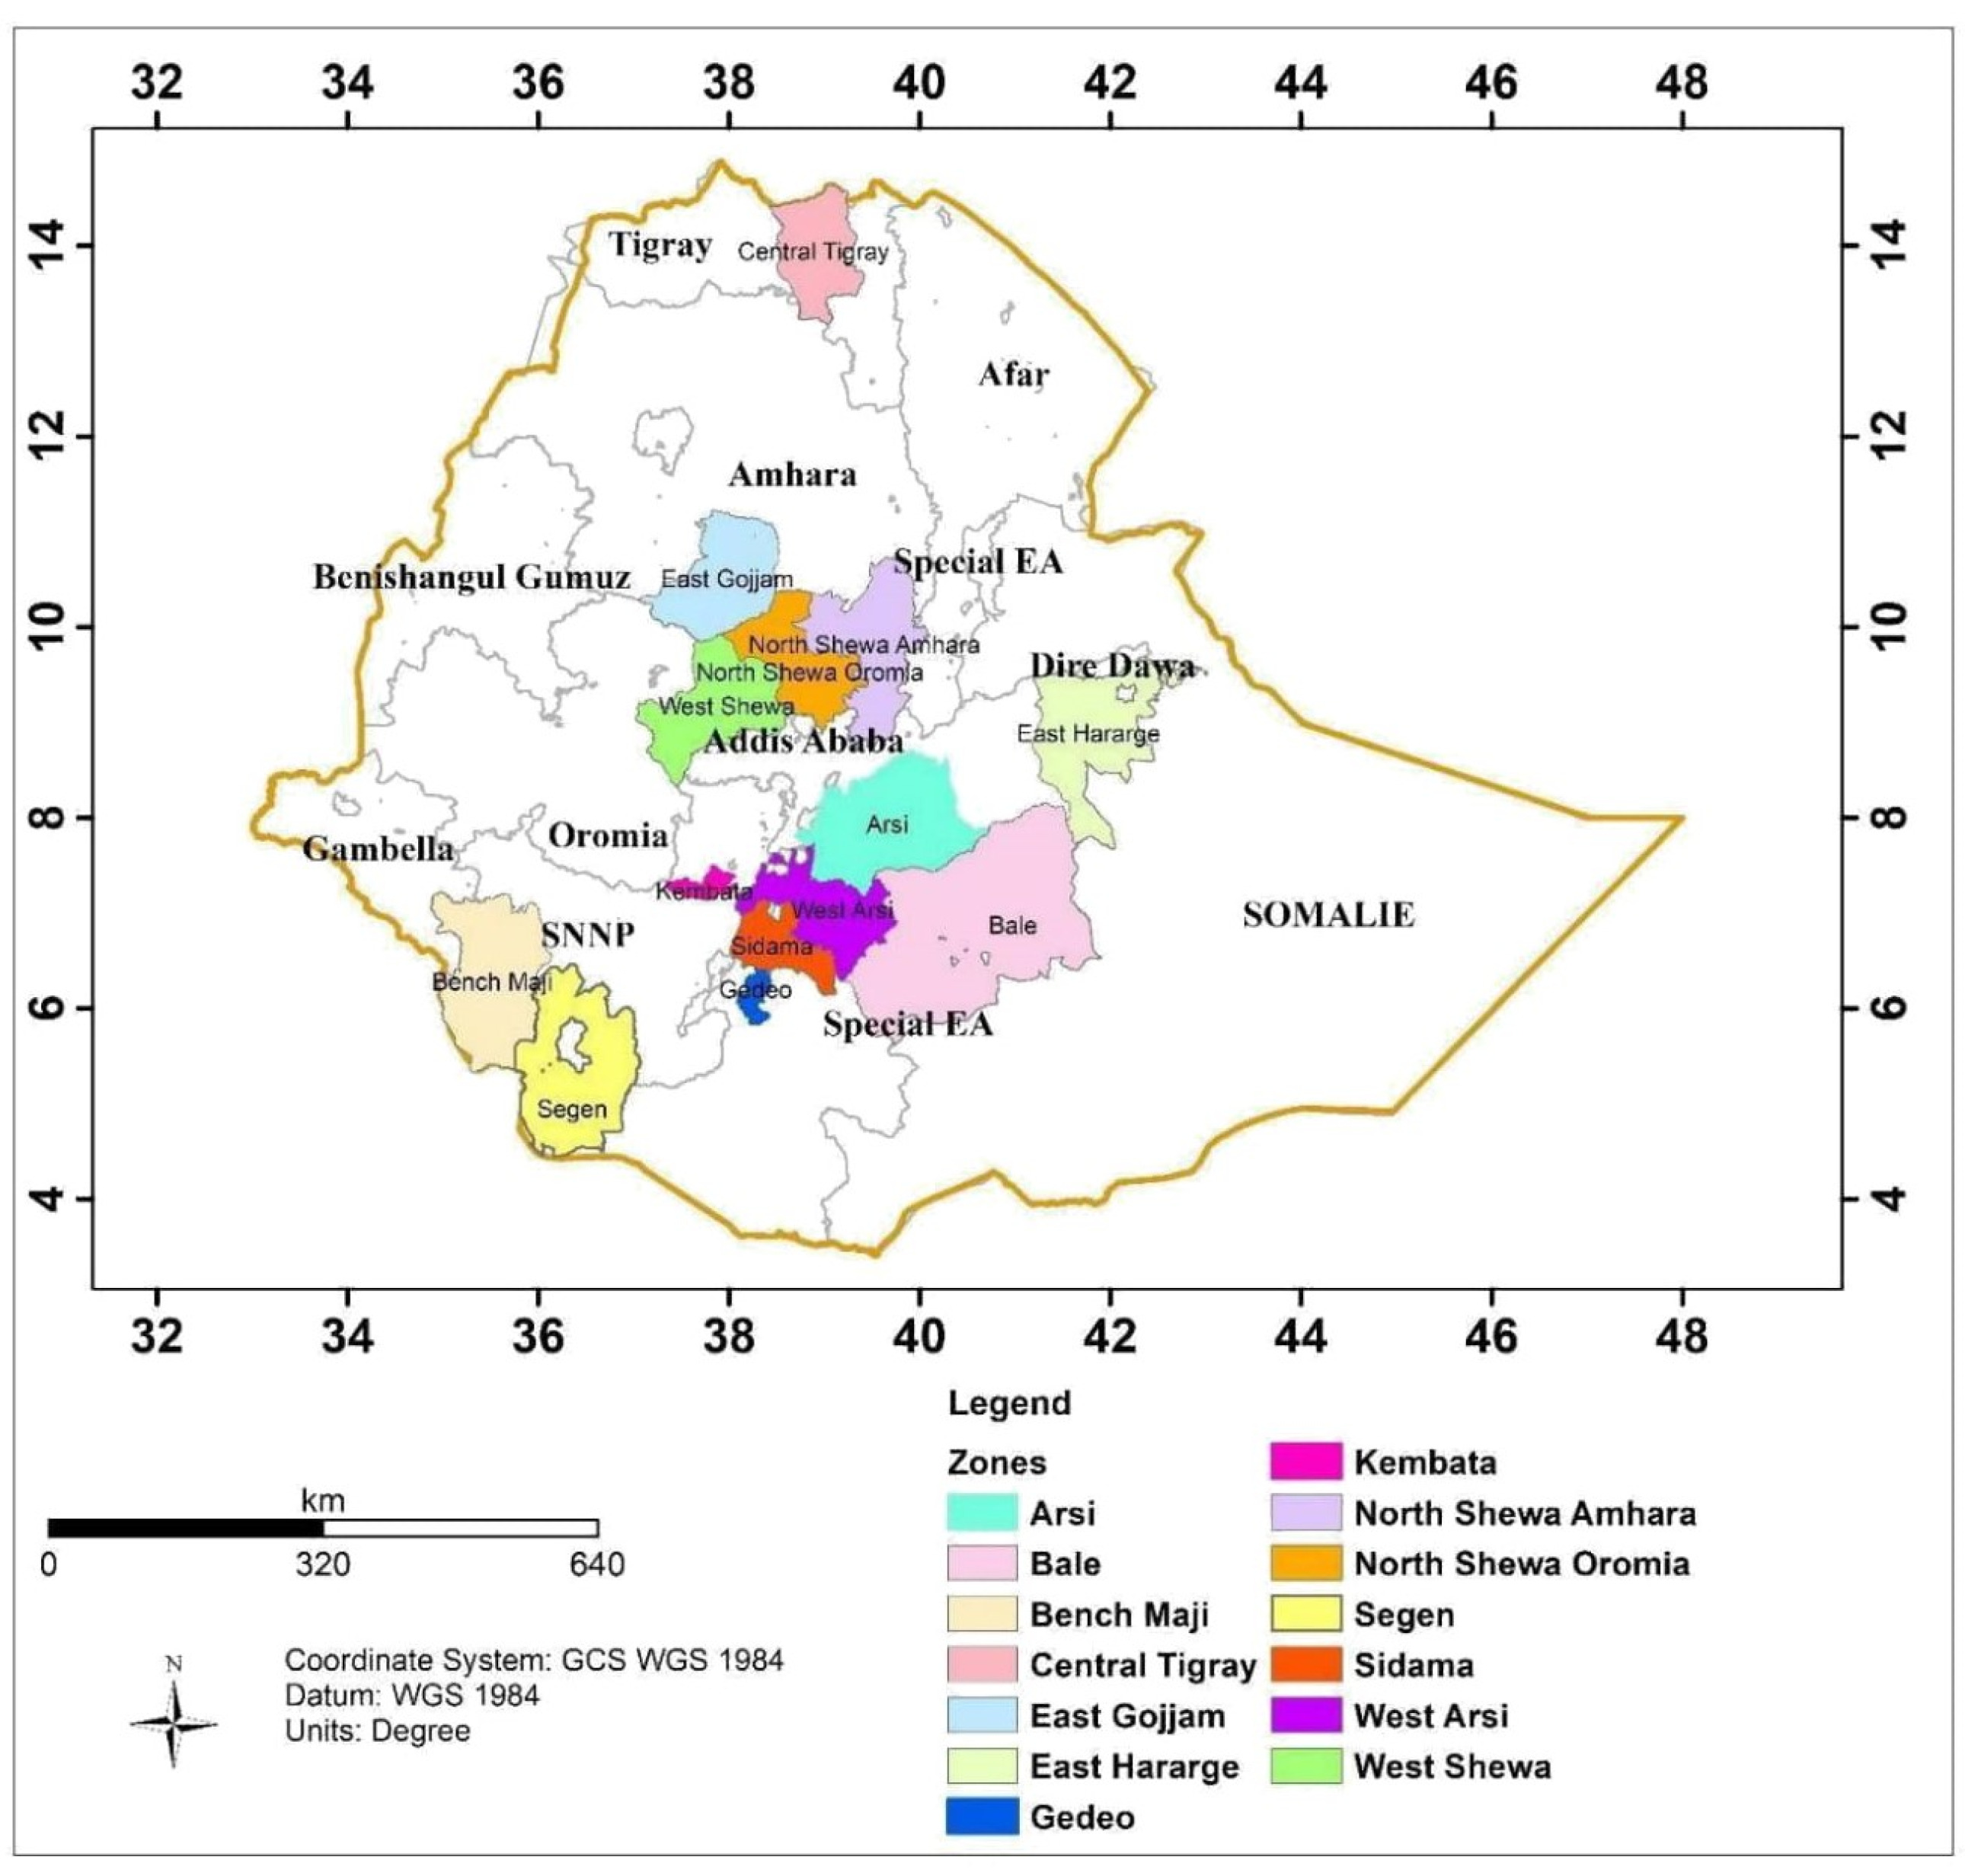
Table 1List of accessions and collection regions for the 90 faba bean (Vicia faba L.) accession and 6 released varieties.
Table 1
|
No. |
Region |
Administrative zone |
Accession |
No. |
Region |
Administrative zone |
Accession |
|
1 |
Amhara |
North Shewa A |
212580 |
49 |
Oromia |
East Hararghe |
29535 |
|
2 |
Amhara |
North Shewa A |
212572 |
50 |
Oromia |
East Hararghe |
29533 |
|
3 |
Amhara |
North Shewa A |
212567 |
51 |
Oromia |
East Hararghe |
29536 |
|
4 |
Amhara |
North Shewa A |
229299 |
52 |
Oromia |
West Shewa |
25270 |
|
5 |
Amhara |
North Shewa A |
212578 |
53 |
Oromia |
West Shewa |
25264 |
|
6 |
Amhara |
North Shewa A |
208114 |
54 |
Oromia |
West Shewa |
25260 |
|
7 |
Amhara |
North Shewa A |
208085 |
55 |
Oromia |
West Shewa |
25259 |
|
8 |
Amhara |
North Shewa A |
229310 |
56 |
Oromia |
West Shewa |
25274 |
|
9 |
Amhara |
North Shewa A |
212565 |
57 |
SNNPR |
Sidama |
28109 |
|
10 |
Amhara |
East Gojam |
25017 |
58 |
SNNPR |
Sidama |
28110 |
|
11 |
Amhara |
East Gojam |
27279 |
59 |
SNNPR |
Sidama |
28112 |
|
12 |
Amhara |
East Gojam |
229871 |
60 |
SNNPR |
Sidama |
28113 |
|
13 |
Amhara |
East Gojam |
26428 |
61 |
SNNPR |
Gedeo |
28104 |
|
14 |
Amhara |
East Gojam |
25006 |
62 |
SNNPR |
Gedeo |
26861 |
|
15 |
Amhara |
East Gojam |
229869 |
63 |
SNNPR |
Gedeo |
26883 |
|
16 |
Amhara |
East Gojam |
26400 |
64 |
SNNPR |
Gedeo |
26859 |
|
17 |
Oromia |
West Arsi |
30011 |
65 |
SNNPR |
Gedeo |
26882 |
|
18 |
Oromia |
West Arsi |
30008 |
66 |
SNNPR |
Gedeo |
26862 |
|
19 |
Oromia |
West Arsi |
30014 |
67 |
SNNPR |
Gedeo |
26885 |
|
20 |
Oromia |
West Arsi |
30016 |
68 |
SNNPR |
Gedeo |
26887 |
|
21 |
Oromia |
West Arsi |
30015 |
69 |
SNNPR |
Gedeo |
26886 |
|
22 |
Oromia |
West Arsi |
30017 |
70 |
SNNPR |
Gedeo |
28103 |
|
23 |
Oromia |
Arsi |
25009 |
71 |
SNNPR |
Gedeo |
26860 |
|
24 |
Oromia |
Arsi |
27052 |
72 |
SNNPR |
Segen |
26855 |
|
25 |
Oromia |
Arsi |
231293 |
73 |
SNNPR |
Segen |
26888 |
|
26 |
Oromia |
Arsi |
219089 |
74 |
SNNPR |
Segen |
26854 |
|
27 |
Oromia |
Arsi |
219355 |
75 |
SNNPR |
Segen |
26858 |
|
28 |
Oromia |
Bale |
30023 |
76 |
SNNPR |
Segen |
26889 |
|
29 |
Oromia |
Bale |
28777 |
77 |
SNNPR |
Segen |
26853 |
|
30 |
Oromia |
Bale |
30022 |
78 |
SNNPR |
Kembata |
25310 |
|
31 |
Oromia |
Bale |
28774 |
79 |
SNNPR |
Kembata |
25303 |
|
32 |
Oromia |
Bale |
28771 |
80 |
SNNPR |
Kembata |
25299 |
|
33 |
Oromia |
Bale |
28776 |
81 |
SNNPR |
Kembata |
25298 |
|
34 |
Oromia |
Bale |
28772 |
82 |
SNNPR |
Kembata |
25290 |
|
35 |
Oromia |
Bale |
30021 |
83 |
SNNPR |
Kembata |
25292 |
|
36 |
Oromia |
Bale |
28770 |
84 |
SNNPR |
Bench Maji |
27931 |
|
37 |
Oromia |
Bale |
28773 |
85 |
SNNPR |
Bench Maji |
235709 |
|
38 |
Oromia |
North Shewa O |
212566 |
86 |
SNNPR |
Bench Maji |
27929 |
|
39 |
Oromia |
North Shewa O |
25022 |
87 |
Tigray |
Central Tigray |
220079 |
|
40 |
Oromia |
North Shewa O |
25010 |
88 |
Tigray |
Central Tigray |
220076 |
|
41 |
Oromia |
North Shewa O |
25003 |
89 |
Tigray |
Central Tigray |
16599 |
|
42 |
Oromia |
North Shewa O |
25018 |
90 |
Tigray |
Central Tigray |
220086 |
|
43 |
Oromia |
North Shewa O |
229303 |
91 |
Released |
Released |
Bulga-70 |
|
44 |
Oromia |
East Hararghe |
29537 |
92 |
Released |
Released |
Lalo |
|
45 |
Oromia |
East Hararghe |
29531 |
93 |
Released |
Released |
Dagim |
|
46 |
Oromia |
East Hararghe |
29526 |
94 |
Released |
Released |
Walki |
|
47 |
Oromia |
East Hararghe |
29527 |
95 |
Released |
Released |
Moti |
|
48 |
Oromia |
East Hararghe |
29532 |
96 |
Released |
Released |
Hachalu |
Table 2Analysis of variance for nineteen traits of faba bean accessions tested at Girar Jerso district in 2018 and 2019 main cropping seasons.
Table 2
|
Trait |
Girar Jerso-2018 |
|
Girar Jerso-2019 |
|
Mean square |
Mean square |
|
Rep (1) |
Accession (95) |
Rep × block (6) |
Residuals (89) |
CV |
Rep (1) |
Accession (95) |
Rep × block (6) |
Residuals (89) |
CV |
|
LL |
2.98 |
1.33**
|
0.89 |
0.70 |
17.84 |
|
0.00 |
2.26***
|
0.96 |
0.23 |
8.69 |
|
LW |
1.06 |
0.44ns
|
0.57 |
0.35 |
25.28 |
|
0.01 |
0.74*
|
0.20 |
0.09 |
12.91 |
|
LA |
247.09 |
8.2*
|
11.37 |
5.31 |
28.94 |
|
0.01 |
26.20***
|
10.78 |
2.94 |
17.51 |
|
DTF |
13.02 |
9.09ns
|
5.17 |
6.58 |
5.17 |
|
0.52 |
15.27***
|
0.42 |
0.38 |
1.05 |
|
NPPN |
0.14 |
0.22*
|
0.18 |
0.14 |
27.11 |
|
0.00 |
0.13***
|
0.08 |
0.02 |
9.29 |
|
IL |
0.49 |
1.86***
|
0.75 |
0.80 |
31.87 |
|
0.41 |
3.03***
|
2.50 |
0.27 |
13.20 |
|
LPH |
52.40 |
56.33***
|
22.19 |
21.61 |
20.96 |
|
13.03 |
116.27***
|
42.69 |
11.12 |
9.47 |
|
PH |
1404.50 |
478.30***
|
168.10 |
104.70 |
20.56 |
|
190.50 |
1212.70***
|
1522.50 |
71.70 |
8.72 |
|
NPPPL |
75.00 |
23.04***
|
8.88 |
8.59 |
34.49 |
|
6.62 |
115.08***
|
14.04 |
8.72 |
21.61 |
|
NSPP |
0.03 |
0.47ns
|
0.31 |
0.46 |
32.93 |
|
0.01 |
0.22***
|
0.04 |
0.03 |
7.67 |
|
NBPPL |
0.26 |
0.47**
|
0.26 |
0.26 |
164.40 |
|
0.05 |
0.56***
|
0.21 |
0.10 |
66.76 |
|
PL |
0.74 |
1.92**
|
0.61 |
1.06 |
20.96 |
|
0.03 |
1.44***
|
0.29 |
0.13 |
6.57 |
|
PW |
1.74 |
0.67***
|
0.08 |
0.25 |
12.61 |
|
120.08 |
0.54**
|
0.53 |
0.33 |
20.78 |
|
NSPPL |
100.63 |
120.66***
|
14.25 |
32.39 |
26.43 |
|
0.40 |
664.10***
|
147.10 |
40 |
20.13 |
|
DM |
99.19 |
109.89***
|
10.3 |
21.05 |
3.68 |
|
10.08 |
266.46***
|
5.21 |
0.46 |
0.48 |
|
SFP |
234.08 |
76.9ns
|
12.95 |
59.77 |
10.31 |
|
0.52 |
256.97***
|
0.42 |
0.38 |
0.75 |
|
SYPP |
111 |
3319***
|
827 |
1136 |
45.56 |
|
33 |
5595***
|
21998 |
1431 |
28.43 |
|
TSW |
1789 |
15573***
|
3693 |
3255 |
12.40 |
|
2857 |
15411***
|
3498 |
3319 |
12.48 |
|
GY |
0.01 |
0.77***
|
0.19 |
0.15 |
35.10 |
|
0.12 |
0.82***
|
1.31 |
0.19 |
24.57 |
Table 3Analysis of variance for nineteen traits of faba bean accessions tested at Degem district in 2018 and 2019 main cropping seasons.
Table 3
|
Trait |
Degem-2018 |
|
Degem-2019 |
|
Mean square |
Mean square |
|
Rep (1) |
Accession (95) |
Rep × block (6) |
Residuals (89) |
CV |
Rep (1) |
Accession (95) |
Rep × block (6) |
Residuals (89) |
CV |
|
LL |
|
2.60*** |
0.02 |
0.01 |
1.61 |
|
27.64 |
2.59*** |
0.02 |
0.016 |
1.86 |
|
LW |
4.07 |
0.75*** |
0.00 |
0.00 |
1.76 |
|
3.71 |
0.75*** |
0.01 |
0.008 |
2.98 |
|
LA |
1.52 |
39.65*** |
0.00 |
0.00 |
0.33 |
|
1.28 |
39.52*** |
0.00 |
0 |
0.38 |
|
DTF |
5046 |
13*** |
1.00 |
1.00 |
1.33 |
|
5016 |
13*** |
1.00 |
1 |
1.37 |
|
NPPN |
0.93 |
0.15** |
0.12 |
0.09 |
19.54 |
|
6.26 |
0.22*** |
0.04 |
0.029 |
10.45 |
|
IL |
3.88 |
2.38* |
1.15 |
1.61 |
24.06 |
|
83.03 |
2.94*** |
1.22 |
0.51 |
12.34 |
|
LPH |
67.69 |
100.97* |
57.52 |
67.65 |
24.85 |
|
7587 |
186*** |
16 |
20 |
11.12 |
|
PH |
136.70 |
293.80* |
418.60 |
185.30 |
15.30 |
|
39820 |
551*** |
51 |
72 |
7.99 |
|
NPPPL |
94.92 |
42.71*** |
19.97 |
17.68 |
30.82 |
|
1652.50 |
68.30*** |
4.2 |
8.2 |
17.75 |
|
NSPP |
0.04 |
0.24* |
0.20 |
0.15 |
17.23 |
|
0.22 |
0.34*** |
0.06 |
0.0706 |
11.63 |
|
NBPPL |
0.00 |
0.62ns
|
0.52 |
0.44 |
78.48 |
|
3.26 |
0.69*** |
0.13 |
0.14 |
39.86 |
|
PL |
3.71 |
2.23*** |
0.17 |
1.12 |
17.65 |
|
4.87 |
2.68*** |
0.20 |
0.34 |
9.74 |
|
PW |
1.02 |
0.63** |
0.75 |
0.37 |
15.50 |
|
148.67 |
0.55*** |
0.10 |
0.2 |
14.25 |
|
NSPPL |
210.42 |
235.15*** |
57.07 |
82.66 |
30.04 |
|
6401 |
321*** |
47 |
34 |
16.59 |
|
DM |
24395 |
65*** |
4.00 |
3.00 |
1.13 |
|
24245 |
65*** |
4 |
3 |
1.13 |
|
SFP |
7292 |
78*** |
4.00 |
2.00 |
1.48 |
|
7256 |
78*** |
5 |
2 |
1.50 |
|
SYPP |
29552 |
3970*** |
1116 |
1568 |
27.85 |
|
31431 |
3120*** |
470 |
579 |
16.93 |
|
TSW |
1121462 |
25243*** |
1036 |
1394 |
6.82 |
|
1179376 |
27805*** |
532 |
1038 |
5.82 |
|
GY |
2.95 |
0.39** |
0.20 |
0.21 |
26.96 |
|
4.15 |
0.33*** |
0.04 |
0.07 |
14.95 |
Table 4Bartlett test of homogeneity of variances for each trait.
Table 4
|
Trait |
LL |
LW |
LA |
DTF |
NPPN |
IL |
LPH |
PH |
NPPPL |
NSPP |
NBPPL |
PL |
PW |
NSPPL |
DM |
SFP |
SYPP |
TSW |
GY |
|
K-squared |
7.08 |
0.12 |
43.65 |
182.92 |
37.46 |
12.82 |
81.50 |
63.63 |
88.45 |
87.44 |
11.91 |
29.75 |
64.16 |
108.93 |
45.92 |
23.91 |
31.45 |
52.54 |
44.38 |
|
df |
3 |
3 |
3 |
3 |
3 |
3 |
3 |
3 |
3 |
3 |
3 |
3 |
3 |
3 |
3 |
3 |
3 |
3 |
3 |
|
P-value |
0.07 |
0.99 |
0.00 |
0.00 |
0.00 |
0.01 |
0.00 |
0.00 |
0.00 |
0.00 |
0.01 |
0.00 |
0.00 |
0.00 |
0.00 |
0.00 |
0.00 |
0.00 |
0.00 |
Table 5Mean and ranges of the nineteen traits for faba bean accessions evaluated in the study.
Table 5
|
Trait |
Girar Jerso-2018 |
|
Girar Jerso-2019 |
|
Degem-2018 |
|
Degem-2019 |
|
Min. |
Mean |
Max. |
Min. |
Mean |
Max. |
Min. |
Mean |
Max. |
Min. |
Mean |
Max. |
|
LL |
3.14 |
4.68 |
6.82 |
|
3.00 |
5.47 |
8.57 |
|
4.45 |
6.79 |
9.33 |
|
4.55 |
6.82 |
9.30 |
|
LW |
1.34 |
2.34 |
3.37 |
|
1.15 |
2.28 |
4.74 |
|
1.79 |
3.02 |
4.52 |
|
1.80 |
3.03 |
4.50 |
|
LA |
4.20 |
7.99 |
14.92 |
|
3.84 |
9.71 |
20.19 |
|
5.83 |
13.91 |
24.54 |
|
5.88 |
13.94 |
24.00 |
|
DTF |
46.00 |
49.07 |
53.00 |
|
46.00 |
58.69 |
63.00 |
|
55.00 |
59.66 |
64.61 |
|
55.00 |
59.65 |
64.61 |
|
NPPN |
1.00 |
1.35 |
2.25 |
|
1.00 |
1.37 |
2.21 |
|
1.00 |
1.52 |
2.33 |
|
0.81 |
1.64 |
2.57 |
|
IL |
1.50 |
2.81 |
6.00 |
|
2.04 |
3.95 |
9.00 |
|
2.25 |
5.21 |
7.50 |
|
1.68 |
5.77 |
9.15 |
|
LPH |
15.00 |
22.14 |
37.19 |
|
14.50 |
35.03 |
59.00 |
|
19.50 |
33.04 |
53.00 |
|
18.68 |
39.87 |
65.50 |
|
PH |
32.00 |
50.50 |
104.5 |
|
38.00 |
97.55 |
142.00 |
|
63.50 |
90.47 |
118.00 |
|
51.48 |
105.48 |
141.50 |
|
NPPPL |
5.00 |
8.50 |
21.00 |
|
5.00 |
13.62 |
35.00 |
|
6.00 |
13.71 |
25.50 |
|
5.76 |
15.92 |
30.60 |
|
NSPP |
1.00 |
2.03 |
4.00 |
|
1.51 |
2.20 |
3.74 |
|
1.53 |
2.20 |
3.09 |
|
1.25 |
2.26 |
3.06 |
|
NBPPL |
0.00 |
31.00 |
1.50 |
|
0.00 |
0.48 |
2.00 |
|
0.00 |
0.84 |
2.00 |
|
0.00 |
0.93 |
2.00 |
|
PL |
3.30 |
4.85 |
6.90 |
|
2.82 |
5.58 |
8.82 |
|
3.50 |
5.82 |
9.00 |
|
2.57 |
5.91 |
9.22 |
|
PW |
2.95 |
3.84 |
4.80 |
|
1.10 |
2.71 |
3.65 |
|
1.90 |
3.97 |
5.50 |
|
1.05 |
3.07 |
5.00 |
|
NSPPL |
13.00 |
21.18 |
47.11 |
|
13.00 |
31.32 |
83.00 |
|
14.00 |
30.05 |
60.50 |
|
15.44 |
34.62 |
65.15 |
|
DM |
109.00 |
122.66 |
139.00 |
|
121.00 |
141.88 |
153.00 |
|
138.2 |
153.81 |
161.00 |
|
138.0 |
153.74 |
161.00 |
|
SFP |
58.00 |
73.22 |
88.00 |
|
60.00 |
82.66 |
95.00 |
|
73.83 |
94.16 |
104.00 |
|
73.83 |
94.08 |
103.80 |
|
SYPP |
26.00 |
72.83 |
193.00 |
|
45.00 |
134.11 |
235.00 |
|
53.00 |
141.27 |
258.00 |
|
58.00 |
141.30 |
250.00 |
|
TSW |
273.50 |
462.30 |
715.50 |
|
320.00 |
462.61 |
719.00 |
|
354.0 |
543.66 |
873.00 |
|
354.00 |
545.04 |
896.57 |
|
GY |
0.29 |
1.09 |
2.50 |
|
0.66 |
1.79 |
3.00 |
|
0.64 |
1.69 |
3.00 |
|
0.64 |
1.71 |
3.00 |
Table 6Phenotypic variance, genotypic variance, phenotypic coefficient of variation, genotypic coefficient of variation, heritability in broad-sense, genetic advance and genetic advance as percent of mean of Ethiopian faba bean accessions at Girar Jerso in 2018 and 2019 main cropping season.
Table 6
|
Traits |
Girar-2018 |
|
Girar-2019 |
|
σ2p
|
σ2g
|
PCV (%) |
GCV (%) |
Hb2 (%) |
GA |
GAM % |
σ2p
|
σ2g
|
PCV (%) |
GCV (%) |
Hb2 (%) |
GA |
GAM % |
|
LL |
1.00 |
0.31 |
21.48 |
11.96 |
31.01 |
0.64 |
13.72 |
|
1.10 |
0.87 |
19.17 |
17.08 |
79.42 |
1.72 |
31.36 |
|
LW |
|
|
|
|
|
|
|
|
0.39 |
0.30 |
27.54 |
24.33 |
78.05 |
0.99 |
44.29 |
|
LA |
6.53 |
1.29 |
32.32 |
14.39 |
19.81 |
1.04 |
13.19 |
|
12.93 |
10.03 |
37.01 |
32.61 |
77.61 |
5.75 |
59.18 |
|
DTF |
|
|
|
|
|
|
|
|
7.82 |
7.44 |
4.77 |
4.65 |
95.11 |
5.48 |
9.34 |
|
NPPN |
0.17 |
0.04 |
30.91 |
14.85 |
23.10 |
0.20 |
14.70 |
|
0.07 |
0.05 |
19.10 |
16.69 |
76.34 |
0.41 |
30.04 |
|
IL |
1.31 |
0.52 |
41.08 |
25.92 |
39.81 |
0.94 |
33.69 |
|
1.36 |
1.09 |
29.61 |
26.51 |
80.14 |
1.93 |
48.89 |
|
LPH |
38.39 |
17.09 |
28.14 |
18.77 |
44.51 |
5.68 |
25.80 |
|
58.98 |
47.97 |
21.93 |
19.77 |
81.33 |
12.87 |
36.73 |
|
PH |
289.56 |
183.89 |
34.04 |
27.13 |
63.51 |
22.26 |
44.53 |
|
448.41 |
376.10 |
21.71 |
19.88 |
83.87 |
36.59 |
37.51 |
|
NPPPL |
15.75 |
7.19 |
46.78 |
31.60 |
45.65 |
3.73 |
43.99 |
|
57.96 |
49.30 |
55.90 |
51.55 |
85.06 |
13.34 |
97.95 |
|
NSPP |
|
|
|
|
|
|
|
|
0.13 |
0.10 |
15.55 |
13.53 |
75.69 |
0.56 |
24.25 |
|
NBPPL |
0.36 |
0.11 |
195.56 |
105.91 |
29.33 |
0.36 |
118.16 |
|
0.29 |
0.18 |
110.96 |
88.63 |
63.80 |
0.71 |
145.83 |
|
PL |
1.47 |
0.45 |
25.11 |
13.83 |
30.32 |
0.76 |
15.69 |
|
0.78 |
0.64 |
15.80 |
14.37 |
82.69 |
1.50 |
26.91 |
|
PW |
0.45 |
0.22 |
17.45 |
12.07 |
47.79 |
0.66 |
17.18 |
|
0.41 |
0.10 |
23.72 |
11.42 |
23.20 |
0.31 |
11.34 |
|
NSPPL |
75.95 |
44.71 |
41.20 |
31.61 |
58.87 |
10.57 |
49.97 |
|
307.18 |
267.42 |
55.96 |
52.22 |
87.06 |
31.43 |
100.36 |
|
DM |
65.13 |
44.76 |
6.59 |
5.46 |
68.73 |
11.43 |
9.33 |
|
133.38 |
132.92 |
8.14 |
8.13 |
99.66 |
23.71 |
16.71 |
|
SFP |
|
|
|
|
|
|
|
|
128.60 |
128.22 |
13.72 |
13.70 |
99.70 |
23.29 |
28.18 |
|
SYPP |
2182.73 |
1076.23 |
63.99 |
44.93 |
49.31 |
47.45 |
64.99 |
|
2108.29 |
654.30 |
34.24 |
19.07 |
31.03 |
29.35 |
21.89 |
|
TSW |
9427.53 |
6145.10 |
21.02 |
16.97 |
65.18 |
130.38 |
28.22 |
|
9371.03 |
6040.40 |
20.93 |
17.08 |
64.46 |
128.54 |
27.79 |
|
GY |
0.46 |
0.31 |
62.12 |
51.25 |
68.06 |
0.95 |
87.09 |
|
0.38 |
0.18 |
34.15 |
24.33 |
48.24 |
0.61 |
33.94 |
Table 7Phenotypic variance, genotypic variance, phenotypic coefficient of variation, genotypic coefficient of variation, heritability in broad-sense, genetic advance and genetic advance as percent of mean of Ethiopian faba bean accessions at Degem in 2018 and 2019 main cropping season.
Table 7
|
Traits |
Degem-2018 |
|
Degem-2019 |
|
σ2p
|
σ2g
|
PCV (%) |
GCV (%) |
Hb2 (%) |
GA |
GAM % |
σ2p
|
σ2g
|
PCV (%) |
GCV (%) |
Hb2 (%) |
GA |
GAM % |
|
LL |
1.31 |
1.29 |
16.80 |
16.73 |
99.08 |
2.93 |
43.07 |
|
1.30 |
1.29 |
16.75 |
16.65 |
98.77 |
2.32 |
34.08 |
|
LW |
0.38 |
0.37 |
20.36 |
20.28 |
99.25 |
2.93 |
97.23 |
|
0.38 |
0.37 |
20.37 |
20.15 |
97.86 |
1.24 |
41.06 |
|
LA |
19.83 |
19.83 |
31.98 |
31.98 |
99.99 |
2.96 |
21.23 |
|
19.77 |
19.76 |
31.93 |
31.93 |
99.99 |
9.16 |
65.78 |
|
DTF |
6.61 |
5.97 |
4.31 |
4.10 |
90.42 |
2.67 |
4.48 |
|
6.63 |
5.96 |
4.32 |
4.09 |
89.87 |
4.77 |
7.99 |
|
NPPN |
0.12 |
0.03 |
22.47 |
11.09 |
24.35 |
0.72 |
47.51 |
|
0.13 |
0.10 |
21.72 |
19.03 |
76.83 |
0.56 |
34.37 |
|
IL |
1.82 |
0.25 |
25.90 |
9.59 |
13.72 |
0.41 |
7.78 |
|
1.61 |
1.11 |
22.03 |
18.25 |
68.62 |
1.80 |
31.14 |
|
LPH |
83.99 |
16.98 |
27.82 |
12.51 |
20.22 |
0.60 |
1.81 |
|
102.80 |
83.13 |
25.43 |
22.87 |
80.87 |
16.89 |
42.37 |
|
PH |
241.24 |
50.72 |
17.22 |
7.89 |
21.03 |
0.62 |
0.69 |
|
310.91 |
239.93 |
16.72 |
14.69 |
77.17 |
28.03 |
26.58 |
|
NPPPL |
30.16 |
12.48 |
40.25 |
25.88 |
41.36 |
1.22 |
8.96 |
|
38.14 |
30.15 |
38.79 |
34.49 |
79.06 |
10.06 |
63.18 |
|
NSPP |
0.18 |
0.04 |
19.28 |
8.66 |
20.17 |
0.60 |
27.14 |
|
0.19 |
0.12 |
19.22 |
15.30 |
63.37 |
0.57 |
25.09 |
|
NBPPL |
0.50 |
0.08 |
85.18 |
33.12 |
15.11 |
0.45 |
53.63 |
|
0.41 |
0.27 |
68.74 |
55.99 |
66.36 |
0.88 |
93.97 |
|
PL |
1.65 |
0.59 |
22.02 |
13.16 |
35.74 |
1.06 |
18.14 |
|
1.50 |
1.17 |
20.73 |
18.30 |
77.93 |
1.97 |
33.27 |
|
PW |
0.50 |
0.12 |
17.84 |
8.83 |
24.49 |
0.72 |
18.19 |
|
0.37 |
0.18 |
19.78 |
13.71 |
48.07 |
0.60 |
19.59 |
|
NSPPL |
156.81 |
76.37 |
41.94 |
29.27 |
48.70 |
1.44 |
4.82 |
|
174.26 |
141.27 |
38.13 |
34.33 |
81.07 |
22.04 |
63.68 |
|
DM |
33.97 |
30.98 |
3.79 |
3.62 |
91.17 |
2.70 |
1.75 |
|
33.97 |
30.96 |
3.79 |
3.62 |
91.14 |
10.94 |
7.12 |
|
SFP |
40.24 |
38.25 |
6.74 |
6.57 |
95.05 |
2.81 |
2.99 |
|
40.17 |
38.18 |
6.74 |
6.57 |
95.03 |
12.41 |
13.19 |
|
SYPP |
2754.90 |
1215.21 |
37.25 |
24.74 |
44.11 |
1.30 |
0.93 |
|
1845.88 |
1273.86 |
30.41 |
25.26 |
69.01 |
61.08 |
43.23 |
|
TSW |
13306.88 |
11935.81 |
21.24 |
20.12 |
89.70 |
2.65 |
0.49 |
|
14405.54 |
13399.54 |
22.02 |
21.24 |
93.02 |
229.98 |
42.20 |
|
GY |
0.30 |
0.09 |
32.41 |
17.98 |
30.77 |
0.91 |
54.03 |
|
0.20 |
0.13 |
26.02 |
21.30 |
66.99 |
0.61 |
35.91 |
Table 8Estimates of correlation coefficients at genotypic (below diagonal) and phenotypic (above diagonal) levels among 19 traits of faba bean accessions at Girar Jerso in 2018 main cropping season.
Table 8
|
Trait |
LL |
LW |
LA |
DTF |
NPPN |
IL |
LPH |
PH |
NPPPL |
NSPP |
NBPPL |
PL |
PW |
NSPPL |
DM |
SFP |
SYPP |
TSW |
GY |
|
LL |
|
0.70** |
0.91** |
0.18ns
|
0.17ns
|
0.42** |
0.54** |
0.68** |
0.34** |
0.17ns
|
0.32** |
0.49** |
‒0.12ns
|
0.39** |
0.48** |
0.53** |
0.19ns
|
0.29** |
0.07ns
|
|
LW |
0.97** |
|
0.82** |
0.12ns
|
0.1ns
|
0.23* |
0.42** |
0.39** |
0.258ns
|
0.04ns
|
0.24* |
0.30** |
0.13ns
|
0.28** |
0.32** |
0.35** |
0.09ns
|
0.24* |
0.03ns
|
|
LA |
1.00** |
1.00** |
|
0.19ns
|
0.15ns
|
0.36** |
0.48** |
0.58** |
0.34** |
0.1ns
|
0.29** |
0.36** |
‒0.08ns
|
0.35** |
0.41** |
0.43** |
0.14ns
|
0.22* |
0.04ns
|
|
DTF |
0.55** |
0.15ns
|
0.49** |
|
0.21ns
|
0.46** |
0.37** |
0.44** |
0.18ns
|
‒0.17ns
|
0.21* |
0.04ns
|
‒0.18ns
|
0.19ns
|
0.41** |
0.17ns
|
0.12ns
|
0.03ns
|
0.07ns
|
|
NPPN |
0.07ns
|
‒0.38** |
‒0.1ns
|
0.1ns
|
|
0.09ns
|
0.38** |
0.29** |
0.36** |
‒0.03ns
|
0.19ns
|
0.05ns
|
‒0.02ns
|
0.34** |
0.1ns
|
0.14ns
|
0.08ns
|
0.02ns
|
0.02ns
|
|
IL |
0.66** |
0.65** |
0.80** |
1.00** |
0.08ns
|
|
0.51** |
0.68** |
0.35** |
0.16ns
|
0.27** |
0.41** |
‒0.04ns
|
0.38** |
0.49** |
0.34** |
0.22* |
0.24* |
0.15ns
|
|
LPH |
0.69** |
0.83** |
0.71** |
0.90** |
0.41** |
0.71** |
|
0.75** |
0.39** |
0.12ns
|
0.34** |
0.45** |
0.05ns
|
0.34** |
0.49** |
0.53** |
0.25* |
0.28** |
0.19ns
|
|
PH |
0.82** |
0.65** |
0.79** |
1.00** |
0.22* |
0.88** |
0.90** |
|
0.56** |
0.24* |
0.49** |
0.55** |
‒0.1ns
|
0.55** |
0.51** |
0.49** |
0.32** |
0.35** |
0.18ns
|
|
NPPPL |
0.25* |
0.22* |
0.23* |
0.60** |
0.32** |
0.57** |
0.53** |
0.57** |
|
0.03ns
|
0.44** |
0.28** |
‒0.02ns
|
0.79** |
0.20* |
0.20* |
0.25* |
0.13ns
|
0.20* |
|
NSPP |
0.94** |
‒0.23* |
0.44** |
-
1.00** |
-
0.38** |
0.34** |
0.39** |
0.60** |
0.28** |
|
0.05ns
|
0.47** |
0.04ns
|
0.14ns
|
‒0.06ns
|
0.03ns
|
0.12ns
|
0.19ns
|
0.11ns
|
|
NBPPL |
0.59** |
0.46** |
0.61** |
1.00** |
0.51** |
0.34** |
0.58** |
0.72** |
0.74** |
‒0.25* |
|
0.32** |
0.22* |
0.52** |
0.16ns
|
0.15ns
|
0.18ns
|
0.21* |
0.21* |
|
PL |
0.86** |
0.81** |
0.80** |
0.20* |
‒0.06ns
|
0.48** |
0.75** |
0.69** |
0.34** |
1.00** |
0.56** |
|
0.26* |
0.35** |
0.35** |
0.32** |
0.17ns
|
0.56** |
0.14ns
|
|
PW |
‒0.32** |
0.21* |
‒0.20* |
-
0.50** |
‒0.08ns
|
-
0.28** |
0.02ns
|
‒0.23* |
‒0.06 |
‒0.16ns
|
0.2ns
|
0.19ns
|
|
‒0.03ns
|
‒0.1ns
|
‒0.08ns
|
0.01ns
|
0.06ns
|
0.08ns
|
|
NSPPL |
0.35** |
0.30** |
0.30** |
0.60** |
0.32** |
0.43** |
0.44** |
0.54** |
0.82** |
0.09ns
|
0.77** |
0.37** |
‒0.11ns
|
|
0.14ns
|
0.13ns
|
0.29** |
0.18ns
|
0.24* |
|
DM |
0.80** |
0.85** |
0.81** |
1.00** |
0.26* |
0.66** |
0.64** |
0.60** |
0.28** |
‒0.68** |
0.11ns
|
0.49** |
‒0.19ns
|
0.09ns
|
|
0.79** |
0.22* |
0.17ns
|
0.13ns
|
|
SFP |
1.00** |
1.00** |
1.00** |
1.00** |
0.89** |
0.85** |
1.00** |
1.00** |
0.77** |
‒0.44** |
0.32** |
0.87** |
‒0.34** |
0.26** |
1.00** |
|
0.19ns
|
0.17ns
|
0.08ns
|
|
SYPP |
0.16ns
|
0.11ns
|
0.17ns
|
0.40** |
‒0.06ns
|
0.31** |
0.39** |
0.32** |
0.30** |
0.20* |
0.24* |
0.2ns
|
0.03ns
|
0.26* |
0.26* |
0.47** |
|
0.07ns
|
0.74** |
|
TSW |
0.39** |
0.42** |
0.26* |
0.20* |
‒0.09ns
|
0.34** |
0.37** |
0.47** |
0.20* |
1.00** |
0.30** |
0.99** |
0.13ns
|
0.24* |
0.19ns
|
0.32** |
0.08ns
|
|
0.07ns
|
|
GY |
0.03ns
|
‒0.02ns
|
0ns
|
0.20* |
‒0.06ns
|
0.23* |
0.30** |
0.16ns
|
0.23* |
0.23* |
0.30** |
0.14ns
|
0.11ns
|
0.20* |
0.14ns
|
0.15ns
|
0.69** |
0.09ns
|
|
Table 9Estimates of correlation coefficients at genotypic (below diagonal) and phenotypic (above diagonal) levels among 19 traits of faba bean accessions at Girar Jerso in 2019 main cropping season.
Table 9
|
Trait |
LL |
LW |
LA |
DTF |
NPPN |
IL |
LPH |
PH |
NPPPL |
NSPP |
NBPPL |
PL |
PW |
NSPPL |
DM |
SFP |
SYPP |
TSW |
GY |
|
LL |
|
0.63** |
0.88** |
0.15ns
|
0.28** |
0.49** |
0.46** |
0.64** |
0.42** |
0.09ns
|
0.34** |
0.50** |
0.26* |
0.42** |
0.42** |
0.42** |
0.45** |
0.30** |
0.38** |
|
LW |
0.63** |
|
0.90** |
‒0.03ns
|
0.37** |
0.28** |
0.37** |
0.39** |
0.33** |
0.05ns
|
0.21ns
|
0.37* |
0.28** |
0.33** |
0.33** |
0.38** |
0.31** |
0.33** |
0.28** |
|
LA |
0.89** |
0.90** |
|
0.06ns
|
0.36** |
0.41** |
0.47** |
0.55** |
0.40** |
0.03ns
|
0.32** |
0.46** |
0.26* |
0.41** |
0.40** |
0.43** |
0.42** |
0.35** |
0.37** |
|
DTF |
0.17ns
|
‒0.03ns
|
0.07ns
|
|
‒0.06ns
|
0.00ns
|
0.12ns
|
0.22* |
0.15ns
|
‒0.13ns
|
0.04ns
|
‒0.03ns
|
‒0.17ns
|
0.14ns
|
0.22* |
0.11ns
|
‒0.07ns
|
‒0.11ns
|
0.04ns
|
|
NPPN |
0.27** |
0.36** |
0.35** |
‒0.05ns
|
|
0.24* |
0.24* |
0.35** |
0.45** |
0.09ns
|
0.05ns
|
0.06ns
|
0.09ns
|
0.45** |
0.13ns
|
0.16ns
|
0.28** |
‒0.01ns
|
0.13ns
|
|
IL |
0.51** |
0.29** |
0.44** |
0.02ns
|
0.21* |
|
0.56** |
0.56** |
0.38** |
0.04ns
|
0.42** |
0.24* |
0.1ns
|
0.42** |
0.27** |
0.31** |
0.17ns
|
0.14ns
|
0.13ns
|
|
LPH |
0.44** |
0.36** |
0.46** |
0.13ns
|
0.21* |
0.57** |
|
0.64** |
0.41** |
0.01ns
|
0.27** |
0.27** |
0.14ns
|
0.43** |
0.24* |
0.22* |
0.29** |
0.17ns
|
0.23* |
|
PH |
0.65** |
0.36** |
0.55** |
0.26* |
0.30** |
0.55** |
0.63** |
|
0.73** |
0.1ns
|
0.46** |
0.26* |
‒0.07ns
|
0.75** |
0.29** |
0.28** |
0.49** |
0.01ns
|
0.40** |
|
NPPPL |
0.43** |
0.28** |
0.38** |
0.15ns
|
0.41** |
0.35** |
0.41** |
0.78** |
|
0.08ns
|
0.55** |
0.11ns
|
‒0.11ns
|
0.89** |
0.1ns
|
0.11ns
|
0.45** |
‒0.03ns
|
0.37** |
|
NSPP |
0.11ns
|
0.07ns
|
0.05ns
|
‒0.12ns
|
0.13ns
|
0.03ns
|
0ns
|
0.11ns
|
0.14ns
|
|
0.03ns
|
0.27** |
0.28** |
0.17ns
|
0.05ns
|
0.05ns
|
0.16ns
|
0.01ns
|
0.22* |
|
NBPPL |
0.38** |
0.21* |
0.34** |
0.1ns
|
‒0.01ns
|
0.46** |
0.25* |
0.48** |
0.54** |
0.09ns
|
|
0.14ns
|
‒0.25* |
0.53** |
‒0.05ns
|
‒0.01ns
|
0.38** |
0.09ns
|
0.37** |
|
PL |
0.54** |
0.39** |
0.50** |
‒0.03ns
|
0.04ns
|
0.23* |
0.25* |
0.24* |
0.1ns
|
0.27** |
0.19ns
|
|
0.38** |
0.19ns
|
0.44** |
0.44** |
0.24* |
0.47** |
0.27** |
|
PW |
0.47** |
0.54** |
0.51** |
‒0.27** |
0.14ns
|
0.19ns
|
0.22* |
‒0.08ns
|
‒0.16ns
|
0.45** |
‒0.42** |
0.60** |
|
‒0.1ns
|
0.40** |
0.40** |
‒0.05ns
|
0.35** |
‒0.01ns
|
|
NSPPL |
0.39** |
0.27** |
0.36** |
0.17ns
|
0.42** |
0.38** |
0.42** |
0.77** |
0.91** |
0.21* |
0.55** |
0.18ns
|
‒0.16ns
|
|
0.14ns
|
0.14ns
|
0.43** |
‒0.04ns
|
0.39** |
|
DM |
0.46** |
0.38** |
0.46** |
0.23* |
0.16ns
|
0.32** |
0.27** |
0.34** |
0.13ns
|
0.07ns
|
0.03ns
|
0.47** |
0.62** |
0.17ns
|
|
0.97** |
0.02ns
|
0.33** |
0.05ns
|
|
SFP |
0.47** |
0.43** |
0.49** |
0.12ns
|
0.19ns
|
0.35** |
0.25* |
0.32** |
0.14ns
|
0.06ns
|
0.07ns
|
0.46** |
0.61** |
0.18ns
|
0.97** |
|
0.04ns
|
0.36** |
0.05ns
|
|
SYPP |
0.69** |
0.49** |
0.64** |
‒0.08ns
|
0.44** |
0.30** |
0.44** |
0.66** |
0.45** |
0.45** |
0.49** |
0.41** |
0.47** |
0.50** |
0.1ns
|
0.11ns
|
|
0.07ns
|
0.77** |
|
TSW |
0.42** |
0.41** |
0.47** |
‒0.12ns
|
0.03ns
|
0.19ns
|
0.28** |
0.07ns
|
0ns
|
‒0.05ns
|
0.17ns
|
0.53** |
0.58** |
‒0.02ns
|
0.37** |
0.40** |
0.22* |
|
0.05ns
|
|
GY |
0.52** |
0.35** |
0.48** |
0.06ns
|
0.2ns
|
0.18ns
|
0.31** |
0.49** |
0.34** |
0.44** |
0.34** |
0.39** |
0.34** |
0.42** |
0.12ns
|
0.11ns
|
0.82** |
0.14ns
|
|
Table 10Estimates of correlation coefficients at genotypic (below diagonal) and phenotypic (above diagonal) levels among 19 traits of faba bean accessions at Degem in 2018 main cropping season.
Table 10
|
Trait |
LL |
LW |
LA |
DTF |
NPPN |
IL |
LPH |
PH |
NPPPL |
NSPP |
NBPPL |
PL |
PW |
NSPPL |
DM |
SFP |
SYPP |
TSW |
GY |
|
LL |
|
0.79** |
0.93** |
‒0.09ns
|
0.07ns
|
0.13ns
|
‒0.06ns
|
0.12ns
|
0.32** |
‒0.07ns
|
0.12ns
|
‒0.06ns
|
‒0.1ns
|
0.18ns
|
0.05ns
|
0.09ns
|
0.25* |
‒0.01ns
|
0.25* |
|
LW |
0.79** |
|
0.95** |
‒0.01ns
|
0.08ns
|
0.01ns
|
‒0.09ns
|
0.06ns
|
0.34** |
‒0.22* |
0.10ns
|
‒0.1ns
|
‒0.05ns
|
0.24* |
0.06ns
|
0.08ns
|
0.18ns
|
‒0.06ns
|
0.14ns
|
|
LA |
0.93** |
0.95** |
|
‒0.03ns
|
0.11ns
|
0.07ns
|
‒0.08ns
|
0.11ns
|
0.38** |
‒0.16ns
|
0.10ns
|
‒0.09ns
|
‒0.13ns
|
0.25* |
0.05ns
|
0.07ns
|
0.23* |
‒0.07ns
|
0.21* |
|
DTF |
‒0.10ns
|
‒0.01ns
|
‒0.04ns
|
|
0.06ns
|
‒0.09ns
|
0.07ns
|
0.09ns
|
‒0.02ns
|
‒0.14ns
|
‒0.11ns
|
0.09ns
|
‒0.01ns
|
‒0.14ns
|
‒0.03ns
|
‒0.41** |
‒0.19ns
|
0.01ns
|
‒0.09ns
|
|
NPPN |
0.08ns
|
0.12ns
|
0.15ns
|
0.08ns
|
|
‒0.03ns
|
0.24* |
0.17ns
|
0.54** |
‒0.38** |
‒0.02ns
|
‒0.31** |
‒0.17ns
|
0.37** |
‒0.01ns
|
‒0.04ns
|
0.04ns
|
‒0.37** |
‒0.01ns
|
|
IL |
0.26* |
0.01ns
|
0.17ns
|
‒0.15ns
|
0.01ns
|
|
‒0.10ns
|
0.15ns
|
0.10ns
|
0.04ns
|
0.18ns
|
0.31** |
0.15ns
|
‒0.03ns
|
‒0.05ns
|
‒0.02ns
|
0.20ns
|
0.20ns
|
0.15ns
|
|
LPH |
‒0.13ns
|
‒0.16ns
|
‒0.16ns
|
0.17ns
|
0.21* |
‒0.00ns
|
|
0.48** |
0.08ns
|
‒0.01ns
|
‒0.23* |
0.06ns
|
0.31** |
0.01ns
|
0.23* |
0.17ns
|
0.15ns
|
0.16ns
|
0.03ns
|
|
PH |
0.20* |
0.10ns
|
0.19ns
|
0.21* |
0.13ns
|
0.12ns
|
0.52** |
|
0.36** |
0.03ns
|
‒0.05ns
|
0.28** |
0.22* |
0.31** |
0.26* |
0.19ns
|
0.43** |
0.25* |
0.36** |
|
NPPPL |
0.41** |
0.45** |
0.48** |
‒0.03ns
|
0.80** |
0.09ns
|
0.30** |
0.42** |
|
‒0.27** |
0.29** |
‒0.17ns
|
‒0.09ns
|
0.77** |
0.07ns
|
0.07ns
|
0.28** |
‒0.25* |
0.18ns
|
|
NSPP |
‒0.06ns
|
‒0.35** |
‒0.23* |
‒0.31** |
‒0.43** |
0.62** |
‒0.08ns
|
‒0.16ns
|
‒0.26* |
|
0.17ns
|
0.34** |
0.03ns
|
0.17ns
|
0.01ns
|
0.08ns
|
0.17ns
|
0.10ns
|
0.14ns
|
|
NBPPL |
0.23* |
0.22* |
0.24* |
‒0.13ns
|
‒0.30** |
0.45** |
‒0.20* |
‒0.20* |
0.28** |
0.99** |
|
0.18ns
|
0.01ns
|
0.35** |
0.07ns
|
0.10ns
|
0.22* |
0.09ns
|
0.11ns
|
|
PL |
‒0.07ns
|
‒0.11ns
|
‒0.11ns
|
0.06ns
|
‒0.83** |
0.91** |
0.07ns
|
0.27** |
‒0.45** |
0.78** |
0.58** |
|
0.26** |
‒0.07ns
|
0.10ns
|
0.07ns
|
0.18ns
|
0.58** |
0.15ns
|
|
PW |
‒0.14ns
|
‒0.04ns
|
‒0.19ns
|
0.05ans
|
‒0.76** |
0.43** |
0.50** |
‒0.06ns
|
‒0.36** |
0.34** |
‒0.31** |
0.39** |
|
‒0.17ns
|
0.17ns
|
0.18ns
|
0.17ns
|
0.47** |
0.08ns
|
|
NSPPL |
0.21* |
0.29** |
0.29** |
‒0.11ns
|
0.53** |
‒0.09ns
|
0.06ns
|
0.27** |
0.85ns
|
0.04** |
0.62** |
‒0.37** |
‒0.42** |
|
0.05ns
|
0.09ns
|
0.37** |
‒0.26** |
0.20* |
|
DM |
0.06ns
|
0.07ns
|
0.05ns
|
‒0.08ns
|
‒0.03ns
|
0.04ns
|
0.42** |
0.49** |
0.12ns
|
‒0.04ns
|
0.19ns
|
0.10ns
|
0.28** |
0.07ns
|
|
0.91** |
0.11ns
|
0.27** |
0.01ns
|
|
SFP |
0.10ns
|
0.09ns
|
0.08ns
|
‒0.46** |
‒0.08ns
|
0.11ns
|
0.28** |
0.32** |
0.11** |
0.11ns
|
0.21* |
0.07ns
|
0.26** |
0.11ns
|
0.92** |
|
0.18ns
|
0.25* |
0.06ns
|
|
SYPP |
0.32** |
0.23* |
0.30* |
‒0.29** |
‒0.02ns
|
0.90** |
0.36** |
0.82** |
0.37** |
0.29** |
0.46** |
0.20* |
0.36** |
0.33** |
0.13ns
|
0.25* |
|
0.26** |
0.82** |
|
TSW |
‒0.01ns
|
‒0.06ns
|
‒0.06ns
|
0.003ns
|
‒0.63** |
0.40** |
0.33** |
0.34** |
‒0.36** |
0.26* |
0.20ns
|
0.86** |
0.79** |
‒0.37** |
0.31** |
0.29** |
0.35** |
|
0.22* |
|
GY |
0.36** |
0.20ns
|
0.31ns
|
‒0.21* |
‒0.23* |
0.93** |
0.09ns
|
0.76** |
0.23* |
0.34** |
0.18ns
|
0.17ns
|
0.23* |
0.06ns
|
0.00ns
|
0.12ns
|
0.77** |
0.34** |
|
Table 11Estimates of correlation coefficients at genotypic (below diagonal) and phenotypic (above diagonal) levels among 19 traits of faba bean accessions at Degem in 2019 main cropping season.
Table 11
|
Trait |
LL |
LW |
LA |
DTF |
NPPN |
IL |
LPH |
PH |
NPPPL |
NSPP |
NBPPL |
PL |
PW |
NSPPL |
DM |
SFP |
SYPP |
TSW |
GY |
|
LL |
|
0.79** |
0.93** |
‒0.09ns
|
0.06ns
|
0.06ns
|
‒0.02ns
|
0.14ns
|
0.31** |
‒0.12ns
|
0.04ns
|
‒0.09ns
|
0.01ns
|
0.17ns
|
0.05ns
|
0.09ns
|
0.20* |
‒0.01ns
|
0.18ns
|
|
LW |
0.80** |
|
0.95** |
‒0.02ns
|
0.1ns
|
‒0.07ns
|
‒0.03ns
|
0.1ns
|
0.35** |
‒0.21* |
0.04ns
|
‒0.08ns
|
0.05ns
|
0.25* |
0.06ns
|
0.07ns
|
0.16ns
|
‒0.07ns
|
0.1ns
|
|
LA |
0.93** |
0.95** |
|
‒0.03ns
|
0.12ns
|
0ns
|
‒0.02ns
|
0.16ns
|
0.38** |
‒0.18ns
|
0.03ns
|
‒0.09ns
|
0.01ns
|
0.26* |
0.05ns
|
0.07ns
|
0.22* |
‒0.07ns
|
0.16ns
|
|
DTF |
‒0.1ns
|
‒0.01ns
|
‒0.04ns
|
|
0.11ns
|
‒0.07ns
|
0.11ns
|
0.14ns
|
‒0.01ns
|
‒0.15ns
|
‒0.08ns
|
0.12ns
|
0.05ns
|
‒0.11ns
|
‒0.02ns
|
‒0.41** |
‒0.23* |
0.02ns
|
‒0.14ns
|
|
NPPN |
0.06ns
|
0.11ns
|
0.12ns
|
0.12ns
|
|
0.06ns
|
0.27** |
0.30** |
0.52** |
‒0.37** |
0.03ns
|
‒0.17ns
|
0.06ns
|
0.37** |
0.01ns
|
‒0.04ns
|
0.01ns
|
‒0.27** |
‒0.03ns
|
|
IL |
0.06ns
|
‒0.09ns
|
0.01ns
|
‒0.06ns
|
0.06ns
|
|
0.02ns
|
0.26* |
0.1ns
|
0.04ns
|
0.09ns
|
0.37** |
0.35** |
‒0.03ns
|
‒0.04ns
|
‒0.01ns
|
0.18ns
|
0.22* |
0.11ns
|
|
LPH |
‒0.03ns
|
‒0.04ns
|
‒0.03ns
|
0.17ns
|
0.28** |
0.03ns
|
|
0.43** |
0.1ns
|
‒0.11ns
|
‒0.2ns
|
0.03ns
|
0.31** |
‒0.02** |
0.26ns
|
0.18ns
|
0.01* |
0.11ns
|
‒0.12ns
|
|
PH |
0.15ns
|
0.11ns
|
0.17ns
|
0.16ns
|
0.31** |
0.31** |
0.41** |
|
0.40** |
‒0.07ns
|
‒0.04ns
|
0.2ns
|
0.33** |
0.29** |
0.2ns
|
0.11ns
|
0.26* |
0.14ns
|
0.16ns
|
|
NPPPL |
0.33** |
0.38** |
0.41** |
‒0.01ns
|
0.56** |
0.09ns
|
0.1ns
|
0.42** |
|
‒0.31** |
0.27** |
‒0.1ns
|
0.09ns
|
0.78** |
0.11ns
|
0.09ns
|
0.25* |
‒0.24* |
0.12ns
|
|
NSPP |
‒0.09ns
|
‒0.22* |
‒0.18ns
|
‒0.18ns
|
‒0.38** |
0.15ns
|
‒0.14ns
|
‒0.09 |
- |
|
0.2ns
|
0.31** |
‒0.08ns
|
0.15ns
|
‒0.03ns
|
0.05ns
|
0.14ns
|
0.11ns
|
0.13ns
|
|
NBPPL |
0.04ns
|
0.05ns
|
0.05ns
|
‒0.08ns
|
0.01ns
|
0.11ns
|
‒0.23* |
‒0.04ns
|
0.29** |
0.30** |
|
0.17ns
|
0.07ns
|
0.30** |
0.14ns
|
0.17ns
|
0.2ns
|
0.11ns
|
0.08ns
|
|
PL |
‒0.08ns
|
‒0.07ns
|
‒0.08ns
|
0.08ns
|
‒0.2ns
|
0.46** |
0.02ns
|
0.21ns
|
‒0.12ns
|
0.36** |
0.21* |
|
0.32** |
‒0.05ns
|
0.07ns
|
0.03ns
|
0.12ns
|
0.50** |
0.12ns
|
|
PW |
0.03ns
|
0.09ns
|
0.02ns
|
0.04ns
|
0.04ns
|
0.47** |
0.34** |
0.42** |
0.14ns
|
‒0.15ns
|
0.09ns
|
0.38** |
|
‒0.09ns
|
0.17ns
|
0.14ns
|
0.17ns
|
0.43** |
0.13ns
|
|
NSPPL |
0.17ns
|
0.26* |
0.26** |
‒0.08ns
|
0.39** |
‒0.06ns
|
‒0.01ns
|
0.25* |
0.79** |
0.13ns
|
0.31** |
‒0.11ns
|
‒0.09ns
|
|
0.07ns
|
0.1ns
|
0.32** |
‒0.29** |
0.15ns
|
|
DM |
0.06ns
|
0.07ns
|
0.05ns
|
‒0.08ns
|
0.02ns
|
0.01ns
|
0.29** |
0.25* |
0.15ns
|
‒0.05ns
|
0.18ns
|
0.08ns
|
0.22* |
0.09ns
|
|
0.92** |
0.04ns
|
0.25* |
‒0.04ns
|
|
SFP |
0.1ns
|
0.08ns
|
0.08ns
|
‒0.46** |
‒0.03ns
|
0.04ns
|
0.18ns
|
0.15ns
|
0.12ns
|
0.06ns
|
0.2ns
|
0.04ns
|
0.19ns
|
0.1ns
|
0.92** |
|
0.15ns
|
0.24* |
0.05ns
|
|
SYPP |
0.23* |
0.19ns
|
0.24* |
‒0.29** |
‒0.01ns
|
0.29** |
‒0.01ns
|
0.31** |
0.29** |
0.18ns
|
0.23* |
0.14ns
|
0.26* |
0.34** |
0.05ns
|
0.17ns
|
|
0.26** |
0.82** |
|
TSW |
‒0.01ns
|
‒0.07ns
|
‒0.06ns
|
0.01ns
|
‒0.28** |
0.25* |
0.1ns
|
0.14ns
|
‒0.26* |
0.17ns
|
0.14ns
|
0.55** |
0.58** |
‒0.32** |
0.28** |
0.27** |
0.30** |
|
0.22* |
|
GY |
0.20* |
0.11ns
|
0.19ns
|
‒0.19ns
|
‒0.06ns
|
0.22* |
‒0.16ns
|
0.19ns
|
0.14ns
|
0.17ns
|
0.06ns
|
0.14ns
|
0.21* |
0.14ns
|
‒0.05ns
|
0.06ns
|
0.82** |
0.25* |
|
Table 12Genotypic path analysis of the direct (bold) and indirect effects of eighteen traits on grain yield in faba bean accessions at Girar Jerso in 2018.
Table 12
|
Traits |
DTF |
IL |
LPH |
NPPPL |
NSPP |
NBPPL |
NSPPL |
SYPP |
rg |
|
DTF |
‒13.98
|
‒17.51 |
‒35.77 |
‒4.79 |
7.99 |
‒10.31 |
2.85 |
1.80 |
0.20* |
|
IL |
‒13.98 |
‒17.51
|
‒28.05 |
‒4.76 |
‒2.74 |
‒3.51 |
2.18 |
1.49 |
0.23* |
|
LPH |
‒12.59 |
‒12.36 |
‒39.74
|
‒4.39 |
‒3.13 |
‒5.96 |
2.24 |
1.88 |
0.30** |
|
NPPPL |
‒8.02 |
‒9.97 |
‒20.88 |
‒8.35
|
‒2.23 |
‒7.66 |
4.19 |
1.45 |
0.23* |
|
NSPP |
13.98 |
‒5.99 |
‒15.57 |
‒2.33 |
‒7.99
|
2.54 |
0.48 |
0.96 |
0.23* |
|
NBPPL |
‒13.98 |
‒5.96 |
‒22.97 |
‒6.21 |
1.97 |
‒10.31
|
3.95 |
1.16 |
0.30* |
|
NSPPL |
‒7.79 |
‒7.46 |
‒17.38 |
‒6.84 |
‒0.75 |
‒7.95 |
5.12
|
1.23 |
0.20* |
|
SYPP |
‒5.29 |
‒5.48 |
‒15.64 |
‒2.54 |
‒1.62 |
‒2.52 |
1.31 |
4.77
|
0.69** |
Table 13Genotypic path analysis of the direct (bold) and indirect effects of eighteen traits on grain yield in faba bean accessions at Girar Jerso in 2019.
Table 13
|
Traits |
LL |
LW |
LA |
LPH |
PH |
NPPPL |
NSPP |
NBPPL |
PL |
PW |
NSPPL |
SYPP |
rg |
|
LL |
‒2.31
|
11.08 |
‒12.91 |
0.93 |
‒0.17 |
‒0.64 |
0.15 |
0.12 |
‒0.09 |
‒0.59 |
0.94 |
‒4.29 |
0.52** |
|
LW |
‒1.44 |
17.69
|
‒13.07 |
0.77 |
‒0.10 |
‒0.42 |
0.09 |
0.06 |
‒0.10 |
‒0.41 |
0.66 |
‒3.00 |
0.35** |
|
LA |
‒2.04 |
15.85 |
‒14.59
|
0.97 |
‒0.14 |
‒0.57 |
0.07 |
0.11 |
‒0.10 |
‒0.56 |
0.88 |
‒3.97 |
0.48** |
|
LPH |
‒1.01 |
6.37 |
‒6.68 |
2.13
|
‒0.17 |
‒0.62 |
‒0.01 |
0.08 |
‒0.04 |
‒0.65 |
1.03 |
‒2.74 |
0.31** |
|
PH |
‒1.50 |
6.42 |
‒7.99 |
1.33 |
‒0.26
|
‒1.17 |
0.15 |
0.15 |
0.02 |
‒1.19 |
1.88 |
‒4.06 |
0.49** |
|
NPPPL |
‒0.98 |
4.96 |
‒5.49 |
0.88 |
‒0.21 |
‒1.50
|
0.20 |
0.18 |
0.03 |
‒1.41 |
2.23 |
‒2.75 |
0.34** |
|
NSPP |
‒0.24 |
1.16 |
‒0.75 |
‒0.01 |
‒0.03 |
‒0.21 |
1.43
|
0.03 |
‒0.09 |
‒0.32 |
0.50 |
‒2.80 |
0.44** |
|
NBPPL |
‒0.87 |
3.62 |
‒5.01 |
0.54 |
‒0.13 |
‒0.81 |
0.13 |
0.31
|
0.08 |
‒0.85 |
1.35 |
‒3.00 |
0.34** |
|
PL |
‒1.24 |
6.86 |
‒7.24 |
0.53 |
‒0.06 |
‒0.14 |
0.38 |
0.06 |
‒0.12
|
‒0.27 |
0.44 |
‒2.52 |
0.39** |
|
PW |
‒1.09 |
9.49 |
‒7.40 |
0.47 |
0.02 |
0.233 |
0.64 |
‒0.13 |
‒0.19 |
0.25
|
‒0.40 |
‒2.88 |
0.34** |
|
NSPPL |
‒0.89 |
4.74 |
‒5.26 |
0.90 |
‒0.20 |
‒1.37 |
0.30 |
0.17 |
0.03 |
‒1.54 |
2.44
|
‒3.10 |
0.42** |
|
SYPP |
‒1.60 |
8.58 |
‒9.37 |
0.94 |
‒0.17 |
‒0.67 |
0.65 |
0.15 |
‒0.09 |
‒0.77 |
1.23 |
‒6.18
|
0.82** |
Table 14Genotypic path analysis of the direct (bold) and indirect effects of eighteen traits on grain yield in faba bean accessions at Degem in 2018.
Table 14
|
Traits |
LL |
DTF |
NPPN |
IL |
PH |
NPPPL |
NSPP |
PW |
SYPP |
TSW |
rgz)
|
|
LL |
0.07
|
0.51 |
4.30 |
‒0.81 |
2.80 |
‒8.35 |
‒0.89 |
0.23 |
‒2.16 |
‒0.01 |
0.36** |
|
DTF |
‒0.01 |
‒4.90
|
4.04 |
0.46 |
2.93 |
0.52 |
‒4.70 |
‒0.08 |
1.95 |
0.01 |
‒0.20* |
|
NPPN |
0.01 |
‒0.38 |
51.93
|
‒0.03 |
1.74 |
‒16.37 |
‒6.54 |
1.32 |
0.13 |
‒0.98 |
‒0.20* |
|
IL |
0.02 |
0.72 |
0.51 |
‒3.12
|
1.85 |
‒1.87 |
9.46 |
‒0.74 |
‒6.08 |
0.62 |
0.93** |
|
PH |
0.02 |
‒1.05 |
6.61 |
‒0.42 |
13.68
|
‒8.81 |
‒2.52 |
0.10 |
‒5.57 |
0.54 |
0.76** |
|
NPPPL |
0.03 |
0.13 |
41.35 |
‒0.29 |
5.86 |
‒20.55
|
‒3.96 |
0.63 |
‒2.54 |
‒0.56 |
0.23* |
|
NSPP |
‒0.00 |
1.50 |
‒22.09 |
‒1.92 |
‒2.24 |
5.30 |
15.37
|
‒0.59 |
‒1.94 |
0.40 |
0.34* |
|
PW |
‒0.01 |
‒0.24 |
‒39.68 |
‒1.34 |
‒0.81 |
7.50 |
5.28 |
‒1.72
|
‒2.41 |
1.23 |
0.23* |
|
SYPP |
0.02 |
1.41 |
‒1.03 |
‒2.81 |
11.26 |
‒7.70 |
4.40 |
‒0.6 |
‒6.77
|
0.54 |
0.77** |
|
TSW |
‒0.00 |
‒0.02 |
‒32.60 |
‒1.24 |
4.77 |
7.33 |
3.98 |
‒1.36 |
‒2.35 |
1.56
|
0.34** |
Table 15Genotypic path analysis of the direct (bold) and indirect effects of eighteen traits on grain yield in faba bean accessions at Degem in 2019.
Table 15
|
Traits |
LL |
IL |
PW |
SYPP |
TSW |
rgz)
|
|
LL |
6.08
|
0.92 |
‒1.76 |
‒0.04 |
0.04 |
0.20* |
|
IL |
0.39 |
14.55
|
10.14 |
‒0.06 |
‒1.42 |
0.22* |
|
PW |
0.17 |
6.88 |
8.56
|
‒0.05 |
‒3.26 |
0.21* |
|
SYPP |
1.39 |
4.27 |
3.08 |
‒0.19
|
‒1.70 |
0.82** |
|
TSW |
‒0.04 |
3.64 |
12.33 |
‒0.06 |
‒5.66
|
0.25* |
References
- Abdalla MM, Shafik MM, Abd El-Mohsen MI, Abo-Hegazy SR, Saleh , Heba MA. 2015. Investigation on faba beans, Vicia faba L., heterosis, inbreeding effects, GCA and SCA of diallel crosses of ssp Paucijuga and Eu-faba. J. Am. Sci.. 11(6): 1-7.
- Abdel-Aziz AH, Mohamed Osman AA. 2015. Variability, heritability and genetic advance in faba bean, Vicia faba L. International Journal of Research in Agriculture and Forestry. 2: 42-45.
- Abdelmula AA, Abuanja IK. 2007. Genotypic responses, yield stability, and association between characters among some of Sudanese faba beans (Vicia faba L.) under heat stress. In: Proc. of Conference on International Agricultural Research for Development; Kassel and Göttingen, Germany.
- Abo-El-Zahab AA, Ashor AM, El-Hadeedy KH. 1980. Comparative analysis of growth, development and yield of five field bean cultivars (Vicia faba L.) J. Agron. Crop Sci.. 149: 1-13.
- Agegnehu G, Fessehaie R. 2006. Response of faba bean to phosphate fertilizer and weed control on nitisols of Ethiopian highlands. Italian Journal of Agronomy. 2: 281-290.
- Alghamdi SS. 2007. Genetic Behavior of Some Selected Faba Bean Genotypes. African Crop Science Conference Proceedings. 8: 709-714.
- Alghamdi SS. 2009. Heterosis and combining ability in a diallel cross of faba bean (Vicia faba L.) genotypes. Asian Journal of Crop Science. 1(2): 66-76.
- Allard RW. 1960. Principles of Plant Breeding. John Wiley and Sons. Inc.. New York, U.S.A.
- Ammar MH, Alghamdi SS, Migdadi HM, Khan MA, El-Harty EH, Al-Faifi SA. 2015. Assessment of genetic diversity among faba bean genotypes using agro-morphological and molecular markers. Saudi J. Biol. Sci.. 22: 340-350.
- Azarpour E, Bidarigh S, Moraditochaee M, Danesh RK, Bozorgi HR, Bakian M. 2012. Path coefficient analysis of seed yield and its components in faba bean (Vicia faba L.) under nitrogen and Zinc fertilizer management. Intenteranal Journal of Agricultural Crop Science. 4(21): 1559-1561.
- Bakhiet MA, Rania AR, Raslan MA. 2015. Genetic Variability and Correlation in some Faba Bean Genotypes under Different Sowing Dates. World. Appl. Sci. J.. 33(8): 1315-1324.
- Bond DA. 1966. Yield and components of yield in diallel crosses between inbred lines of winter beans (Vicia faba L.). Journal of Agricultural Science of Cambridge. 67: 335-336.
- Bond DA, Poulsen MH. Hebblelhwaite P.D., 1983. Pollination. editor. The Faba bean (Vicia faba L.). A base for improvement. Butterworths. London, U. K.
- Bora GC, Gupta SN, Tomer YS, Singh S. 1998. Genetic variability, correlation and path analysis in faba bean (Vicia faba L.). Indian Journal of Agricultural Sciences. 68(4): 212-214.
- Burstin K, Gallardo RR, Mlr RK, Varsheny , Duc G. 2011. Improving Protein Content and Nutrition Quality. Crop Improvement Division. Indian Institute of Pulses Research. Kanpur, India.
- Burton GW, Devane EH. 1953. Estimating heritability in Tall Fescue (Festuca arundinacea) from replicated clonal material. Agron. J.. 45: 487-488.
- Central Statistical Agency(CSA).2016. Agricultural Sample Survey Report on Area and Production of Major Crops. (Private Peasant Holdings, Meher Season). Statistical Bulletin. Addis Ababa, Ethiopia.
- Chintalapati P. 2001. The Shift to Cereal Mono-cropping, a Threat or a Blessing: Towards Sustainable Agricultural Production in the Highlands of Southeast Oromia, Ethiopia. Working paper series No 92. ICRA. Wageningen, Netherlands.
- Chitra R, Rajamani K. 2010. Character association and path analysis in Glory lily (Gloriosasuperba). Communications in Biometry and Crop Science. 5(2): 78-82.
- Cubero JI. 2011. The faba bean: a historic perspective. The magazine of the European Association for Grain Legume Research. 56: 5-7.
- Desta B. Bec D. P., Materons L.A., 1988. Biological nitrogen fixation research on grain legumes in Ethiopia. editors. Nitrogen Fixation by Legumes in Mediterranean Agriculture. ICRADA. Boston, U.S.A.
- Dewey DR, Lu KH. 1959. A correlation path coefficient analysis of components of cresent wheat grass seed production. Agron J.. 51: 515-518.
- Dixit PK, Bhargava PD, Saxena DK, Bhatia LH. 1970. Estimates of genotypic variability of some quantitative characters in groundnut (Arachis hypogaea L.). Indian Journal of Agricultural Sciences. 40: 197-200.
- Elangovan M, Kiran babu P, Seetharama N. 2014. Genetic diversity and heritability characters associated in sweet sorghum (Sorghum bicolor (L.) Moench). Journal of Sugar Technology. 16(2): 200-210.
- El Fiel HEA, El Tinay AH, Elsheikh EAE. 2002. Effect of nutritional status of faba bean (Vicia faba L.) on protein solubility profiles. Food Chemistry. 76(2): 219-223.
- Fatih H. 2017. Performance assessment, genetic variability, heritability, genetic advance and correlation coefficient analysis for yield and some agro-morphological traits in faba bean (Vicia faba L.) genotypes in the Northern State, Sudan. International Journal of Current Microbial and Applied Sciences. 6(11): 1206-1214.
- Fatih EA, Gamal EK, Amin AA. 2017. Assessment of genotypic and phenotypic variability, heritability and genetic advance for seed yield and related agronomic traits in faba bean (Vicia faba L.) genotypes in Northern State, Sudan. Net Journal of Agricultural Science. 5(2): 48-52.
- Food and Agriculture Organization (FAO).2019. FAOSTAT statistical database. FAO (Food and Agriculture Organi-zation of the United Nations). Rome, Italy.
- Gezahegn A, Dawit A. In : Ali Kemal, Keneni Gemechu, Ahmed Seid, Malhotra R, Beniwal S, Makkouk K, . 2006. Marketing of pulses in Ethiopia. Food and forage legumes of Ethiopia: Progress and prospects In: Proceedings of a Workshop on Food and Forage Legumes; Addis Ababa, Ethiopia. pp 346-351.
- Gomez KA, Gomez AA. 1984. Statistical procedures for agricultural research. 2nd Ed. John Willey and Sons. New York, U. S. A.
- Haciseferogullari H, Gezer I, Bahtiyarca Y, Menges HO. 2003. Determination of some chemical and physical properties of Sakiz faba bean (Vicia faba L. Var. major). J. Food Eng.. 60: 475-479.
- Hanelt P, Metin D. 1989. Biosystematics of the genus Vicia L. (Leguminosae). Annual Review of Ecological systems. 20: 199-223.
- Hawtin GC, Hebblethwaite PD. Hebblethwaite P.D., 1983. editor. The faba bean (Vicia faba L.): A basis for improvement. Butterworths. London, U. K.
- Jiang Q, Webb SL, Yesudas ChR, Bhandari HS, Narasim-hamoorthy B. 2014. Variance components and heritability of biomass yield in switch grass grown in the Southern Great Plains. Field Crops Res.. 168: 148-155.
- Johnson HW, Robinson HP, Cosmtock RE. 1955. Genetic and environmental variability in soybean. Agron J.. 47: 314-318.
- Kaur S, Cogan NOI, Forster JW, Paull JG. 2014. Assessment of genetic diversity in faba bean based on single nucleotide polymorphism. Diversity. 6: 88-101.
- Kebebew A, Gina C, Dejene G, Rizqah K, Solomon Ch, Sonia PW, et al. 2015. Genetic diversity in tef (Eragrostis tef (Zucc.) Trotter). Frontiers of Plant Science. 6(177): 1-13.
- Lawes DA, Bond DA, Poulsen MH. Hebblethwaite PD, 1983. Classification, origin, breeding methods and objectives. editor. The faba bean (Vicia faba L.) A basis for improvement. Butterworths. London, U. K.
- Lush JK. 1940. Intra-sine correlations or regressions of offspring on dam as a method of estimating heritability of characteristics. Am. Soc. Anim. Prod. Proc.. 33: 293-301.
- Marzinzig B, Brünjes L, Biagioni S, Behling H, Link W, Westphal C. 2018. Bee pollinators of faba bean (Vicia faba L.) differ in their foraging behavior and pollination efficiency. Agric. Ecosyst. Environ.. 264: 24-33.
- Merga B, Haji J, Yildiz F. 2019. Economic importance of chickpea: Production, value, and world trade. Cogent Food Agric.. 5(1): 1615718
- Miller PA, Williams C, Robinson HF, Comstock RE. 1958. Estimates of genotypic and Environmental variances and co-variances in upland cotton and their implications in selection. Agricultural Journal. 50: 126-131.
- Million F, Habtamu S. 2012. Genetic variability on seed yield and related traits of elite faba bean (Vicia faba L.) genotypes. Pak. J. Biol. Sci.. 15(8): 380
- Negahi A, Bihamata MR, Negahi Z, Aidoust M. 2014. Evaluation of genetic variation of some agronomical and morphological traits in Iranian and exotic common bean (Phaseolus vulgaris L.). Agricultural Communications. 2(3): 22-26.
- Ouji A, Rouaissi M, Abdellaoui R, Gazzah ME. 2011. The use of reproductive vigor descriptors in studying genetic variability in nine Tunisian faba bean (Vicia faba L.) populations. Afr. J. Biotechnol.. 10(6): 896-904.
- Patterson HD, Williams ER. 1976. A new class of resolvable incomplete block designs. Biometrika. 63: 83-89.
- Peyman S. 2014. Correlation and path coefficient analysis of yield and yield component in some of broad bean (Vicia faba L.) genotypes. Genetika. 46(3): 905-914.
- Peyman S. 2015. Genetic variation for seed yield and some of agro-morphological traits in faba bean (Vicia faba L.) genotypes. Acta Agricultural Slovenica Journal. 105(1): 73-83.
- Purseglove JW. 1968. Tropical crops. Dicotyledons-1. Longmans Green and Co. Ltd. Harlow, U. K.
- Rashid KY, Bernier . 1994. Gene transfer in faba bean by honeybees under cages. Newsletter (ICARDA). Faba Bean Information Service. 34(35): 10-3.
- Robertson GE. 1959. The sampling variance of the genetic correlation coefficient. Biometrics. 15: 469-485.
- Senayit Y, Asrat W. In : Asfaw T, Saxena M, Solh M, Geletu B. 1994. Utilization of cool season food legumes in Ethiopia. Cool season food legumes of Ethiopia In: Proceedings of the first national food legumes review conference; Addis Abeba, Ethiopia.
- Sharma JR. 1998. Statistical and biometrical techniques in plant breeding. New Age International Publication. New Delhi, India.
- Sheelamary S, Shivani . 2015. Genetic variability, Heritability and Correlation of faba bean (Vicia faba L.) grown in New Delhi. International Journal of Advanced Technology in Engineering and Science. 3(1): 2348-7550.
- Singh KB. 1990. Prospects of developing new genetic material and breeding methodologies for chickpea improvement. CIHEAM-Options Mediterranean's. 9: 43-50.
- Singh RK, Chaudhary BD. 1977. Biometrical methods in quantitative genetic analysis. Kalyani Publishers. New Delhi-Ludhiane, India.
- Singh RK, Kakar SN. 1977. Control on individual trait means during index selection. In: Proceeding of third congr; SABRAO. Canberra, Australia.
- Sivasubramanian S, Madhava Menon P. 1973. Genotypic and phenotypic variability in Rice. Madras Agricultural Journal. 60: 1093-1096.
- Swarup V, Changle DS. 1962. Studies on genetic variability in sorghum phenotypic variation and its inheritable component in some important quantitative characters contributing towards yield. Indian Journal of Genetics. 22: 31-36.
- Tadele T, Mulusew F, Teshome L, Parven A. 2011. Correlation and path coefficient analysis of yield and its component in faba bean (Vicia faba L.) germplasm. Int. J. Biodivers. Conserv.. 3: 376-382.
- Tafere M, Tadesse D, Yigzaw D. 2013. Genetic variability, heritability and correlation in some faba bean genotypes (Vicia faba L.) grown in Northwestern Ethiopia. Int. J. Genet. Mol. Biol.. 5(1): 8-12.
- Toker C. 2004. Estimates of broad-sense heritability for seed yield and yield criteria in faba bean (Vicia faba L.). Hereditas.. 140: 222-225.
- Ulukan H, Gular M, Keskin S. 2003. A Path coefficient analysis of some yield and yield components in faba bean (Vicia faba L.) genotypes. Pak. J. Biol. Sci.. 6(23): 1951-1955.
- Wright S. 1921. Correlation and causation. J. Agric. Res.. 20: 557-585.
- Yassin TE. 1973. Genotypic and phenotypic variances and correlations in field beans (Vicia faba L.). J. Agric. Sci.. 81: 445-448.


