Abstract
Six durum and twelve bread wheat genotypes were evaluated under favorable and drought-stressed field conditions, and screened with thirty simple sequence repeats (SSR) markers. The traits studied were stomata frequency (STF), relative water content (RWC), flag leaf area (FLA), flag leaf weight (FLW), flag leaf dry matter content (FLD), chlorophyll a content (Chl.a), chlorophyll b content (Chl.b), grain yield/plant (GYP) and 1000-kerenl weight (TKW). Highly significant differences were observed among wheat genotypes for all the traits, indicating considerable genetic variation. Moderate to high broad-sense heritability estimates were observed for the studied traits. Under drought stress, GYP was positively correlated with RWC, FLA, FLW and TKW, whereas negatively correlated with STF. G3 (Svevo) and G6 (WK-12-1) were the most drought-tolerant durum wheat, whereas G11 (L.S-15) and G16 (SIDS-1) were the most drought-tolerant bread wheat genotypes. SSR markers analysis indicated considerable genetic variation between and within durum and bread wheat genotypes. The percentage of polymorphism ranged from 14.3% (Xgwm174-5D) to 100% (Xgwm294-2A and Xgwm573-7B), with an average of 61.4%. The polymorphism information content (PIC) ranged from 0.20 (Xwmc596-7A) to 0.48 (Xgwm294-2A), with an average of 0.33.The highest polymorphism (77.1%) was observed in the B genome followed by A (57.8%) and D (50.0%) genomes. Cluster analysis based on phenotypic data distinguished the most drought-tolerant genotypes (G6 and G11) from the remaining genotypes. Cluster analysis based on SSR markers distinguished durum from bread wheat genotypes. The study indicated that phenotypic data and SSR markers were effective in assessing the genetic diversity in the studied genotypes.
-
Key words: Durum wheat, Bread wheat, Genetic diversity, Drought tolerance, SSR markers
INTRODUCTION
Drought stress is a major abiotic factor threatening wheat plants in many growing regions of the world including Egypt. Drought stress affects growth, develop-ment and production of crops due to physiological interruptions, biochemical modifications and physical damages (
Iqbal et al. 2020). Drought affects plants in various developmental stages including germination, vegetative and reproductive growth, grain filling and maturation (
Hossain et al. 2012). Therefore, development of drought-tolerant genotypes is an important goal of wheat breeders. The acquisition of high-yielding wheat varieties tolerant to drought stress requires better understanding of genetic and physiological bases of drought tolerance (
Touzy et al. 2019). Drought induces various physiological and biochemical modifications in the plants allowing them to tolerate drought stress conditions, and the degree of physiological adaptations of the plants in response to drought stress may differ considerably among species (
Almeselmani et al. 2011). Accordingly, understanding physiological mechanisms and adaptations of the plants in response to drought stress could help for identifying drought-tolerant genotypes in breeding programs.
Drought tolerance is a complex trait controlled by polygenes with a high level of genotype by environment interaction. Responses of a plant to drought stress are also affected by the time, intensity, duration, and frequency of the stress as well as various plant–soil–atmosphere interactions (
Pierre et al. 2012). Several types of stresses can also affect the plant simultaneously (
Fleury et al. 2010). Moreover, development of drought-tolerant wheat cultivars is hampered by the lack of effective selection criteria (
El-Rawy and Hassan 2014).
Correlation analysis between drought tolerance indices and grain yield could be also an effective indicator for identifying the best genotypes as well as indices used (
Farshadfar et al. 2012). Morpho-physiological traits associated with wheat grain yield under drought stress are faster to measure at seedling stage, and thus they can provide an estimate of yield potential more readily before final harvest. Therefore, the use of physiological traits as indirect selection criteria for drought tolerance has been reported in wheat (
Bayoumi et al. 2008;
Chen et al. 2012). In this regard, the screening method of drought tolerance must be repeatable, heritable, cost efficient with a low genotype-by-environment interaction (
Ahmad et al. 2018).
Flag leaf characteristics have been considered as important traits associated with grain yield in wheat. Stomata represent the vital gates between the plant and atmosphere and play a central role in plant responses to environmental conditions (
Xu and Zhou 2008). Therefore, flag leaf and stomata characteristics have been widely used as excellent tools to assess drought tolerance capacity of crop plants (
Zhang et al. 2006;
Ahsan et al. 2008;
Xu and Zhou 2008;
El-Rawy and Hassan 2014). Chlorophylls represent the most important photosynthetic pigments, and control the photosynthetic potential of plants by capturing light energy from the sun. Therefore, the accurate measuring of chlorophylls content in plant leaves is important for monitoring plant stress in agricultural systems (
Shah et al. 2017). The genetic diversity existed between and within local and exotic wheat germplasm for important traits could be important for developing wheat varieties in breeding programs (
Khan et al. 2015). Although, morpho-physiological traits have been used for assessing the genetic diversity, they are often influenced by the environ-mental conditions. Therefore, the use of molecular markers for assessment of the genetic diversity has received great attention (
Salem et al. 2015). In this regard, SSR markers have several advantages over other molecular markers as they are chromosome-specific with a high level of polymorphism and distributed over all the genome, which allow for discriminating among different cultivars as well as among closely related lines (
Maccaferri et al. 2007;
Mantovani et al. 2008). Accordingly, the genetic diversity in wheat has been widely assessed based on phenotypic data and SSR markers (
Salem et al. 2015;
Hassan 2016;
Gurcan et al. 2017;
Phougat et al. 2018;
Ali et al. 2019;
Slim et al. 2019;
Yang et al. 2020;
Haque et al. 2021).
In the present study, six durum and twelve bread wheat genotypes were evaluated under favorable and drought stress conditions, and screened with thirty simple sequence repeats (SSR) markers. The aims were: 1) to assess the genetic diversity among the studied genotypes based on phenotypic data and SSR markers; 2) to identify drought-tolerant durum and bread wheat genotypes to be used as genetic resources in breeding programs; and 3) to identify SSR markers associated with drought tolerance in the studied genotypes.
MATERIALS AND METHODS
The plant material and field evaluation
The present study was carried out at Faculty of Agriculture, Assiut University, Egypt during the 2017-2018 winter season. A total of six durum (
Triticum durum Desf.) and twelve bread (
T. aestivum L.) wheat genotypes were used (
Table 1). Out of the genotypes tested, four advanced inbred lines were developed at the Department of Genetics of Faculty of Agriculture, Assiut University.
Seeds of all genotypes were planted in the fields at an optimal sowing date (The 26th November). Two irrigation regimes were used as follow; 100% (favorable environment), and 50% (drought stress environment) field water capacity in clay fertile soil at the Experimental Farm of Faculty of Agriculture, Assiut University.
For the favorable environment (E1), the irrigation was applied every 2 weeks with a total number of eight irriga-tions throughout the growing season, excluding the establishment irrigation. For the drought stress environ-ment (E2), the irrigation was applied every 4 weeks with a total number of four irrigations throughout the growing season, excluding the establishment irrigation. For each environment, all genotypes were planted in a randomized complete block design (RCBD) with three replications. Each genotype was represented in each block by ten-plants per row with 50 cm row spacing and 30 cm plant spacing.
Morpho-physiological traits
At the flowering stage, stomata frequency (number of stomata/mm
2), relative water content (%), flag leaf area (cm
2), flag leaf weight (g), flag leaf dry matter content (mg g
-1), Chlorophyll a content (µg/0.2 g FW) and chlorophyll b content (µg/0.2 g FW) were measured in the flag leaves of each individual plant grown under favorable and drought stress environments. At the maturity, grain yield per plant (g) and 1000-kerenl weight (g) were recorded for the two environments. Stomata frequency was measured on the abaxial surface of flag leaf at each side of the mid-rib following
El-Rawy and Hassan (2014). Relative water content (RWC) was calculated using
Karrou and Maranville (1995) formula as follows:
RWC (%) = (Fresh weight-Dry weight) / (Turgid weight-Dry weight ) × 100.
Length and maximum width of flag leaf were measured and flag leaf area (FLA) was then calculated using the following formula:
Chlorophyll content was extracted in 80% acetone and the amount of chlorophyll a and b was estimated according to
Arnon (1949).
In addition, four drought tolerance indices adjusted based on grain yield under favorable and heat stress conditions were calculated for each genotype using the following formulas:
1- Mean productivity (MP) = (Ys + Yp) / 2 (Rosielle and Hamblin 1981).
2- Geometric mean productivity (GMP) = [Yp × Ys]0.5 (Fernandez 1992).
3- Harmonic mean (HM) = [2 (Yp × Ys)] / (Yp + Ys) (Fernandez 1992).
4- Drought susceptibility index (DSI) = [1 – (Ys / Yp)] / SI
Where, Yp and Ys are grain yield of a genotype, whereas Ῡp and Ῡs represent mean grain yield of all genotypes under favorable and drought stress conditions, respectively.
Statistical analysis of phenotypic data
The differences between means were tested by Fisher’s Least Significant Difference (LSD) at 5% probability. Combined analyis of variance across the two environments were used to test the significance of differences among genotypes (G) and environments (E) and the significance of G × E interaction. Components of variance of each trait were estimated from mean squares, and broad-sense heritability estimates were computed. Pearson’s correlation coefficients were estimated among traits evaluated under drought stress.
DNA extraction and PCR amplifications
The total genomic DNA was extracted from fresh leaves of each genotype using the cetyltrimethylammonium bromide (CTAB) method (
Murray and Thompson 1980). Thirty wheat microsatellites or SSR primer pairs representing all wheat chromosomes were selected and used for screening wheat genotypes (
Supplementary Table S1). Sequences of SSR primers and PCR conditions were obtained by GrainGenes Database (
http://wheat.pw.usda. gov). PCR amplifications were performed in a SensoQuest LabCycler (SensoQuest GmbH, Göttingen, Germany). PCR products were separated on 2.5% agarose gels in 0.5 × TBE buffer. A 100bp DNA Ladder was used to estimate the size of amplified DNA fragments. Putative polymorphisms were detected for each marker. Percentage of the poly-morphism obtained by each SSR marker was calculated. In order to investigate the suitability of each SSR marker to assess the genetic diversity among the studied wheat genotypes, polymorphism information content (PIC) following
Roldan-Ruiz et al. (2000) and marker index (MI) using the method of
Powell et al. (1996) was also calculated.
Cluster analysis of the studied genotypes based on phenotypic data was done using Standardized Euclidean’s coefficient and Unweighted Pair Group Method with Arithmetic Mean (UPGMA) by MVSP version 3.22 (Kovach Computing Services). The genetic similarity estimates based on SSR markers were computed and UPGMA-dendrogram was performed according to Nei and Li’s coefficient using MVSP version 3.22.
RESULTS
Genetic diversity based on morpho-physiological traits
On average, drought stress reduces stomata frequency (STF), relative water content (RWC), flag leaf area (FLA), flag leaf weight (FLW), flag leaf dry matter content (FLD), chlorophyll a content (Chl.a), chlorophyll b content (Chl.b), grain yield per plant (GYP) and 1000-kerenl weight (TKW) by 21.55, 8.91, 29.37, 30.22, 6.89, 20.71, 18.92, 17.51 and 11.01% in durum wheat and 15.44, 8.89, 30.27, 34.30, 9.91, 17.99, 13.97, 17.99 and 10.27% in bread wheat, respectively (
Table 2).
Uniformly, the averaged values of STF, TKW were higher in magnitude in durum wheat compared to bread wheat, whereas RWC, FLA, FLW, FLD and GYP were greater in bread wheat than durum wheat under both favorable and drought stress conditions. Although the averaged Chl.a was larger in durum wheat, bread wheat showed larger Chl.b under favorable and drought stress conditions (
Table 2).
Under drought stress conditions and among six durum wheat genotypes, G3 (Svevo) showed the lowest STF (52.95) as well as the highest RWC (82.98) and Chl.a (38.32), while G6 (WK-12-1) exhibited greater FLW (1.12), FLD (48.38), Chl.b (31.32), GYP (68.79) and TKW (57.93). Out of twelve bread wheat genotypes, G11 (L.S-15) had lower STF (40.52) as well as larger FLA (26.40), FLW (1.79), FLD (57.62), Chl.a (40.64), Chl.b (62.48) and TKW (55.30) under drought stress conditions (
Table 2).
The combined analyses of variances (
Table 3) revealed highly significant differences between favorable and drought stress environments. Highly significant (
P < 0.01) genotypes differences were observed for all the traits. Highly significant (
P < 0.01) differences were obtained among durum wheat genotypes for STF, RWC, Chl.a, Chl.b, GYP and TKW. Meanwhile, the differences among bread wheat genotypes were highly significant (
P < 0.01) for all the traits. Highly significant (
P < 0.01) differences between durum and bread wheat genotypes were also observed for all the traits. Highly significant G × E interactions (
P < 0.01) were observed for STF, RWC, FLD, Chl.a, Chl.b, GYP and TKW, whereas, significant interactions (
P < 0.05) were obtained for FLA and FLW. Moderate to high broad-sense heritability estimates were obtained for STF (0.63), FLA (0.52), FLW (0.69), FLD (0.47), Chl.a (0.43), Chl.b (0.51), GYP (0.61) and TKW (0.70), whereas rather low heritability estimate was found for RWC (0.35) (
Table 3).
In the present study, four drought tolerance indices adjusted based on grain yield under favorable and heat stress conditions, namely mean productivity (MP), geometric mean productivity (GMP), harmonic mean (HM) and drought susceptibility index (DSI) were calculated in order to identify promising genotypes under heat stress conditions. Although the larger GYP of the studied durum wheat genotypes under favorable environment (84.35 g) was found in G5 (Sohag-3), the larger GYP under drought stress (68.79 g) was obtained by G6 (WK-12-1). In addition, the lowest reduction percentage resulting by drought stress (11.88%) was also obtained by G6 (WK-12-1). Regarding drought tolerance indices, G2 (BeniSuef-5) exhibited larger MP (76.37 g), GMP (75.98 g) and HM (75.59 g). Furthermore, G3 (Svevo) and G6 (WK-12-1) showed the lowest DSI values (0.81 and 0.67, respectively) (
Table 4).
Out of the studied bread wheat genotypes, G12 (L.S-16) had greater GYP under favorable (105.89 g) and drought stress (85.55 g) conditions, as well as greater MP (95.72 g), GMP (95.18 g) and HM (94.64 g). However, the lowest reduction percentage resulting by drought stress (11.24%) was obtained by G11 (L.S-15). Meantime, G11 (L.S-15) and G16 (SIDS-1) showed the lowest DSI values (0.63 and 0.83, respectively) (
Table 4).
GYP was positively correlated with RWC (r = 0.54,
P < 0.05), FLA (r = 0.83,
P < 0.01), FLW (r = 0.63,
P < 0.01) and TKW (r = 0.57,
P < 0.05). However, negative correlation was found between GYP and STF (r = ‒0.62,
P < 0.01). In addition, STF was negatively correlated with RWC (r = ‒0.48,
P < 0.05), FLA (r = ‒0.58,
P < 0.05) and FLD (r = ‒0.59,
P < 0.01). Meantime, RWC was positively correlated with FLA (r = 0.49,
P < 0.05). Nonsignificant correlation was observed between Chl.a and Chl.b (
Table 5).
Using 30 SSR markers for screening 6 durum and 12 bread wheat genotypes (
Table 6), a total of 171 bands were generated, which ranged from 2 bands for Xgwm294-2A, Xgwm458-1D, Xgwm261-2D, Xgwm165-4D, Xgwm182-5D and Xgwm437-7D to 13 bands for Xgwm160-4A, with an average of 5.7 bands per marker. Of 171 bands generated, 105 bands were polymorphic, with an average of 3.5 polymorphic bands per marker. The lowest polymorphism (14.3%) was obtained with Xgwm174-5D, whereas the highest (100%) was produced by Xgwm294-2A and Xgwm573-7B, with 61.4% averaged polymorphism. The polymorphism information content (PIC) values ranged from 0.20 for Xwmc596-7A to 0.48 for Xgwm294-2A with an average of 0.33 PIC per marker. However, the lowest marker index (0.28) were obtained with Xgwm261-2D, Xgwm165-4D and Xgwm437-7D, whereas, Xgwm 459-6A showed the highest marker index (3.78), with an average of 1.15 per marker. Considering different wheat genomes, the SSR markers belonging to the A genome generated larger number of bands (83) compared to B (48) and D (40) genomes. However, the highest polymorphism (77.1%) was observed in the B genome followed by A (57.8%) and D (50.0%) genomes. However, SSR markers belonging to the A genome showed higher marker index (averaged 1.59) compared to B (1.23) and D (0.59) genomes (
Table 6).
On the other hand, 6 SSR markers generated specific bands which were able to distinguish durum from bread wheat genotypes (
Table 7). Of which, two specific bands generated by the markers Xgwm497-1A (312 bp) and Xgwm155-3A (120 bp) were present only in the six durum wheat genotypes, while four bands generated by Xgwm 695-4A (610 bp), Xgwm186-5A (298 bp), Xgwm577-7B (255 bp) and Xgwm182-5D (532 bp) were present in all bread wheat genotypes but absent in all durum wheat genotypes. In addition, two specific bands generated by Xgwm260-7A (345 bp) and Xgwm573-7B (221 bp) were present only in the most drought-tolerant bread wheat genotypes G11 (L.S-15) and G16 (SIDS-1) (
Table 7).
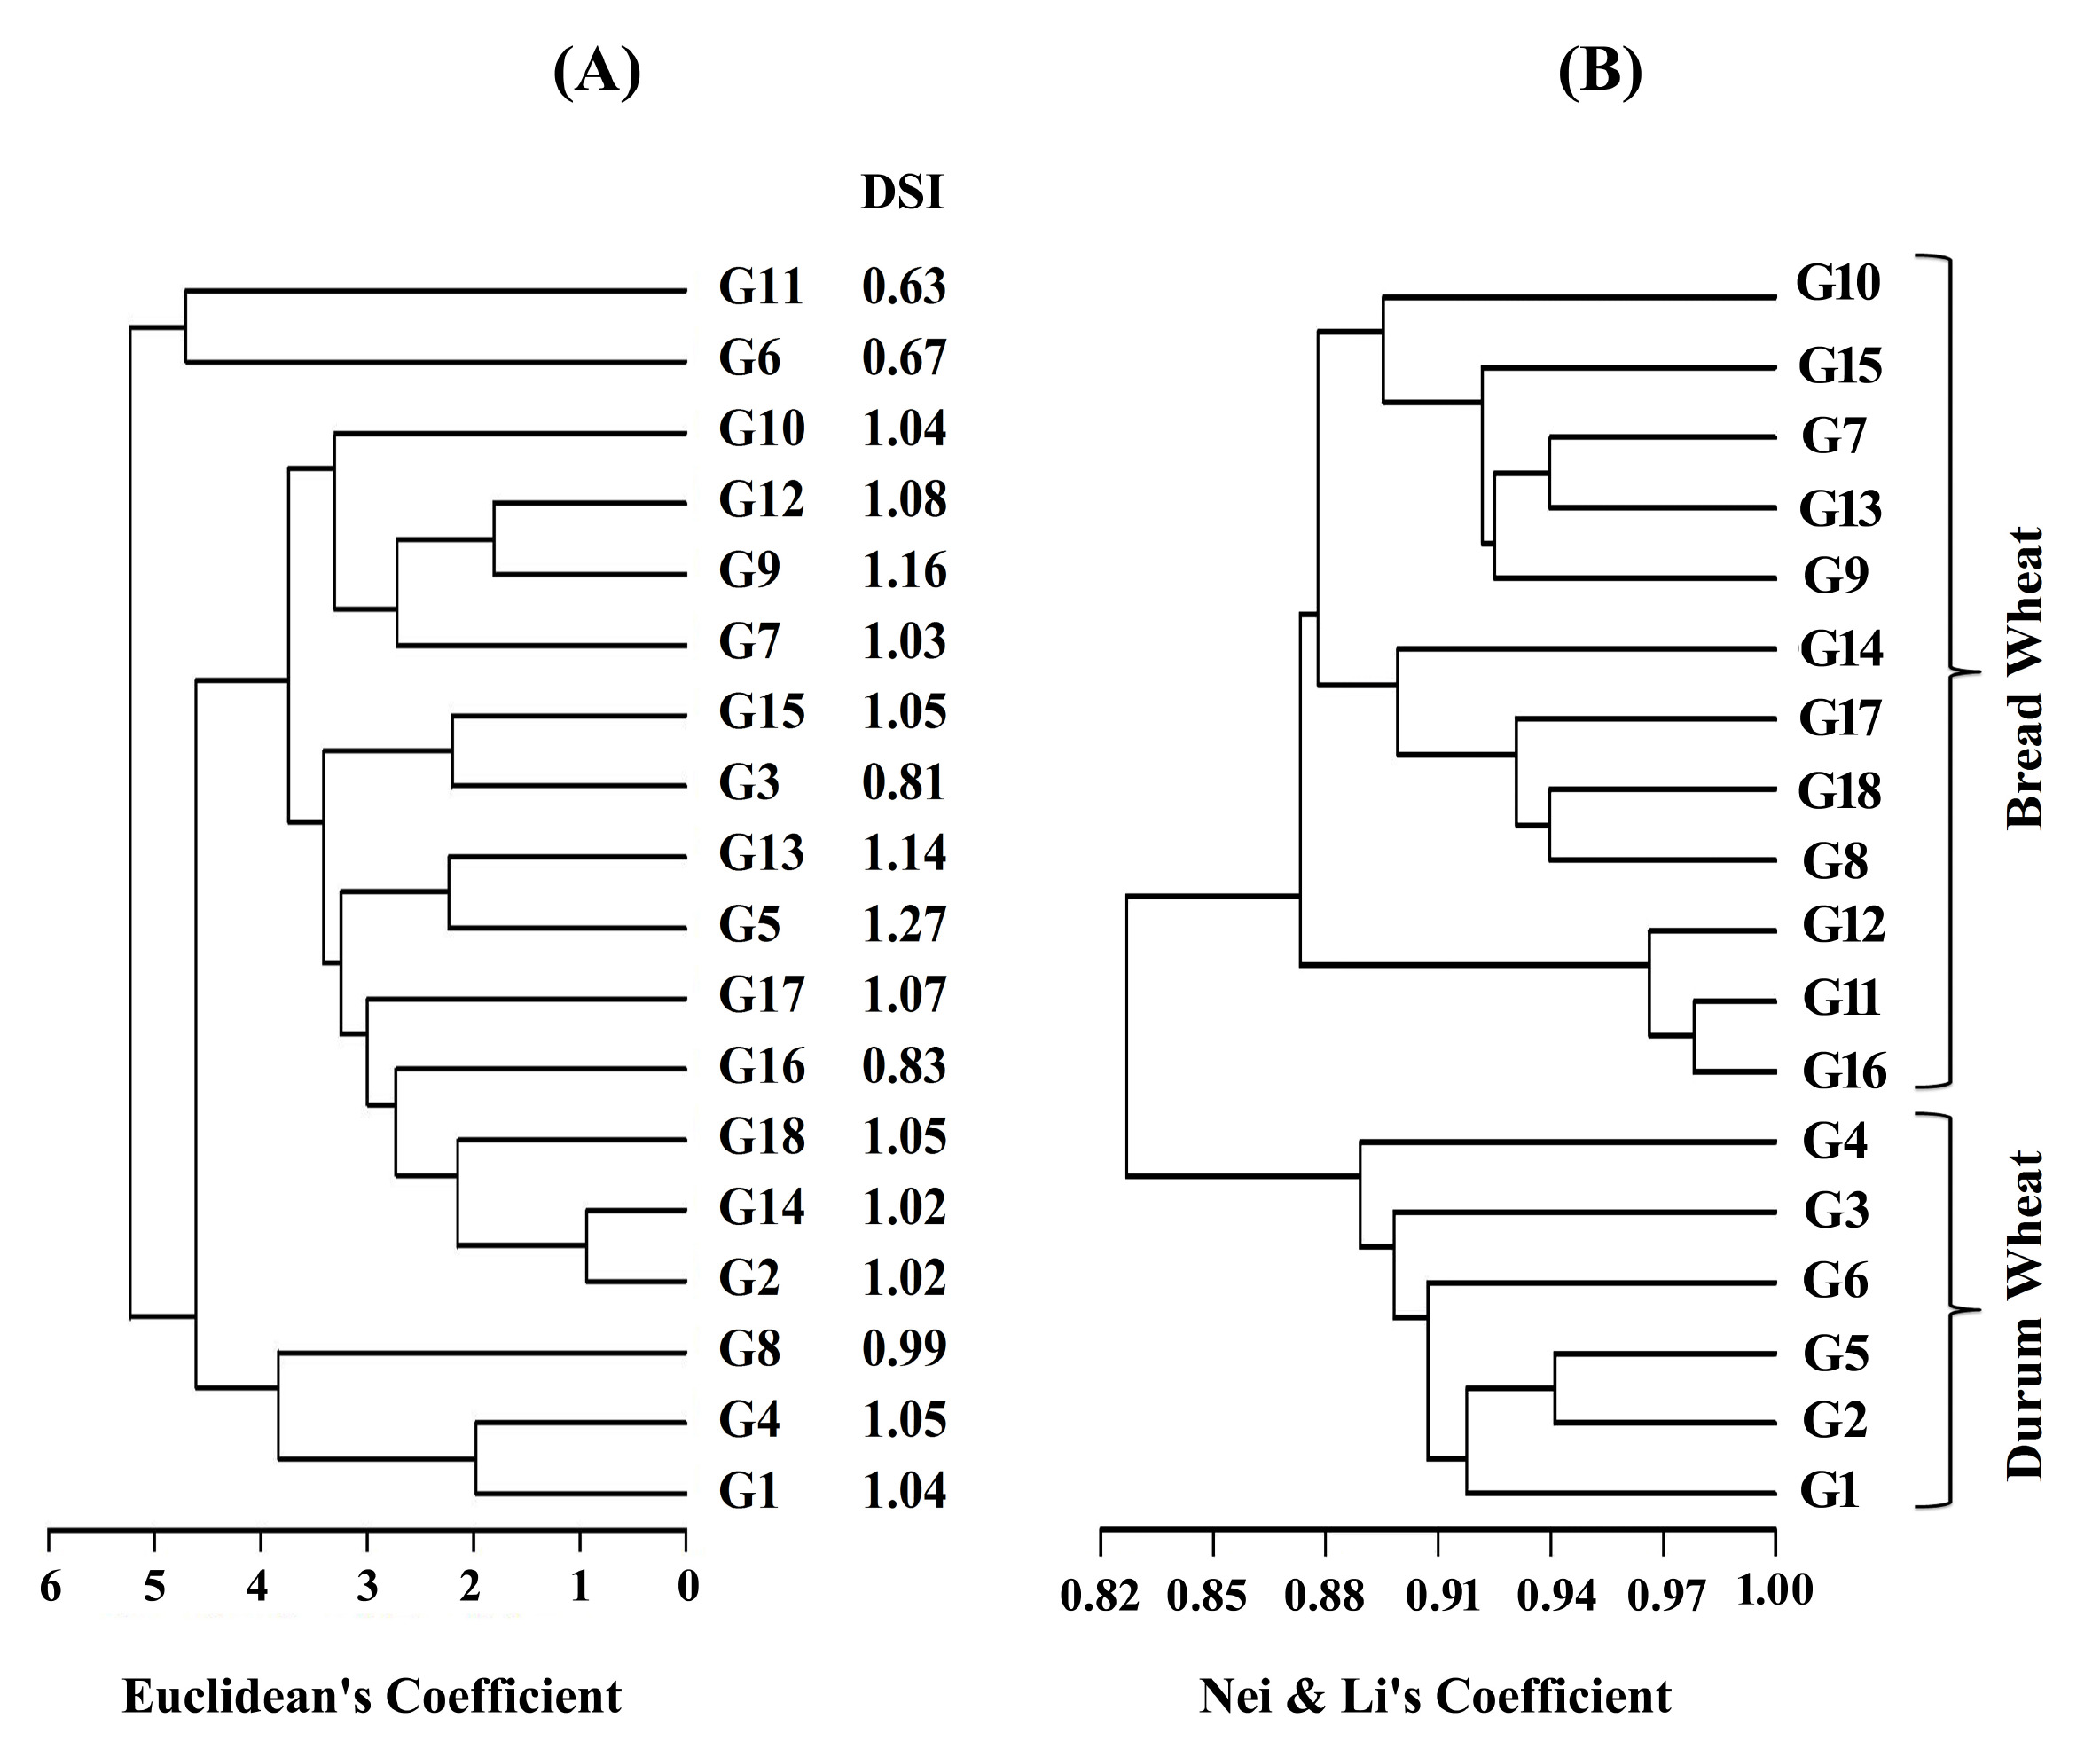
Cluster analysis based on phenotypic data classified the tested durum and bread wheat genotypes into two groups with two and sixteen genotypes. Cluster-I contained the most drought-tolerant genotypes G6 (WK-12-1) and G11 (L.S-15), which exhibited the lowest DSI values (0.67 and 0.63, respectively). Cluster-II contained the remaining genotypes, which was split into two sub-clusters with three and thirteen genotypes (
Fig. 1).
Cluster analysis based on SSR markers classified the tested wheat genotypes into two groups, based on ploidy levels. The twelve bread wheat genotypes were grouped together in Cluster-I, whereas Cluster-II contained the six durum wheat genotypes. In addition, three sub-clusters were formed within Cluster-I, of which the most drought-tolerant bread wheat genotypes, nemely G11 (L.S-15) and G16 (SIDS-1) were gathered in a sub-cluster along with G12 (L.S-16) (
Fig. 1).
DISCUSSION
Drought decreases the leaf water potential due to the accumulation of solutes, consequently a reduction in stomatal conductance, photosynthesis and transpiration rate, resulting in a reduction of growth and yield (
Ahmad et al. 2018). Stomata play a valuable role in controlling water evaporation and gas exchange in plant leaves (
Liao et al. 2005;
Pirasteh-Anosheh et al. 2016). The first reaction of plants to severe drought is closing their stomata to prevent water loss from plant leaves via transpiration (
Pirasteh-Anosheh et al. 2016). Stomatal frequency is also closely linked to water use efficiency through its influence on stomatal conductance (
Zhang et al. 2006).
Although the closure of stomata helps to decrease water loss, some plants avoid heat stress by increasing stomata conductance and, consequently, evaporative cooling. The two mechanisms will conflict when high temperature and drought occur simultaneously (
Fleury et al. 2010). An increase in stomata density was observed under moderate drought, but a decrease occurred with drought severity (
Xu and Zhou 2008). In accordance with the result of the present study, stomata frequency was decreased in response to drought stress (
Pirasteh-Anosheh et al. 2016). The water balance of the plant is disrupted during drought stress resulting in a reduction in relative water content and water potential of plant leaves (
Bajjii et al. 2001). Moreover, drought affects photosynthesis negatively by changing the inner structure of chloroplasts, mitochondria, and chlorophyll content (
Arjenaki et al. 2012).
Highly significant differences were observed among wheat genotypes for all the traits. Highly significant differences were also observed between durum and bread wheat genotypes. These results indicated the existence of sufficient genetic variability, which is important for the evaluation of drought tolerance in breeding programs. In the present study, durum wheat genotypes had higher stomata than bread wheat genotypes under both environ-mental conditions. Accordingly, significant variation in stomatal frequency has been also reported between the ploidy levels in
Triticum species (
Khazaei et al. 2010). The highest stomatal frequency was found in diploid wheat species, whereas hexaploid wheat exhibited a lower stomatal frequency than tetraploid wheat. The reduction in stomatal frequency is mainly a result of larger epidermal cells. Therefore, stomatal frequency has been long used as a morphological marker for identifying ploidy levels in several plant species including wheat (
Khazaei et al. 2010).
In the present study, moderate to high estimates of broad-sense heritability were obtained for stomata fre-quency, flag leaf area, flag leaf weight, flag leaf dry matter content, chlorophyll a content, chlorophyll b content, grain yield per plant and 1000-kernel weight. In accordance, stomatal frequency was found to be highly heritable by
Liao et al. (2005) and
EL-Rawy and Hassan (2014). Moderate broad-sense heritability was also found for 1000-kernel weight by
EL-Rawy and Hassan (2014). High heritability and genetic advance estimates were also reported for flag leaf area, 1000-grain weight and grain yield per plant (
Saleem et al. 2016). On the other hand, low heritability was found in the present study for relative water content. Unlike, high broad-sense heritability was obtained by
Bayoumi et al. (2008) for relative water content under water stress conditions, suggesting that phenotypic selection for this parameter may be more efficient for drought tolerance in wheat. Evidently, heritability estimates could help plant breeders to predict the interaction of genes in successive generations and highly heritable trait essential for effective breeding programs (
Saleem et al. 2016).
Under drought stress, grain yield per plant was positively correlated with relative water content, flag leaf area, flag leaf weight and 1000-kernel weight, whereas negatively correlated with stomata frequency. Similarly, significant and positive correlation was found between gain yield and relative water content under water stress (
Bayoumi et al. 2008). In addition, grain yield per plant was negatively correlated with stomata frequency by
Ahsan et al. (2008) and
EL-Rawy and Hassan (2014). Thereby, stomata and flag leaf characteristics have been widely used as indicators of water loss from plant leaves and suggested as efficient tools to evaluate drought tolerance (
Zhang et al. 2006;
Ahsan et al. 2008;
Xu and Zhou 2008). Furthermore, drought tolerance of a plant is related to its ability to maintain high relative water content in the leaves under stress condition. Relative water content, therefore, can be also considered as an important indicator of plant water status under drought stress (
Almeselmani et al. 2011;
Arjenaki et al. 2012).
Among six durum wheat genotypes, G3 (Svevo) exhibited the lowest STF as well as the highest RWC and Chl.a, while G6 (WK-12-1) showed greater FLW, FLD, Chl.b, GYP and TKW under drought stress condition. The lowest reduction percentage resulting by drought stress was also obtained by G6. In addition, G3 (Svevo) and G6 (WK-12-1) showed the lowest DSI values (0.81 and 0.67, respectively). Out of twelve bread wheat genotypes, G11 (L.S-15) had lowest STF and larger FLA, FLW, FLD, Chl.a, Chl.b and TKW under drought stress condition. The lowest reduction percentage resulting by drought stress was also obtained by G11 (L.S-15). Meantime, G11 (L.S-15) and G16 (SIDS-1) showed the lowest DSI values (0.63 and 0.83, respectively). These results suggested that G3 (Svevo) and G6 (WK-12-1) could be considered as the most drought-tolerant durum wheat genotypes, whereas G11 (L.S-15) and G16 (SIDS-1) could be considered as the most drought-tolerant bread wheat genotypes. In this regard, it has been reported that breeding high-yielding wheat might be achieved by selecting cultivars for low stomatal density (
Liao et al. 2005). In addition, wheat genotypes having higher RWC were more tolerant to drought stress than those with low RWC (
Bayoumi et al. 2008;
Arjenaki et al. 2012). Similarly,
Bayoumi et al. (2008) found that superior wheat genotypes under drought stress condition gave higher RWC and had lower DSI. The DSI values, therefore, indicated the potential for screening wheat genotypes under drought stress conditions. Moreover, flag-leaf area has indirect effects on the grain yield of wheat plants. The greater flag leaf area, which can capture more energy from the sunlight, leads to higher photosynthetic rates and consequently higher grain yield. In addition, drought-tolerant and high-yielding wheat genotypes exhibited the highest chlorophyll content (
Arjenaki et al. 2012). Therefore, chlorophyll content can be used as an indicator for drought tolerance.
The SSR markers analysis supported the presence of sufficient genetic diversity within wheat genotypes with 61.4% averaged polymorphism. The PIC values ranged from 0.20 to 0.48, with an average of 0.33, indicating remarkable differences in the allelic diversity among SSRs loci. The A genome contained the highest number of alleles (4.8 per marker) followed by B (3.7 per marker) and D (2.0 per marker) genomes. However, the B genome showed higher polymorphism (77.1%) compared to A (57.8%) and D (50.0%) genomes. This result was in accordance with a previous result by
El-Rawy (2020). Similarly,
Chao et al. (2007) found a high polymorphism among wheat genotypes in the B genome. Furthermore, abundance microsatellite distribution was found on chromosomes of the B genome followed by chromosomes of A and D genomes (
Jaiswal et al. 2017). Moreover, of the three genomes of hexaploid wheat, the D-genome has the least diversity (
Dubcovsky and Dvorak 2007). Evidently, SSRs are preferable over other molecular markers and represent the most suitable marker system in wheat (
Sharma et al. 2021). Therefore, several hundred SSRs have been developed for the three genomes of wheat and widely used for the genetic diversity estimates (
Landjeva et al. 2006). Furthermore, improvement of wheat grain yield under drought stress can be achieved by marker-assisted breeding (
Shokat et al. 2020).
Cluster analysis based on phenotypic data classified the tested genotypes into two groups, of which cluster-I contained the most drought tolerant genotypes identified, however, the other tolerant genotypes were distributed in cluster-II, suggesting that several traits could be contributed to drought tolerance. In this regard, cluster analysis has been successfully used to assess the genetic diversity and grouping wheat genotypes based on similar characteristics under stress conditions (
El-Rawy and Hassan 2014;
Hassan 2016;
Jamali et al. 2020). Meanwhile, cluster analysis based on SSR markers was able to differentiate between durum and bread wheat genotypes, supporting the effectiveness of SSR markers in discriminating wheat genotypes based on ploidy levels, as reported by
Gurcan et al. (2017). In addition, SSR markers were effective to determine the genetic relationships and genetic distances among the tested wheat genotypes. Accordingly, the genetic diversity in wheat was successfully assessed based on phenotypic data as well as SSR markers (
Salem et al. 2015;
Hassan 2016;
Gurcan et al. 2017;
Phougat et al. 2018;
Ali et al. 2019;
Slim et al. 2019;
Yang et al. 2020;
Haque et al. 2021).
In conclusion, the results indicated the existence of abundant genetic diversity between and within durum and bread wheat genotypes for several traits related to drought tolerance. Moreover, SSR markers analysis indicated the presence of considerable genetic variation among wheat genomes. In addition, the results indicated the potential of finding useful associations between specific SSR markers and drought tolerance. Drought-tolerant wheat genotypes identified in the present study could be used as valuable genetic resources for improvement of drought tolerance in wheat. Morpho-physiological traits and SSR markers were effective for assessment of the genetic diversity in durum and bread wheat genotypes.
SUPPLEMENTARY MATERIALS
Fig. 1Dendrograms showing the genetic relationships among six durum and twelve bread wheat genotypes based on phenotypic data (A) and thirty SSR markers (B). DSI: values of drought susceptibility index of the studied genotypes. G1: BeniSuef-1, G2: BeniSuef-5, G3: Svevo, G4: Ciccio, G5: Sohag-3, G6: WK-12-1, G7: Line-6, G8: Pavon-F76, G9: KBG-01, G10: Gemmeiza-7, G11: L.S-15, G12: L.S-16, G13: Sakha-8, G14: L.1x15, G15: CHAM-8, G16: SIDS-1, G17: Giza-168 and G18: Sonora-64.

Table 1Names, pedigree and origin of durum and bread wheat genotypes used in the study.
Table 1
|
No. |
Name |
Pedigree/History |
Origin |
|
Durum wheat |
G1 |
BeniSuef-1 |
JO"S"/AA"S"/FG"S" |
Egypt |
|
G2 |
BeniSuef-5 |
DIPPER-2/BUCHEN-3 |
Egypt |
|
G3 |
Svevo |
Cimmyt’s Line/Zenit |
Italy |
|
G4 |
Ciccio |
F6 Appulo/Valnova//F5 Valforte/Patrizio |
Italy |
|
G5 |
Sohag-3 |
MEXICALI/MAGHREBI72//51792/DURUM#6 |
Egypt |
|
G6 |
WK-12-1 |
Black-glumed landrace |
Egypt |
|
Bread wheat |
G7 |
Line-6 |
Advanced long-spike, short statured inbred line |
Egypt |
|
G8 |
Pavon-F76 |
VCM//CNO/7C/3/KAL/BB |
Mexico |
|
G9 |
KBG-01 |
300-SM-501-M/HAR-1709 |
Ethiopia |
|
G10 |
Gemmeiza-7 |
CMH74A.630/5X//SERI82/3/AGENT |
Egypt |
|
G11 |
L.S-15 |
Advanced long-spike inbred line |
Egypt |
|
G12 |
L.S-16 |
Advanced long-spike inbred line |
Egypt |
|
G13 |
Sakha-8 |
CNO67//SN64/KLRE/3/8156 |
Egypt |
|
G14 |
L.1 × 15 |
Advanced early maturing inbred line |
Egypt |
|
G15 |
CHAM-8 |
Kauz (CM67458) |
Syria |
|
G16 |
SIDS-1 |
HD2173/PAVON"S"//1158.57/MAYA 74 "S" |
Egypt |
|
G17 |
Giza-168 |
MIL/BUC//SERI |
Egypt |
|
G18 |
Sonora-64 |
YAKTANA-54//NORIN-0/BREVOR/3/2*YAQUI-54 |
Mexico |
Table 2Means of the studied traits of wheat genotypes under favorable (E1) and drought stress (E2) environments (Env.).
Table 2
|
Genotype |
Env. |
Traits |
|
STF |
RWC |
FLA |
FLW |
FLD |
Chl.a |
Chl.b |
GYP |
TKW |
|
Durum wheat |
G1 |
E1
|
67.45 |
76.95 |
21.84 |
1.31 |
52.88 |
34.56 |
31.20 |
72.16 |
53.57 |
|
E2
|
54.55 |
73.36 |
13.04 |
0.96 |
46.07 |
27.93 |
24.54 |
58.78 |
46.52 |
|
G2 |
E1
|
69.16 |
81.45 |
21.62 |
1.39 |
46.22 |
36.84 |
22.65 |
84.04 |
55.70 |
|
E2
|
55.76 |
77.27 |
13.35 |
0.88 |
44.56 |
28.41 |
16.50 |
68.69 |
50.10 |
|
G3 |
E1
|
72.50 |
90.25 |
17.69 |
1.13 |
51.81 |
48.52 |
30.20 |
75.40 |
52.57 |
|
E2
|
52.95 |
82.98 |
14.67 |
0.90 |
45.29 |
38.32 |
24.37 |
64.49 |
45.13 |
|
G4 |
E1
|
74.78 |
83.38 |
18.27 |
1.46 |
51.47 |
41.92 |
22.95 |
74.50 |
51.83 |
|
E2
|
63.98 |
72.44 |
15.44 |
1.02 |
47.14 |
31.92 |
16.30 |
60.51 |
42.33 |
|
G5 |
E1
|
72.21 |
88.51 |
21.91 |
1.51 |
50.40 |
37.82 |
22.64 |
84.35 |
56.20 |
|
E2
|
57.56 |
79.63 |
14.36 |
0.92 |
45.21 |
31.64 |
20.42 |
65.23 |
51.97 |
|
G6 |
E1
|
84.14 |
90.56 |
20.43 |
1.53 |
44.36 |
36.11 |
34.96 |
78.06 |
60.47 |
|
E2
|
60.59 |
79.87 |
15.13 |
1.12 |
48.38 |
28.75 |
31.32 |
68.79 |
57.93 |
|
Mean |
E1
|
73.37 |
85.18 |
20.29 |
1.39 |
49.52 |
39.30 |
27.43 |
78.09 |
55.06 |
|
E2
|
57.56 |
77.59 |
14.33 |
0.97 |
46.11 |
31.16 |
22.24 |
64.42 |
49.00 |
|
Bread wheat |
G7 |
E1
|
53.89 |
87.07 |
31.59 |
2.92 |
50.30 |
41.52 |
52.96 |
101.06 |
55.43 |
|
E2
|
50.75 |
81.67 |
20.14 |
1.71 |
47.14 |
33.18 |
45.98 |
82.40 |
52.40 |
|
G8 |
E1
|
63.54 |
77.81 |
28.10 |
1.30 |
63.27 |
33.62 |
39.5 |
82.42 |
47.60 |
|
E2
|
58.57 |
74.24 |
15.35 |
0.84 |
48.99 |
28.08 |
23.63 |
67.90 |
39.63 |
|
G9 |
E1
|
60.07 |
91.33 |
21.71 |
1.46 |
63.53 |
40.65 |
32.45 |
95.96 |
54.87 |
|
E2
|
45.50 |
84.21 |
20.28 |
1.47 |
54.52 |
27.41 |
21.39 |
76.08 |
46.90 |
|
G10 |
E1
|
57.82 |
88.32 |
27.53 |
2.12 |
55.54 |
44.12 |
35.12 |
81.44 |
57.27 |
|
E2
|
52.74 |
78.41 |
18.07 |
1.54 |
50.72 |
39.16 |
22.96 |
66.29 |
49.20 |
|
G11 |
E1
|
54.69 |
90.22 |
36.00 |
2.35 |
58.16 |
44.63 |
65.52 |
95.61 |
59.10 |
|
E2
|
40.52 |
82.38 |
26.40 |
1.79 |
57.61 |
40.64 |
62.48 |
84.86 |
55.30 |
|
G12 |
E1
|
55.63 |
90.49 |
32.94 |
2.09 |
61.23 |
33.23 |
24.53 |
105.89 |
55.50 |
|
E2
|
42.72 |
83.80 |
19.37 |
1.30 |
55.44 |
30.99 |
21.29 |
85.55 |
52.03 |
|
G13 |
E1
|
67.79 |
92.31 |
20.02 |
1.17 |
42.82 |
33.62 |
25.64 |
96.84 |
58.27 |
|
E2
|
57.36 |
80.26 |
18.02 |
0.85 |
36.62 |
27.31 |
23.39 |
77.19 |
53.90 |
|
G14 |
E1
|
50.28 |
80.88 |
19.56 |
1.03 |
46.65 |
27.5 |
55.63 |
81.30 |
54.97 |
|
E2
|
50.60 |
77.52 |
15.27 |
0.69 |
43.22 |
24.12 |
54.87 |
66.52 |
48.17 |
|
G15 |
E1
|
59.97 |
88.51 |
22.72 |
1.28 |
54.12 |
38.19 |
24.99 |
80.04 |
53.20 |
|
E2
|
46.27 |
84.11 |
13.76 |
0.66 |
52.71 |
32.6 |
21.77 |
64.98 |
45.07 |
|
G16 |
E1
|
57.64 |
85.51 |
22.77 |
2.15 |
51.15 |
25.63 |
23.67 |
86.43 |
54.27 |
|
E2
|
44.92 |
80.60 |
18.73 |
1.17 |
46.82 |
19.35 |
20.21 |
73.69 |
51.03 |
|
G17 |
E1
|
55.14 |
88.52 |
25.25 |
1.55 |
55.59 |
27.16 |
57.62 |
91.94 |
50.20 |
|
E2
|
44.59 |
73.16 |
16.64 |
0.84 |
47.48 |
22.64 |
55.32 |
74.37 |
48.27 |
|
G18 |
E1
|
57.61 |
83.91 |
21.08 |
1.23 |
52.51 |
32.28 |
35.61 |
79.75 |
53.97 |
|
E2
|
52.34 |
71.63 |
13.60 |
0.72 |
48.65 |
21.55 |
33.86 |
64.78 |
45.53 |
|
Mean |
E1
|
57.84 |
87.07 |
25.77 |
1.72 |
54.57 |
35.18 |
39.44 |
89.89 |
54.55 |
|
E2
|
48.91 |
79.33 |
17.97 |
1.13 |
49.16 |
28.92 |
33.93 |
73.72 |
48.95 |
|
LSD(0.05)
|
E1
|
6.32 |
3.90 |
3.68 |
0.36 |
4.22 |
4.45 |
9.54 |
6.83 |
3.19 |
|
E2
|
4.65 |
3.20 |
2.38 |
0.25 |
3.44 |
4.14 |
10.17 |
5.62 |
3.26 |
Table 3Mean squares of the combined analysis of variance and heritability estimates.
Table 3
|
Source of variance |
d.f |
Mean squares of the studied traits |
|
STF |
RWC |
FLA |
FLW |
FLD |
Chl.a |
Chl.b |
GYP |
TKW |
|
Environments (E) |
1 |
4072.5**
|
194.6*
|
1438.9**
|
7.85**
|
220.7**
|
456.3**
|
399.1**
|
1865.9**
|
84.1**
|
|
Replicates within E |
4 |
10.4 |
20.7 |
33.6 |
0.18**
|
17.8 |
26.9 |
25.0 |
454.8**
|
13.9 |
|
Genotypes (G) |
17 |
658.1**
|
336.9**
|
102.4**
|
1.03**
|
180.6**
|
83.0**
|
107.4**
|
525.3**
|
331.3**
|
|
Durum (D) |
5 |
204.7**
|
169.8**
|
16.7 |
0.09 |
35.8 |
44.9**
|
99.3**
|
161.8**
|
158.2**
|
|
Bread (B) |
11 |
320.0**
|
408.3**
|
101.9**
|
1.41**
|
241.9**
|
93.4**
|
110.5**
|
525.0**
|
281.0**
|
|
D vs B |
1 |
6643.6**
|
387.6**
|
535.8**
|
1.59**
|
229.6**
|
159.2**
|
113.5**
|
2346.7**
|
1749.9**
|
|
G × E |
17 |
120.1**
|
112.9**
|
19.0*
|
0.11*
|
43.6**
|
27.2**
|
22.7**
|
80.2**
|
45.4**
|
|
Error |
68 |
20.2 |
46.1 |
10.1 |
0.05 |
17.1 |
4.9 |
9.1 |
30.6 |
7.8 |
|
Broad-sense heritability (h2B) |
0.63 |
0.35 |
0.52 |
0.69 |
0.47 |
0.43 |
0.51 |
0.61 |
0.70 |
Table 4Yield-based drought tolerance indices of durum and bread wheat genotypes.
Table 4
|
Genotype |
Yp |
Ys |
RED |
MP |
GMP |
HM |
DSI |
|
Durum wheat |
G1 |
72.16 |
58.78 |
18.54 |
65.47 |
65.13 |
64.79 |
1.04 |
|
G2 |
84.04 |
68.69 |
18.27 |
76.37 |
75.98 |
75.59 |
1.02 |
|
G3 |
75.40 |
64.49 |
14.47 |
69.95 |
69.73 |
69.52 |
0.81 |
|
G4 |
74.50 |
60.51 |
18.78 |
67.51 |
67.14 |
66.78 |
1.05 |
|
G5 |
84.35 |
65.23 |
22.67 |
74.79 |
74.18 |
73.57 |
1.27 |
|
G6 |
78.06 |
68.79 |
11.88 |
73.43 |
73.28 |
73.13 |
0.67 |
|
Bread wheat |
G7 |
101.06 |
82.40 |
18.46 |
91.73 |
91.25 |
90.78 |
1.03 |
|
G8 |
82.42 |
67.90 |
17.62 |
75.16 |
74.81 |
74.46 |
0.99 |
|
G9 |
95.96 |
76.08 |
20.72 |
86.02 |
85.44 |
84.87 |
1.16 |
|
G10 |
81.44 |
66.29 |
18.60 |
73.87 |
73.48 |
73.09 |
1.04 |
|
G11 |
95.61 |
84.86 |
11.24 |
90.24 |
90.07 |
89.91 |
0.63 |
|
G12 |
105.89 |
85.55 |
19.21 |
95.72 |
95.18 |
94.64 |
1.08 |
|
G13 |
96.84 |
77.19 |
20.29 |
87.02 |
86.46 |
85.91 |
1.14 |
|
G14 |
81.30 |
66.52 |
18.18 |
73.91 |
73.54 |
73.17 |
1.02 |
|
G15 |
80.04 |
64.98 |
18.82 |
72.51 |
72.12 |
71.73 |
1.05 |
|
G16 |
86.43 |
73.69 |
14.74 |
80.06 |
79.81 |
79.55 |
0.83 |
|
G17 |
91.94 |
74.37 |
19.11 |
83.16 |
82.69 |
82.23 |
1.07 |
|
G18 |
79.75 |
64.78 |
18.77 |
72.27 |
71.88 |
71.49 |
1.05 |
Table 5Correlation coefficients among the studied traits under drought stress condition.
Table 5
|
Traits |
STF |
RWC |
FLA |
FLW |
FLD |
Chl.a |
Chl.b |
GYP |
TKW |
|
STF |
1.00 |
‒0.48*
|
‒0.58*
|
‒0.37 |
‒0.59**
|
‒0.01 |
‒0.44 |
‒0.62**
|
‒0.20 |
|
RWC |
|
1.00 |
0.49*
|
0.44 |
0.33 |
0.42 |
‒0.06 |
0.54*
|
0.45 |
|
FLA |
|
|
1.00 |
0.83**
|
0.50*
|
0.35 |
0.45 |
0.83**
|
0.47*
|
|
FLW |
|
|
|
1.00 |
0.54*
|
0.51*
|
0.23 |
0.63**
|
0.45 |
|
FLD |
|
|
|
|
1.00 |
0.36 |
0.15 |
0.36 |
‒0.01 |
|
Chl.a |
|
|
|
|
|
1.00 |
0.03 |
0.11 |
0.11 |
|
Chl.b |
|
|
|
|
|
|
1.00 |
0.40 |
0.29 |
|
GYP |
|
|
|
|
|
|
|
1.00 |
0.57*
|
|
TKW |
|
|
|
|
|
|
|
|
1.00 |
Table 6Polymorphism detected among wheat genotypes using 30 SSR markers.
Table 6
|
Marker |
TAB |
NPB |
POL |
PIC |
MI |
|
Xgwm497-1A |
10 |
3 |
30.0 |
0.35 |
1.05 |
|
Xgwm294-2A |
2 |
2 |
100.0 |
0.48 |
0.96 |
|
Xgwm155-3A |
9 |
8 |
88.9 |
0.25 |
2.00 |
|
Xgwm160-4A |
13 |
2 |
15.4 |
0.27 |
0.54 |
|
Xgwm695-4A |
11 |
5 |
45.5 |
0.43 |
2.15 |
|
Xgwm186-5A |
10 |
9 |
90.0 |
0.30 |
2.70 |
|
Xgwm291-5A |
3 |
2 |
66.7 |
0.28 |
0.56 |
|
Xgwm459-6A |
10 |
9 |
90.0 |
0.42 |
3.78 |
|
Xgwm260-7A |
7 |
4 |
57.1 |
0.34 |
1.36 |
|
Xwmc596-7A |
8 |
4 |
50.0 |
0.20 |
0.80 |
|
Genome A |
83 |
48 |
57.8 |
0.33 |
1.59 |
|
Xgwm18-1B |
4 |
3 |
75.0 |
0.29 |
0.87 |
|
Xgwm111-2B |
3 |
2 |
66.7 |
0.24 |
0.48 |
|
Xgwm389-3B |
4 |
3 |
75.0 |
0.40 |
1.20 |
|
Xgwm566-3B |
4 |
3 |
75.0 |
0.32 |
0.96 |
|
Xgwm513-4B |
5 |
4 |
80.0 |
0.47 |
1.88 |
|
Xgwm408-5B |
6 |
5 |
83.3 |
0.30 |
1.50 |
|
Xgwm626-6B |
7 |
6 |
85.7 |
0.27 |
1.62 |
|
Xwmc398-6B |
8 |
6 |
75.0 |
0.28 |
1.68 |
|
Xgwm573-7B |
3 |
3 |
100.0 |
0.41 |
1.23 |
|
Xgwm577-7B |
4 |
2 |
50.0 |
0.42 |
0.84 |
|
Genome B |
48 |
37 |
77.1 |
0.34 |
1.23 |
|
Xgwm458-1D |
2 |
1 |
50.0 |
0.40 |
0.40 |
|
Xgwm261-2D |
2 |
1 |
50.0 |
0.28 |
0.28 |
|
Xgwm484-2D |
8 |
5 |
62.5 |
0.29 |
1.45 |
|
Xgwm3-3D |
3 |
2 |
66.7 |
0.28 |
0.56 |
|
Xgwm165-4D |
2 |
1 |
50.0 |
0.28 |
0.28 |
|
Xgwm174-5D |
7 |
1 |
14.3 |
0.47 |
0.47 |
|
Xgwm182-5D |
2 |
1 |
50.0 |
0.44 |
0.44 |
|
Xgwm325-6D |
3 |
2 |
66.7 |
0.27 |
0.54 |
|
Xgwm437-7D |
2 |
1 |
50.0 |
0.28 |
0.28 |
|
Xgwm635-7D |
9 |
5 |
55.6 |
0.24 |
1.20 |
|
Genome D |
40 |
20 |
50.0 |
0.32 |
0.59 |
|
Total |
171 |
105 |
- |
- |
- |
|
Overall mean |
5.7 |
3.5 |
61.4 |
0.33 |
1.15 |
Table 7Specific bands (alleles) detected for some wheat genotypes using SSR markers.
Table 7
|
Marker |
Genotypes |
|
Durum |
Bread |
G1 |
G2 |
G11 |
G16 |
G17 |
|
Xgwm497-1A |
(+) 312 |
(‒) 312 |
|
|
|
|
|
|
Xgwm155-3A |
(+) 120 |
(‒) 120 |
|
|
|
|
|
|
Xgwm160-4A |
|
|
|
|
|
|
(+) 491 |
|
Xgwm695-4A |
(‒) 610 |
(+) 610 |
|
|
|
|
|
|
Xgwm186-5A |
(‒) 298 |
(+) 298 |
|
|
|
|
|
|
Xgwm260-7A |
|
|
|
|
(+) 345 |
(+) 345 |
|
|
Xgwm408-5B |
|
|
(‒) 365 |
(‒) 365 |
|
|
|
|
Xgwm573-7B |
|
|
|
|
(+) 221 |
(+) 221 |
|
|
Xgwm577-7B |
(‒) 255 |
(+) 255 |
|
|
|
|
|
|
Xgwm182-5D |
(‒) 532 |
(+) 532 |
|
|
|
|
|
References
- Ahmad Z, Waraich EA, Akhtar S, Anjum S, Ahmad T, Mahboob W, et al. 2018. Physiological responses of wheat to drought stress and its mitigation approaches. Acta Physiol. Plant.. 40: 80
- Ahsan M, Hader MZ, Saleem M, Aslam M. 2008. Con-tribution of various leaf morpho-physiological para-meterstowards grain yield in maize. Int. J. Agr. Biol.. 10: 546-550.
- Ali Y, Khan M, Hussain M, Atiq M, Ahmad J. 2019. An assessment of the genetic diversity in selected wheat lines using molecular markers and PCR-based cluster analysis. Appl. Ecol. Env. Res.. 17: 931-950.
- Almeselmani M, Abdullah F, Hareri F, Naaesan M, Adel Ammar M, ZuherKanbar O, et al. 2011. Effect of drought on different physiological characters and yield component in different varieties of Syrian durum wheat. J. Agric. Sci.. 3: 127-133.
- Arjenaki FG, Jabbari R, Morshedi A. 2012. Evaluation of drought stress on relative water content, chlorophyll content and mineral elements of wheat (Triticum aestivum L.) varieties. Int. J. Agric. Crop Sci.. 4: 726-729.
- Arnon DI. 1949. Copper enzymes in isolated chloroplasts. Polyphenoloxidase in Beta vulgaris. Plant Physiol.. 24: 1-15.
- Bajjii M, Lutts S, Kinet KM. 2001. Water deficit effects on solute contribution to osmotic adjustment as a function of leaf ageing in three durum wheat (Triticum durum Desf) cultivars performing in arid conditions. Plant Sci.. 60: 669-681.
- Bayoumi TY, Eid MH, Metwali EM. 2008. Application of physiological and biochemical indices as a screening technique for drought tolerance in wheat genotypes. Afr. J. Biotechnol.. 7: 2341-2352.
- Bennett D, Reynolds M, Mullan D, Izanloo A, Kuchel H, Langridge P, et al. 2012. Detection of two major grain yield QTL in bread wheat (Triticum aestivum L.) under heat, drought and high yield potential environments. Theor. Appl. Genet.. 25: 1473-1485.
- Boussakouran A, Sakar E, El Yamani M, Rharrabti Y. 2019. Morphological Traits Associated with Drought Stress Tolerance in Six Moroccan Durum Wheat Varieties Released Between 1984 and 2007. J. Crop Sci. Biotechnol.. 22: 345-353.
- Chao SM, Zhang WJ, Dubcovsky J, Sorrells M. 2007. Evaluation of genetic diversity and genomewide linkage disequilibrium among U.S. wheat (Triticum aestivum L.) germplasm representing different market classes. Crop Sci.. 47: 1018-1030.
- Chen X, Min D, Yasir TA, Hu YG. 2012. Evaluation of 14 morphological, yield-related and physiological traits as indicators of drought tolerance in Chinese winter bread wheat revealed by analysis of the membership function value of drought tolerance (MFVD). Field Crop Res.. 137: 195-201.
- Dodig D, Zorić M, Kobiljski B, Surlan-Momirovic G, Quarrie S. 2010. Assessing drought tolerance and regional patterns of genetic diversity among spring and winter bread wheat using simple sequence repeats and phenotypic data. Crop Pasture Sci.. 61: 812-824.
- Dubcovsky J, Dvorak J. 2007. Genome plasticity a key factor in the success of polyploid wheat under domestication. Science. 316: 1862-1866.
- Eid M. 2018. Validation of SSR Molecular Markers Linked to Drought Tolerant in Some Wheat Cultivars. J. Plant Breed. Genet.. 6: 95-109.
- El-Rawy MA, Hassan MI. 2014. Effectiveness of drought tolerance indices to identify tolerant genotypes in bread wheat (Triticum aestivum L.). J. Crop Sci. Biotechnol.. 17: 255-266.
- El-Rawy MA. 2020. Assessment of genetic diversity for some Egyptian wheat varieties based on morphological characters and SSR markers. SJAS.. 2: 144-160.
- Faheem M, Mahmood T, Shabbir G, Akhtar N, Kazi AG, Kazi AM. 2015. Assessment of D-genome based genetic diversity in drought tolerant wheat germplasm. Int. J. Agric. Biol.. 17: 791-796.
- Farshadfar E, Moradi Z, Elyasi P, Jamshidi B, Chaghakabodi R. 2012. Effective selection criteria for screening drought tolerant landraces of bread wheat (Triticum aestivum L.). Ann. Biol. Res.. 3: 2507-2516.
- Fernandez GCJ. Kuo CG, 1992. Effective selection criteria for assessing plant stress tolerance. editor. Proceedings of the international symposium on adaptation of vegetables and other food crops in temperature and water stress. AVRDC Publication. Tainan, Taiwan.
- Fischer RA, Maurer R. 1978. Drought resistance in spring wheat cultivar I: Grain yield responses. Aust. J. Agric. Res.. 29: 897-912.
- Fleury D, Jefferies S, Kuchel H, Langridge P. 2010. Genetic and genomic tools to improve drought tolerance in wheat. J. Exp. Bot.. 61: 3211-3222.
- Fotovat R, Valizadeh M, Toorehi M. 2007. Association between water-use-efficiency components and total chlorophyll content (SPAD) in wheat (Triticum aestivum L.) under well-watered and drought stress conditions. J. Food Agric. Environ.. 5: 225-227.
- Gurcan K, Demirel F, Tekin M, Demirel S, Akar T. 2017. Molecular and agro-morphological characterization of ancient wheat landraces of Turkey. BMC Plant Biol.. 17: 171
- Haque MS, Saha NR, Islam MT, Islam MM, Kwon S, Roy SK, et al. 2021. Screening for drought tolerance in wheat genotypes by morphological and SSR markers. J. Crop Sci. Biotechnol.. 24: 27-39.
- Hassan MI. 2016. Assessment of genetic diversity in bread wheat genotypes based on heat tolerance and SSR markers. Assiut J. Agric. Sci.. 47: 37-55.
- Hill CB, Taylor JD, Edwards J, Mather D, Bacic A, Langridge P, et al. 2013. Whole-genome mapping of agronomic and metabolic traits to identify novel quantitative trait loci in bread wheat grown in a water-limited environment. Plant Physiol.. 162: 1266-1281.
- Hossain A, Teixeira da Silva JA, Lozovskaya MV, Zvolinsky VP. 2012. High temperature combined with drought affect rainfed spring wheat and barley in South-Eastern Russia: I. Phenology and growth. Saudi J. Biol. Sci.. 19: 473-487.
- Iqbal MS, Singh AK, Ansari MI. Rakshit A, Singh H, Singh A, Singh U, Fraceto L, 2020. Effect of drought stress on crop production. editors. New frontiers in stress management for durable agriculture. Springer. New York, U. S. A:
- Jaiswal S, Sheoran S, Arora V, Angadi UB, Iquebal MA, Raghav N, et al. 2017. Putative microsatellite DNA marker-based wheat genomic resource for varietal improvement and management. Front. Plant Sci.. 8: 2009
- Jamali A, Sohrabi Y, Siose MA, Hoseinpanahi F. 2020. Morphological and yield responses of 20 genotypes of bread wheat to drought stress. Arch. Biol. Sci.. 72: 71-79.
- Karrou M, Maranville JW. 1995. Response of wheat cultivars to different soil nitrogen and moisture regimes: II. Leaf water content, stomatal conductance and photosynthesis. J. Plant. Nutr.. 18: 777-791.
- Kato K, Miura H, Sawada S. 2000. Mapping QTLs controlling grain yield and its components on chromosome 5A of wheat. Theor. Appl. Genet.. 101: 1114-1121.
- Khan AA, Shamsuddin AKM, Barma NCD, Alam MK, Alam MA. 2015. Screening for heat tolerance in spring wheat (Triticum aestivum L.). Trop. Agric. Res. Extension. 17: 26-37.
- Khazaei H, Monneveux P, Hongbo S, Mohammady S. 2010. Variation for stomatal characteristics and water use efficiency among diploid, tetraploid and hexaploid Iranian wheat landraces. Genet. Resour. Crop Evol.. 57: 307-314.
- Kuchel H, Williams KJ, Langridge P, Eagles HA, Jefferies SP. 2007. Genetic dissection of grain yield in bread wheat. I. QTL analysis. Theor. Appl. Genet.. 115: 1029-1041.
- Landjeva S, Korzun V, Ganeva G. 2006. Evaluation of genetic diversity among Bulgarian winter wheat (Triticum aestivum L.) cultivars during the period 1925-2003 using microsatellites. Genet. Resour. Crop Evol.. 53: 1605-1614.
- Liao J, Chang J, Wang G. 2005. Stomatal density and gas exchange in six wheat cultivars. Cereal Res. Commun.. 33: 719-726.
- Maccaferri M, Sanguineti MC, Corneti S, Ortega JLA, Salem MB, Bort J, et al. 2008. Quantitative trait loci for grain yield and adaptation of durum wheat (Triticum durum) across a wide range of water availability. Genetics. 178: 489-511.
- Maccaferri M, Stefanelli S, Rotondo F, Tuberosa R, Sanguineti MC. 2007. Relationships among durum wheat accessions. I. Comparative analysis of SSR, AFLP, and phenotypic data. Genome. 50: 373-384.
- Mantovani P, Maccaferri M, Sanguineti MC, Tuberosa R, Catizone I, Wenzl P, et al. 2008. An integrated DArT-SSR linkage map of durum wheat. Mol. Breed.. 22: 629-648.
- McCartney C, Somers D, Humphreys D, Lukow O, Ames N, Noll J, et al. 2005. Mapping quantitative trait loci controlling agronomic traits in the spring wheat cross rl4452×'ac domain'. Genome. 48: 870-883.
- Merchuk-Ovnat L, Barak V, Fahima T, Ordon F, Lidzbarsky GA, Krugman T, et al. 2016. Ancestral QTL alleles from wild emmer wheat improve drought resistance and productivity in modern wheat cultivars. Front. Plant Sci.. 7: 452
- Murray MG, Thompson WF. 1980. Rapid isolation of high molecular weight plant DNA. Nucleic Acids Res.. 8: 4321-4325.
- Phougat D, Panwar IS, Punia MS, Sethi SK. 2018. Microsatellite markers-based characterization in advance breeding lines and cultivars of bread wheat. J. Environ. Biol.. 39: 339-346.
- Pinto RS, Reynolds MP, Mathews KL, McIntyre CL, Olivares-Villegas JJ, Chapman SC. 2010. Heat and drought adaptive qtl in a wheat population designed to minimize confounding agronomic effects. Theor. Appl. Genet.. 121: 1001-1021.
- Pirasteh-Anosheh H, Saed-Moucheshi A, Pakniyat H, Pessarakli M. Ahmad P, 2016. Stomatal responses to drought stress. editor. water stress and crop plants: a sustainable approach. John Wiley & Sons, Ltd.. Hoboken, New Jersey, U.S.A:
- Powell W, Morgante M, Andre C, Hanafey M, Vogel J, Tingey S, et al. 1996. The comparison of RFLP, RAPD, AFLP and SSR (microsatellite) markers for gemplasm analysis. Mol. Breed.. 2: 225-238.
- Quarrie SA, Quarrie SP, Radosevic R, Rancic D, Kaminska A, Barnes JD, et al. 2006. Dissecting a wheat QTL for yield present in a range of environments: from the QTL to candidate genes. J. Exp. Bot.. 57: 2627-2637.
- Quarrie SA, Steed A, Calestani C, Semikhodskii A. 2005. A high-density genetic map of hexaploid wheat (Triticum aestivum L.) from the cross Chinese Spring×SQ1 and its use to compare QTLs for grain yield across a range of environments. Theor. Appl. Genet.. 110: 865-880.
- Roldan-Ruiz I, Dendauw J, Vanbockstaele E, Depicker A, De Loose M. 2000. AFLP markers reveal high polymorphic rates in ryegrasses (Lolium spp.). Mol. Breed.. 6: 125-134.
- Rosielle AA, Hamblin J. 1981. Theoretical aspects of selection for yield in stress and non-stress environments. Crop Sci.. 21: 943-946.
- Pierre CS, Crossa JL, Bonnett D, Yamaguchi-Shinozaki K, Reynolds MP. 2012. Phenotyping transgenic wheat for drought resistance. J. Exp. Bot.. 63: 1799-1808.
- Saleem B, Khan AS, Shahzad MT, Ijaz F. 2016. Estimation of heritability and genetic advance for various metric traits in seven F2 populations of bread wheat (Triticum aestivum L.). J. Agric. Sci.. 61: 1-9.
- Salem KFM, Roder MS, Borner A. 2015. Assessing genetic diversity of Egyptian hexaploid wheat (Triticum aestivum L.) using microsatellite markers. Genet. Resour. Crop Evol.. 62: 377-385.
- Sayar R, Khemira H, Kameli A, Mosbahi M. 2008. Physiological tests as predictive appreciation for drought tolerance in durum wheat (Triticum durum Desf.). Agron. Res.. 6: 79-90.
- Shah SH, Houborg R, McCabe MF. 2017. Response of Chlorophyll, Carotenoid and SPAD-502 Measurement to Salinity and Nutrient Stress in Wheat (Triticum aestivum L.). Agronomy. 7: 61
- Sharma P, Mehta G, Shefali , Muthusamy SK, Singh SK, Singh GP. 2021. Development and validation of heat-responsive candidate gene and miRNA gene based SSR markers to analysis genetic diversity in wheat for heat tolerance breeding. Mol. Biol. Rep.. 48(1): 381-393.
- Shokat S, Sehgal D, Vikram P, Liu F, Singh S. 2020. Molecular markers associated with agro-physiological traits under terminal drought conditions in bread wheat. Int. J. Mol. Sci.. 21: 3156
- Shukla S, Singh K, Patil R V, Kadam S, Bharti S, Prasad P, et al. 2015. Genomic regions associated with grain yield under drought stress in wheat (Triticum aestivum L.). Euphytica. 203: 449-467.
- Slim A, Piarulli L, Kourda CH, Rouaissi M, Robbana C, Chaabane R, et al. 2019. Genetic Structure Analysis of a Collection of Tunisian Durum Wheat Germplasm. Int. J. Mol. Sci.. 20: 3362
- Touzy G, Rincent R, Bogard M, Lafarge S, Dubreuil P, Mini A, et al. 2019. Using environmental clustering to identify specific drought tolerance QTLs in bread wheat (T. aestivum L). Theor. Appl. Genet.. 132: 2859-2880.
- Tyagi V, Nagargade M, Singh RK. Rakshit A, Singh H, Singh A, Singh U, Fraceto L, 2020. Agronomic interventions for drought management in crops. editors. New frontiers in stress management for durable agriculture. Springer. New York, U. S. A:
- Xu Z, Zhou G. 2008. Responses of leaf stomatal density to water status and its relationship with photosynthesis in a grass. J. Exp. Bot.. 59: 3317-3325.
- Yang X, Tan B, Liu H, Zhu W, Xu L, Wang Y, et al. 2020. Genetic diversity and population structure of Asian and European common wheat accessions based on genotyping-by-sequencing. Front. Genet.. 11: 580782
- Zandipour M, Hervan EM, Azadi A, Khosroshahli M, Etminan A. 2020. A QTL hot spot region on chromosome 1B for nine important traits under terminal drought stress conditions in wheat. Cereal Res. Commun.. 48: 17-24.
- Zhang YP, Wang ZM, Wu YC, Zhang X. 2006. Stomata characteristics of different green organs in wheat under different irrigation regimes. Acta Agron. Sin.. 32: 70-75.