Abstract
High-throughput genotyping has substantially advanced the quality and accuracy of single nucleotide polymorphism (SNP) discovery and provided an effective way to interpret phenotypic variations in a mapping population. High-resolution quantitative trait locus (QTL) mapping is important for understanding agricultural traits. However, constructing a high-resolution map without sufficient markers to detect QTLs/genes of agronomically important traits is laborious and time consuming. In this study, 160 recom-binant inbred lines (RILs) derived from a cross between Milyang23 and Gihobyeo were re-sequenced, and their SNPs were used for high-resolution QTL mapping of yield-related traits. A total of 1,850,671 high-quality SNPs from RILs were detected, and 3,563 bins were used as genetic markers to construct a high-resolution genetic map using the sliding window approach. The total genetic distance was 1,278.62 cM. Using the QTL analysis, we identified 35 QTLs controlling six yield traits, namely, culm length, panicle length, panicle number per plant, primary branch number per panicle, grain number per plant, and 100-grain weight. In addition, we detected major QTLs associated with culm length and grain number, and compared their physical distances using a conventional genetic map. These results showed that rapid, high-resolution QTL mapping using high-quality SNPs as bin markers is a powerful tool for fine-mapping and cloning important QTLs/genes.
-
Key words: Re-sequencing, Genotyping, High-resolution map, Yield-related QTL, Rice
INTRODUCTION
Rice (
Oryza sativa L.) is one of the most important staple crops in the world, and it exhibits considerable variation in phenotypes such as yield-, resistance-, development-, and quality-related traits. Among these, yield-related traits are complex traits that are controlled by multiple genetic factors, called quantitative trait loci (QTLs). Rice yield is directly determined using panicles per plant, spikelets per panicle, spikelet fertility, and grain weight (
Fujita et al. 2013). The QTLs associated with major agronomic traits in rice have been identified through fine-mapping and posi-tional cloning. For example,
GN1A (
Ashikari et al. 2005),
GS3 (
Fan et al. 2006),
Ghd7 (
Xue et al. 2008),
APO1 (
Terao et al. 2010),
DTH8 (
Wei et al. 2010), and
NAL1 (
Fujita et al. 2013) are major genes related to rice yield, and they have been cloned. However, previous studies have reported that QTL mapping is limited by the use of con-ventional molecular markers, such as restriction fragment length polymorphism (RFLP), randomly amplified poly-morphic DNA (RAPD), amplified fragment length poly-morphism (AFLP), sequence tagged sites (STS), cleaved amplified polymorphic sequence (CAPS), and simple se-quence repeats (SSRs) (Bernardo
et al. 2008). There are large gaps between QTL region markers due to a lack of markers (
Han et al. 2016). The resolution of QTL mapping, determined by the size of the QTL confidence interval, depends largely on the mapping population size and marker density (
Wang et al. 2011). QTL mapping resolution can be improved with a larger population size and higher marker density to detect the location of recombination events more precisely (
Chen et al. 2014). Generally, recombinant in-bred lines (RILs) and nearly isogenic lines (NILs) of advanced populations are used for permanent QTL map-ping, and they have to be genotyped only once, but may be phenotyped repeatedly (
Singer et al. 2006). Homozygous populations such as RILs are advantageous because of their high recombination frequency in populations that result from multiple meiotic events during repeated selfing (
Jansen 2004).
Recent advances in next-generation sequencing (NGS) technologies have provided cost-effective platforms for directly detecting high-quality single nucleotide polymor-phism (SNP) markers to genotype mapping populations (
Varshney et al. 2009;
Chen et al. 2014). Several methods such as whole-genome sequencing, re-sequencing, genotype by-sequencing (GBS), and
de novo sequencing are widely used in crop genetics and breeding studies. Re-sequencing and GBS, in particular, are actively utilized to construct high-resolution genetic maps and identify QTLs/genes (
Guo et al. 2014). In rice, recombination populations from crosses of 93-11/Nipponbare, Zenshan97/Minhhui63, and PA64s/ 93-11 were used to construct ultra-high-density linkage maps by re-sequencing, and numerous QTLs associated with yield-related traits were identified (
Xie et al. 2010;
Wang et al. 2011;
Gao et al. 2013). GBS technology was used to develop 30,984 markers for the genetic mapping of an IR64 (
indica)/Azucena (
japonica) population, including 176 RILs, and QTLs associated with leaf width and aluminum tolerance were mapped (
Spindel et al. 2013). MutMap has also been used to identify mutated genes (
Abe et al. 2012;
Takagi et al. 2013b), and the QTL-Seq method has been used to identify QTLs (
Takagi et al. 2013a) by re-sequencing. Moreover, agriculturally important genes were identified using a genome-wide association study (GWAS) based on whole-genome sequencing, which is an effective tool to rapidly identify genes associated with agronomic traits (
Yano et al. 2016). However, these genome wide marker data from the mapping populations are limited due to sequencing errors in genotyping.
Huang et al. (2009) designed a sliding window ap-proach, which is a high-throughput method for genotyping RILs. This approach was developed to evaluate SNPs collectively rather than individually, making it less time, cost, and labor intensive than the conventional PCR-based genotyping method for QTL mapping. Additionally, the bin map method has been demonstrated to be more powerful for detecting QTLs than traditional methods and has been employed for fine-mapping (
Chen et al. 2014). Instead of using all SNPs as independent markers, the sliding window approach merges consecutive SNPs into one bin, which can substantially reduce errors caused by inaccurate SNP calling (
Han et al. 2016). A window sliding approach has been used for constructing bin maps and QTL mapping in several species such as rice, soybean, and pepper (
Huang et al. 2009;
Wang et al. 2011;
Yu et al. 2011;
Qi et al. 2014;
Han et al. 2016). For example, the genetic map of 150 rice RILs derived from a cross between 93-11 and Nipponbare revealed a QTL in a 100-kb region containing the rice “green revolution” gene (
Huang et al. 2009). These results show that a high-resolution map can aid in more accurate QTL mapping than conventional markers and facilitate the fine-mapping of quantitative traits and map-based cloning.
In this study, we re-sequenced the whole genome of Milyang23/Gihobyeo recombinant inbred lines (MGRILs) and improved QTL mapping for yield-related traits. To increase the efficiency of QTL mapping, we generated bins as genetic markers and constructed a high-resolution map using the sliding window approach with RIL populations from a cross between Milyang23 and Gihobyeo. Six yield-related traits, culm length, panicle length, panicle number per plant, primary branch number per panicle, grain num-ber per plant, and 100-grain weight, were investigated to detect major and minor QTLs, and high-resolution map increased the speed of QTL mapping. Furthermore, we compared their physical distances using a conventional genetic map.
MATERIALS AND METHODS
Plant materials and phenotyping
The RIL populations was developed from a cross be-tween Milyang23 (an
indica/japonica derivative known as Tongil-type) and Gihobyeo (
japonica). The parents were crossed in 1988. The F
2 plants were self-pollinated, and the subsequent generations progressed via single seed descent (SSD) until the F
6 generation (
Cho et al. 1998a;
Cho et al. 1998b;
Cho et al. 2007). From the F
7 generation, the seeds were planted in single rows in a field and fixed up to the F
23 generation (
Lee et al. 2016). The F
23 population was grown for phenotype investigation in a greenhouse at the National Institute of Agricultural Sciences (NIAS) of the Rural Development Administration (RDA) in Jeonju, Korea. One rice seed was sown in an area of diameter 10 cm in each pot (six pots per line), and plants from three pots were used for phenotyping. The temperature was maintained at 25-32℃ and the photoperiod was 13.5-hour light and 9.5-hour dark. Phenotyping was performed for six traits, namely, culm length, panicle length, panicle number of per plant, primary branch number per panicle, grain number per plant, and 100-grain weight. For culm length and panicle length, the main culm (tiller) of each plant was measured in millimeters from the soil surface to panicle neck and the start to end of the panicle, respectively. Panicle number per plant, grain number per plant, and 100-grain weight were measured from whole panicles per plant, and the primary branch number per panicle were counted from the panicle from the main culm per plant.
For high-quality re-sequencing, genomic DNA was ex-tracted from in vitro cultured seedlings. Rice seeds were sterilized in 50% sodium hypochlorite solution for 30 minutes, and then washed with sterile distilled water. The sterilized seeds were immersed in sterile distilled water and placed in a culture room at 28℃ for 5 days to expedite ger-mination. After incubation, the seeds were planted in solid Murashige and Skoog (MS) media (Duchefa Biochemie, Haarlem, Netherlands) containing 5.5 g/L plant agar (pH 5.8). The seeds were cultured at 28℃ under a 16/8-hour light/dark photoperiod, using fluorescent lamps (56 µmol/ m2s). The plants were collected at 2 weeks after trans-planting and ground with frozen 2010 Geno/Grinder (SPEX Sample Prep, USA) twice for 40 seconds at 990 rpm in 2-mL centrifuge tubes. Genomic DNA from each indivi-dual, including the parents, were extracted using the DNeasy® Plant Mini Kit (Qiagen, Hilden, Germany).
Genomic DNA of MGRILs was used to prepare se-quencing libraries as recommended by the manufacturer (Illumina, Inc, San Diego, CA, USA), and then paired-end sequencing was performed using Hiseq X-Ten (Illumina, Inc). All sequences generated were 151 nucleotides long. Illumina adaptor from high-quality raw reads was removed using Trimmomatic software; then, they were used to analyze the genetic variations between Milyang23 and Gihobyeo. The applied criterion for trimming data was low-quality ≤ Q20 in 4 bp. The Q20 value indicates a base calling accuracy of 99%. Poor-quality reads and reads shorter than 36 bases were discarded.
Oryza sativa L. cv. Nipponbare (Pseudomolecules IRGSP-1.0;
http://rapdb.dna.affrc.go.jp/download/irgsp1.html) in the Rice Anno-tation Project Database (RAP-DB) was used as a reference genome sequence. The Burrows-Wheeler Aligner (BWA; 0.6.1-r104) program was used to align the clean reads to those of the Nipponbare genome. Variants were obtained by calling from the VCF file using GATK haplotypeCaller, and this ensured reliable reads with a high mapping quality. SNPs relative to Nipponbare SNPs were filtered using the following parameters: min read depth, 10; max read depth, 250; min genotype quality, 20; max missing, 0.9; minor allele frequency, 0.05; min allele, 2; and max allele, 2 using VCFtools. The detected SNPs were classified and anno-tated as genic or intergenic based on positional information from the reference genome. Genic regions were classified as coding region (CDS), untranslated regions (UTRs), or introns. SNPs in the coding region were separated into synonymous, non-synonymous, and others by amino acid substitutions.
A high-resolution genetic map of populations with high-linkage disequilibrium may not only contain many redun-dant markers that provide no information, but also increase the computational requirements for mapping (
Chen et al. 2014). Moreover, a small percentage of genotypes is falsely called due to sequencing error. To reduce these problems, in this study, we used a modified sliding window approach developed by
Huang et al. (2009). The raw reads were sorted according to index, and the high-quality SNPs between parents were called. RILs were genotyped by scanning with a window size of 15 SNPs, and the ratio of SNP alleles for each individual from Milyang23 and Gihobyeo was calculated as windows. When > 70% of SNPs had one parental genotype, the window was called homozygous; otherwise, the window was called hetero-zygous. Recombination breakpoints of each RIL were determined by physical locations using the genotype with window changes described by
Huang et al. (2009). Addi-tionally, when short heterozygous regions were located in the middle of consecutive Milyang23 and Gihobyeo geno-type regions in the bin map and these heterozygous regions were shorter than the window size, the genotype was manually corrected to match the adjacent genotype (
Han et al. 2016). The adjacent windows with the same genotype were aligned into bins, and the bin map was constructed for the entire population by SeqMap. The standard bin length was 10 kb; however, if an SNP was not located in the 10 kb intervals, the physical position of bins was estimated to the median values. These bins were generated for genetic markers to construct a high-resolution genetic map using IciMapping ver4.1 (
Meng et al. 2015). These bin markers were grouped based on the 12 chromosomes using a logarithm of the odds (LOD) threshold value of over 3.0. The SNPs were ordered using the By Input algorithm based on their physical position in Nipponbare. Rippling was performed to fine-tune the marker order using the sum of adjacent recombination fraction (SARF) with a window size of 5 as the rippling criterion. The genetic distances (cM) of the SNP markers based on the recombination rates were converted using the Kosambi mapping function, then the marker distances were estimated (
Kosambi 1943).
The QTL analysis was performed using all phenotypic values of RILs. QTL mapping was performed for yield traits with the integrated genotype and phenotype data using the composite interval mapping (CIM) method. The CIM method was performed using Windows QTL Cartog-rapher ver2.5 (
Wang et al. 2012). The CIM analysis was run using the standard model with forward and backward stepwise regression, a window size of 10 cM, and a walk speed of 1 cM, which provides estimates of additive effects and the percentage of phenotypic variance explained (PVE) using the putative QTLs. The LOD and PVE values were determined based on likelihood ratio tests under a hypothesis allowing both additive and dominance effects. Experiment-wide significance (
P < 0.05) thresholds for QTL detection were determined based on 1,000 permu-tations. The QTL position was described according to its LOD peak position and the surrounding region, with the 95% confidence interval. Additionally, QTLs with epi-static effects on six yield-related traits were analyzed using IciMapping ver4.1 (
Meng et al. 2015). Epistatic QTLs were established using the threshold of LOD < 3.0 and
P ≤ 0.0001.
RESULTS
Phenotypic analysis of RILs
The RILs and parents exhibited substantial variations in rice yield traits (
Fig. 1). Of the six traits, the culm length, panicle length, panicle number per plant, grain number per plant, and 100-grain weight showed normal variations be-tween Milyang23 and Gihobyeo mapping parents, where-as the primary branch number per panicle was not sub-stantially different between the parents. All traits displayed transgressive segregation in the RIL populations. The cor-relation coefficients of the yield-related traits revealed significant correlations among the six traits (
Table 1). The culm length positively correlated with the panicle length, primary branch number per panicle, and grain number per plant, whereas the panicle number per plant and 100-grain weight were correlated negatively. For panicle length, primary branch number per panicle, grain number per plant, and 100-grain weight traits were positively cor-related, whereas panicle number per plant was negatively correlated. Notably, panicle number per plant was nega-tively correlated with three traits, namely, primary branch number per panicle, grain number per plant, and 100-grain weight. The correlation coefficient between primary branch number per panicle and grain number per plant was high (
r = 0.740), and culm length and 100-grain weight showed the lowest negative correlation (
r = ‒0.043) among the six traits.
Deep sequencing of parents was performed to ensure sufficient read depths at potential SNP loci, and increase the accuracy of SNPs. Raw data of re-sequencing yielded approximately 35.5 × 10
9 bp (23.5 × 10
7 reads) and 30.0 × 10
9 bp (19.8 × 10
7 reads) of raw sequences data for Milyang23 and Gihobyeo, respectively (
Table 2). RILs yielded on an average 13.2 × 10
9 bp of raw sequences, including approximately 8.7 × 10
7 reads (
Supplementary Table S1). MG016 had the maximum mapping sequences of 18.6 × 10
9 bp (approximately 12.3 × 10
7 reads), whereas MG102 had the minimum mapping sequences of 10.1 × 10
9 bp (approximately 6.6 × 10
7 reads). After quality trimming, the remaining 33.3 × 10
9 bp of sequence from Milyang23 and 28.1 × 10
9 bp of sequence from Gihobyeo were mapped to the Nipponbare reference genome. We mapped 22.1 × 10
7 reads containing 32.2 × 10
9 bp for Milyang23 with a mapping depth of 86.40X and 18.8 × 10
7 reads containing 27.8 × 10
9 bp for Gihobyeo with a mapping depth of 74.62X. Additionally, 160 RILs were mapped to a Nipponbare reference, and yielded 12.4 × 10
9 bp (approximately 8.3 × 10
7 reads) of trimmed sequence on an average. We mapped 60.5 × 10
6-11.6 × 10
7 RIL reads with a mapping depth of 23.44-45.71X. MG016 had the maximum mapping se-quences of 17.0 × 10
9 bp (approximately 11.6 × 10
7 reads), whereas MG102 had the minimum mapping sequences of 8.7 × 10
9 bp (approximately 6.0 × 10
7 reads).
The total number of SNPs among RILs was 1,850,671, which varied substantially among the 12 chromosomes. These identified SNPs were classified into 207,328 genic (11.20%) and 1,643,343 intergenic regions (88.79%) (
Fig. 2A). Of the genic region SNPs, 85,162, 16,230, 35,440, and 70,496 were detected from CDS (41.08%), 5’ UTR (7.83%), 3’ UTR (17.09%), and introns (34.00%), respectively (
Fig. 2B). The 85,162 SNPs in the coding region were divided into 37,985 synonymous SNPs (44.60%), 43,269 non-synonymous SNPs (50.81%), and other SNPs at the start, stop, and splice sites (
Fig. 2C). Chromosome 1 had the most SNPs (n = 256,461), whereas chromosome 12 had the fewest (n = 103,248) (
Fig. 3).
A total of 1,850,671 high-quality SNPs were detected among the 160 RILs, which were derived from a cross between Milyang23 and Gihobyeo, and they were used to construct the bin map (
Table 3,
Fig. 4). A total of 3,922 recombination breakpoints were identified from RILs, which were defined as the boundary between two different genotyping bins. Bins were aligned to each individual using the sliding window approach, and grouped into 3,563 bins at 10 kb intervals. Each bin was at 10 kb intervals, and the number of bins among the rice chromosomes varied from 45 to 526, with an average of 269.92. Chromosome 1 had the most bins (n = 526) and chromosome 6 had the fewest (n = 45). The physical length of the map ranged from 22.82 to 43.26 Mb, with an average of 30.88 Mb. The bins were used as genetic markers to construct a high-resolution genetic map for high-efficiency mapping. The total genetic distance was 1,278.62 cM, and the average genetic distance between the adjacent bins was 0.39 cM.
The LOD threshold, determined using 1,000 permu-tations with 5% probability, for culm length, panicle length, panicle number per plant, primary branch number per panicle, grain number per plant, and 100-grain weight was 3.41, 3.22, 3.14, 3.27, 3.40, and 3.22, respectively. Thirty-five QTLs based on these thresholds were detected from MGRILs (
Fig. 5). For example, 6 QTLs for culm length (chromosomes 1, 4, 5, and 6), 5 for panicle length (chromosomes 1, 5, 6, and 9), 6 for panicle number per plant (chromosomes 3, 5, 7, and 12), 8 for primary branch number per panicle (chromosomes 1, 4, 6, and 9), 9 for grain number per plant (chromosomes 1, 2, 4, 5, and 7), and 1 for 100-grain weight (chromosome 8) (
Table 4). The LOD value and phenotypic variation for each QTL was 3.31-41.38 and 2.98%-58.10%, respectively. Of these, 11 QTLs explained more than 10% of phenotypic effects, and defined as major-effect QTLs:
qCL1.1, qCL1.2, qPL5.2, qPN3.1, qPN7.1, qBN1.2, qBN4.2, qGN1.1, qGN1.2, qGN1.2, and
q100GW8. qCL1.1 and
qCL1.2 for culm length on chromosome 1 explained the most phenotypic variation, 28.78% and 58.10%, respectively, and the LOD values were 14.76 and 41.38, respectively. Notably,
qCL1.2 had the largest effect on Bin1_3848 at the physical position of 38.48 Mb. For panicle length,
qPL5.2 was detected on chromosome 5, and the LOD value and PVE for
qPL5.2 were 6.87 and 12.89%, respectively. Two QTLs for panicle number per plant,
qPN3.1 and
qPN7.1, explained 17.25% and 10.93% of variation for each QTL, respectively. QTLs associated with primary branch number per panicle,
qBN1.2 and
qBN4.2, explained 15.84% and 10.15% of variation on chromosomes 1 and 4. For grain number per plant traits,
qGN1.1, qGN1.2, and
qGN1.3 QTLs were detected, and the LOD value was 7.48, 14.39, and 6.81, respectively, and the PVE was 15.77%, 27.66%, and 14.51%, respectively. Of these,
qGN1.2 had the largest additive effect value of 14.97. The QTL
q100GW8 for 100-grain weight trait was also detected on chromosome 8 with an LOD value of 3.95 and PVE of 10.17%.
Many epistatic interactions were identified to be asso-ciated with the six yield-related traits. Eighteen epistatic QTLs were located on all chromosomes (
Table 5). Two interactions on chromosome1 and 4 produced effects that were larger than the other interactions, accounting for 12% of the genotypic variance for the primary branch number per panicle. However, epistatic interactions occurred be-tween two loci, and non-main-effect QTL among them.
The same datasets of the RILs for phenotypes were used for QTL mapping with the previous genetic map, which consisted of 466 conventional PCR-based markers (
Lee et al. 2016), and compared for the physical locations. Based on the bin map, Bin1_3836 and Bin1_3872 on chromo-some 1 were mapped to the
sd1 gene for culm length (
Sasaki et al. 2002). The physical location of Bin1_3836 and Bin1_3872 was 38.36 and 38.72 Mb, respectively. In the reference genome, the
sd1 gene is located at 38.38 Mb. Additionally, Bin1_523.5 and Bin1_533 on chromosome 1 were mapped to the
Gn1a gene for grain number, which is located at 5.27 Mb in the Nipponbare rice genome (
Ashikari et al. 2005).
DISCUSSION
Advantages of the bin map in QTL mapping
The resolution of genetic mapping (i.e., the size of the region confidently associated with a trait) is a function of marker density, recombination rate, and phenotypic vari-ation proportion due to genetic factors (
Singer et al. 2006). An increase in any one of these factors can improve map-ping resolution. High-density bin maps have been con-structed for many species, such as rice, maize, soybean, and pepper (
Xie et al. 2010;
Chen et al. 2014;
Qi et al. 2014;
Han et al. 2016), through the sliding window approach (
Huang et al. 2009). Compared with previous mapping efforts, this method can provide high-density markers based on SNPs, and it requires low labor cost and short time. In this study, we re-sequenced the entire 160 RIL populations to construct high-resolution maps by applying a sliding window method, and used it to detect QTLs that control yield-related traits. The RIL populations were derived from a cross between Milyang23 (
indica/japonica, Tongil-type) and Gihobyeo (
japonica). The recombination patterns of the 160 RILs are presented in
Fig. 4. Based on the bin map, recombination events were represented with 1,850,671 SNPs (3,563 bins), aligning with the minimal length of 10 kb intervals. Chromosome 6 had some large bins compared with the other chromosomes. Compared with the results of several bin mapping studies, in the present study, chromosome 6 presented the fewest number of bins and shortest genetic distance with the least re-combination events, and it can represent the characteristic pattern in the MGRIL population.
Several studies using MGRILs have reported ways to develop conventional DNA markers such as RFLP, AFLP, SSR, and CAPS for genetic mapping (
Cho et al. 1998a;
Cho et al. 1998b;
Ji et al. 2012). A genetic map was constructed in a previous study using PCR-based markers including 247 CAPSs, 88 STSs, 91 SSRs, 36 insertion-deletion (InDels), and 8 RTMs from Cornell University in the USA (Personal Communication), and they were scored on agarose gels (
Lee et al. 2014;
Lee et al. 2016). In contrast, the present bin map used the visualized recom-binant distribution in MGRIL populations, and high-density bin markers were developed by genotyping (
Supplementary Table S2). A total of 1,850,671 SNPs were identified and used to enhance the map quality and marker resolution for rapid QTL mapping using the sliding win-dow approach with 15 consecutive SNPs per window. The bin map strategy was demonstrated to be an efficient way to generate ultra-high-density bin markers using sparse SNP information and identify high-resolution QTLs (
Chen et al. 2014). Additionally, we confirmed the quality of our bin map by positioning previously cloned genes, sd1 and Gn1a (
Sasaki et al. 2002;
Spielmeyer et al. 2002;
Ashikari et al. 2005). Moreover, the position of the sd1 gene in this study showed that the bin map we constructed was a more effective way to narrow down the QTL region (
Supplementary Table S3). For example, the region of
qCL1.2 was 1.92 Mb interval (location: 38.06-39.38 Mb) on the genetic map using PCR-based markers (
Lee et al. 2016), but only 0.36 Mb interval (location: 38.36-38.72 Mb) on this bin map. Thus, we demonstrate that bin mapping yields high-resolution QTL maps, which may improve the quality of fine-mapping or map-based cloning.
The resolution of a QTL map is determined by the size of the confidence interval of QTL, which depends on the population size and marker density (
Wang et al. 2011). Our QTL analysis revealed 35 QTLs associated with the six yield-related traits, and the major-effect of QTLs that ex-plained more than 10% of phenotypic effects were
qCL1.1, qCL1.2, qPL5.2, qPN3.1, qPN7.1, qBN1.2, qBN4.2, qGN1.1, qGN1.2, qGN1.3, and
q100GW8. These QTL results are clearly exemplified by two known genes,
sd1 and
Gn1a (
Sasaki et al. 2002;
Ashikari et al. 2005).
qCL1.2 and
qGN1.2 QTLs on chromosome 1, which contributed the highest effect on culm length and grain number in terms of grain productivity, were identified by high-resolution map-ping in this study.
qCL1.2 had negative additive effects, indicating that alleles from Milyang23, derived from a cross between Suwon 232 (
japonica) and IR24 (
indica) rice varieties, had decreased culm length. The allele of
sd1 may be responsible for the reduced plant height in Milyang23, which had shorter leaves and stems than Gihobyeo.
Ashikari et al. (2005) reported that
Gn1a in-creases grain productivity in rice.
qGN1.2 was found to increase the grain number in Milyang23, and the phe-notypic variation in grain number per plant showed a significant difference between Milyang23 and Gihobyeo (
Fig. 1). However, the remaining QTLs did not show significant effects. These 24 QTLs were predicted to be associated with complex traits in rice yield, and increasing population size would reduce experimental errors to improve small-effect of QTL detection.
Compared with the genetic map obtained using con-ventional molecular markers and bin markers, bins were detected with high accuracy from a large number of re-combination events, which are superior to conventional molecular markers in genome coverage (
Wang et al. 2011). For example, an ultra-high-density genetic map based on high-quality SNPs from a rice RIL population was con-structed for QTL analysis of yield component traits; the SNP map was compared with the traditional RFLP/SSR map, and the former detected more QTLs and had better power and resolution (
Yu et al. 2011). The
Liang-You-Pei-Jiu (
LYP9) 132 recombinant lines derived from 93-11 and PA64s parental varieties were used to construct 3,524 recombinant bin map based on SNP markers by rese-quencing, and 43 yield-associated traits were detected (
Gao et al. 2013). These large
LYP9 RILs combined with high-quality DNA polymorphisms allowed fine mapping of two QTLs and identification of candidate genes for days to heading8 and lax panicle1. The combination of
de novo sequencing and re-sequencing were used to identify a novel ion transporter gene,
GmCHX1, and show that high-density marker QTL mapping can serve as an effective strategy to unveil novel genomic information in soybean (
Qi et al. 2014). A set of 708 F
2 maize progeny from Chang7-2 and 787 were used to generate 6,533 bin markers, and the high-accuracy and -quality map was validated by the iden-tification of two-well studied genes:
r1 for sink color and
ba1 for tassel branch number (
Chen et al. 2014). Moreover, the high accuracy of an ultra-high-density linkage map was demonstrated to be highly efficient for rapidly identifying QTLs. In hot pepper (
Capsicum annuum), 120 RILs were used to construct an ultra-high density map containing 2,578 bins, and QTLs of fruit-related traits and leaf-related traits were identified for the first time with flower-related traits in pepper (
Han et al. 2016). However, this is the first study to use recombination data in MGRIL populations; we demonstrated that rapid sequence-based genotyping and high-efficient QTL mapping can provide valuable infor-mation. Furthermore, bins with recombination events ad-jacent to major QTLs can be an important factor, and they can be effectively utilized to control yield traits in rice breeding.
Supplemental Materials
ACKNOWLEDGEMENTS
This work was supported by a grant from the National Institute of Agricultural Sciences (Project No. PJ013442), Rural Development Administration, Korea.
-
CONFLICT OF INTEREST
No potential conflict of interest relevant to this article was reported.
Fig. 1Phenotypic variation in yield-related traits in MGRILs. Frequency distribution of culm length, panicle length, panicle number per plant, primary branch number per panicle, grain number per plant, and 100-grain weight of 160 RIL populations derived from a cross between Milyang23 and Gihobyeo. The mean phenotypic value of the parental lines is indicated with arrows, with MY and GH representing Milyang23 (indica/japonica) and Gihobyeo (japonica), respectively.

Fig. 2Annotation of SNPs among 160 RILs. (A) Classification of total SNPs between genic and intergenic regions. (B) Classification of genic SNPs. (C) Classification of SNPs in coding sequences (CDS). IRGSP-1.0 reference anno-tation was used in this study. SY and NS indicate synonymous and non-synonymous SNPs, respectively. “Others” means SNPs located at the start, stop, and splice sites in the CDS region.
Fig. 3SNP distribution on each chromosome among the RIL populations derived from Milyang23 and Gihobyeo. The x-axis indicates each chromosome number in rice. The y-axis represents the number of SNPs detected in RILs.
Fig. 4Recombination bin map. Aligned recombination maps of the 160 RILs, inferred from 1,850,671 high-quality SNPs of the MGRIL population. Physical position is based on Nipponbare sequence. Blue: Milyang23; red: Gihobyeo; yellow: heterozygote.
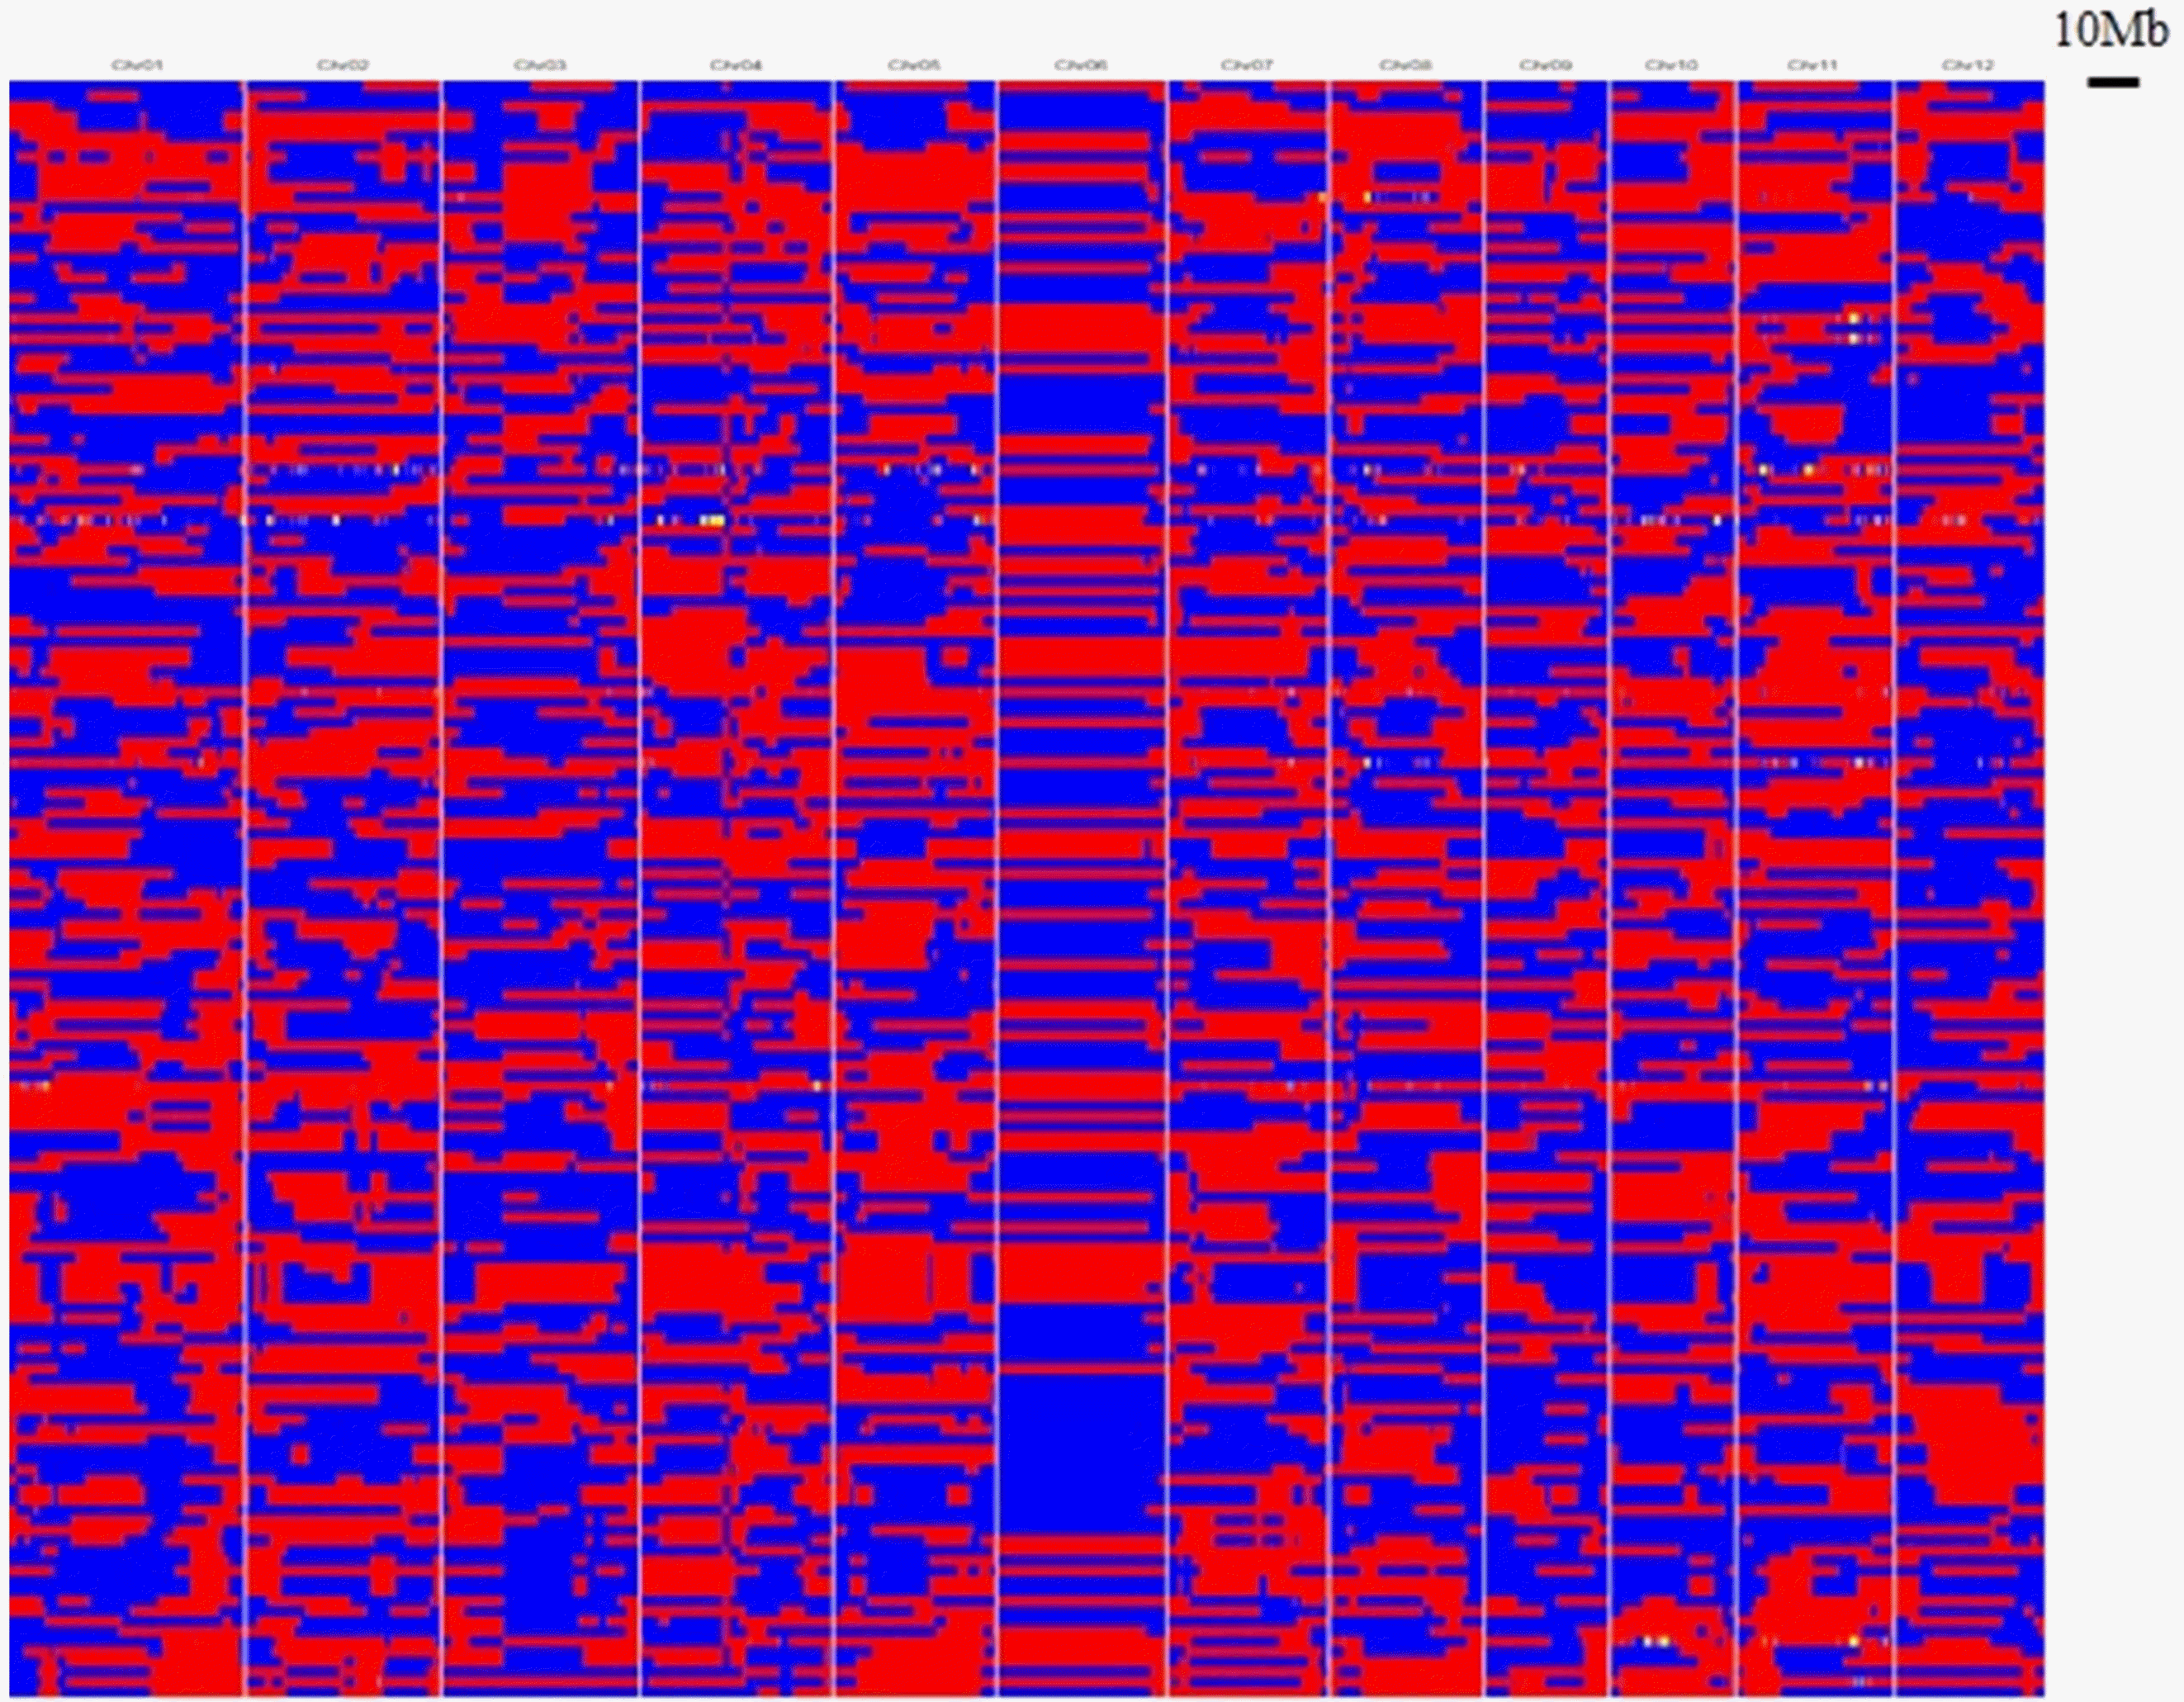
Fig. 5QTL mapping for yield-related traits in the high-resolution genetic map. The traits investigated were culm length, panicle length, panicle number per plant, primary branch number per panicle, grain number per plant, and 100-grain weight. QTL for each trait on chromosomes is shown. Red: culm length; dark green: panicle length; dark blue: panicle number; pink: primary branch number per panicle; light green: grain number; cyan: 100-grain weight.

Table 1Correlation coefficients among six yield-related traits.
Table 1
|
Traits |
Culm length |
Panicle length |
Panicle number per plant |
Primary branch number per panicle |
Grain number per plant |
|
Panicle length |
0.298** |
|
|
|
|
|
Panicle number per plant |
‒0.148 |
‒0.315** |
|
|
|
|
Primary branch number per panicle |
0.293** |
0.526** |
‒0.337** |
|
|
|
Grain number per plant |
0.292** |
0.506** |
‒0.319** |
0.740** |
|
|
100-grain weight |
‒0.043 |
0.070** |
‒0.049 |
‒0.151 |
‒0.132 |
Table 2Sequencing and read mapping of parental varieties to the Nipponbare reference sequence.
Table 2
|
Varieties |
Raw data |
|
After quality trimming |
|
Mapping |
|
|
|
|
Number of reads (#) |
Nucleotides
(bp) |
|
Number of reads (#) |
Nucleotides
(bp) |
Sequencing depth (X) |
|
Number of reads (#) |
Nucleotides
(bp) |
Depth (Ⅹ) |
|
Milyang23 |
235,220,190 |
35,518,248,690 |
|
224,630,378 |
33,343,613,160 |
89.33 |
|
221,302,998 |
32,248,369,317 |
86.40 |
|
Gihobyeo |
198,722,930 |
30,007,162,430 |
|
189,733,590 |
28,176,644,835 |
75.49 |
|
188,542,503 |
27,852,122,524 |
74.62 |
Table 3Information about the recombination bin map and high-resolution genetic map of the MGRIL population.
Table 3
|
Chromosome |
No. of SNPs |
No. of bin markers |
Physical length of map (Mb) |
|
Genetic distance of mapx) (cM) |
|
|
|
Meanz)
|
Totaly)
|
Mean |
Total |
|
1 |
256,461 |
526 |
0.08 |
43.26 |
|
0.33 |
174.45 |
|
2 |
207,499 |
428 |
0.08 |
35.85 |
|
0.34 |
144.26 |
|
3 |
151,217 |
227 |
0.16 |
36.27 |
|
0.60 |
136.69 |
|
4 |
131,138 |
319 |
0.11 |
35.49 |
|
0.41 |
129.27 |
|
5 |
103,462 |
255 |
0.12 |
29.86 |
|
0.44 |
111.66 |
|
6 |
162,691 |
45 |
0.69 |
31.13 |
|
0.51 |
22.84 |
|
7 |
181,798 |
324 |
0.09 |
29.60 |
|
0.35 |
113.69 |
|
8 |
125,769 |
321 |
0.08 |
26.90 |
|
0.32 |
102.52 |
|
9 |
124,279 |
185 |
0.12 |
22.82 |
|
0.37 |
67.87 |
|
10 |
149,738 |
281 |
0.08 |
23.15 |
|
0.25 |
71.32 |
|
11 |
153,371 |
422 |
0.07 |
28.99 |
|
0.28 |
119.82 |
|
12 |
103,247 |
230 |
0.12 |
27.22 |
|
0.37 |
84.23 |
|
Average |
154,222 |
269.92 |
0.11 |
30.88 |
|
0.39 |
106.55 |
|
Total |
1,850,671 |
3,563 |
0.10 |
370.50 |
|
0.36 |
1,278.62 |
Table 4Detection of QTLs associated with six yield-related traits using a high-resolution map.
Table 4
|
Traitz)
|
Chr |
QTL |
Bin markersy)
|
Position (cM) |
Interval (cM) |
LOD |
PVEx) (%) |
Additive effectw)
|
References |
|
CL |
1 |
qCL1.1*
|
Bin1_3554 |
153.5 |
153.2-153.8 |
14.76 |
28.78 |
‒76.06 |
None
|
|
1 |
qCL1.2*
|
Bin1_3848 |
162.2 |
161.5-162.9 |
41.38 |
58.10 |
‒107.44 |
sd1 (Sakaka et al. 2002) |
|
4 |
qCL4
|
Bin4_2559 |
94.1 |
93.6-96.0 |
3.79 |
2.98 |
23.94 |
cl4 (Mu et al. 2004) |
|
5 |
qCL5.1
|
Bin5_2049.5 |
72.9 |
72.3-73.4 |
7.96 |
7.28 |
39.85 |
None
|
|
5 |
qCL5.2
|
Bin5_2269 |
81.0 |
80.5-81.3 |
11.15 |
9.77 |
49.56 |
None
|
|
6 |
qCL6
|
Bin6_2706 |
1.31 |
0.0-2.2 |
5.66 |
4.57 |
30.21 |
qCL-6 (Yamamoto et al. 2001) |
|
PL |
1 |
qPL1
|
Bin1_3284.5 |
142.5 |
141.8-142.8 |
4.23 |
6.71 |
‒6.71 |
None
|
|
5 |
qPL5.1
|
Bin5_733.5 |
37.5 |
36.3-38.2 |
4.01 |
7.75 |
6.43 |
None
|
|
5 |
qPL5.2*
|
Bin5_1666 |
47.6 |
45.3-48.4 |
6.87 |
12.89 |
8.53 |
, Lee et al. 2016
|
|
6 |
qPL6
|
Bin6_2809 |
9.0 |
5.0-10.5 |
3.62 |
6.42 |
5.85 |
qPL-6 (Suh et al. 2005) |
|
9 |
qPL9
|
Bin9_1289 |
32.6 |
31.4-35.1 |
4.87 |
8.79 |
‒7.01 |
None
|
|
PN |
3 |
qPN3.1*
|
Bin3_2846.5 |
101.5 |
100.9-103.5 |
10.21 |
17.25 |
‒1.04 |
None
|
|
3 |
qPN3.2
|
Bin3_2947.5 |
109.8 |
109.2-110.5 |
5.39 |
9.74 |
‒0.82 |
None
|
|
5 |
qPN5
|
Bin5_2271 |
81.6 |
81.0-82.0 |
4.54 |
7.13 |
‒0.65 |
None
|
|
7 |
qPN7.1*
|
Bin7_2332 |
91.8 |
91.1-92.4 |
6.73 |
10.93 |
0.79 |
None
|
|
7 |
qPN7.2
|
Bin7_2509.5 |
99.3 |
97.7-100.0 |
4.75 |
7.92 |
0.68 |
, Liao et al. 2001
|
|
12 |
qPN12
|
Bin12_1799 |
43.9 |
42.0-45.1 |
3.84 |
5.35 |
‒0.57 |
None
|
|
PBN |
1 |
qPBN1.1
|
Bin1_274 |
15.3 |
15.0-15.9 |
5.11 |
9.39 |
0.51 |
None
|
|
1 |
qPBN1.2*
|
Bin1_527.5 |
25.6 |
24.7-27.8 |
9.11 |
15.84 |
0.67 |
None
|
|
4 |
qPBN4.1
|
Bin4_2758 |
102.9 |
101.5-103.5 |
3.52 |
6.08 |
‒0.41 |
None
|
|
4 |
qPBN4.2*
|
Bin4_2936.5 |
111.9 |
111.4-113.2 |
6.10 |
10.15 |
‒0.54 |
None
|
|
4 |
qPBN4.3
|
Bin4_3101 |
118.8 |
117.8-121.3 |
5.66 |
9.48 |
‒0.52 |
None
|
|
6 |
qPBN6
|
Bin6_2717.5 |
1.91 |
0.0-2.2 |
5.60 |
9.25 |
0.52 |
None
|
|
9 |
qPBN9.1
|
Bin9_1396.5 |
38.7 |
33.0-40.6 |
3.31 |
5.42 |
‒0.40 |
None
|
|
9 |
qPBN9.2
|
Bin9_1517 |
43.7 |
42.5-44.4 |
4.18 |
6.76 |
‒0.44 |
None
|
|
GN |
1 |
qGN1.1*
|
Bin1_270.5 |
15.3 |
15.0-15.9 |
7.48 |
15.77 |
11.24 |
None
|
|
1 |
qGN1.2*
|
Bin1_530 |
25.9 |
25.3-27.4 |
14.39 |
27.66 |
14.97 |
Gn1a (Ashikari et al. 2005) |
|
1 |
qGN1.3*
|
Bin1_591 |
34.1 |
33.5-35.3 |
6.81 |
14.51 |
10.90 |
None
|
|
1 |
qGN1.4
|
Bin1_3342 |
145.4 |
145.1-146.0 |
3.95 |
6.81 |
‒7.42 |
None
|
|
1 |
qGN1.5
|
Bin1_3684 |
155.4 |
154.4-156.0 |
5.55 |
9.35 |
‒8.72 |
None
|
|
2 |
qGN2
|
Bin2_817.5 |
44.8 |
44.7-46.4 |
4.46 |
7.38 |
7.75 |
None
|
|
4 |
qGN4
|
Bin4_3015.5 |
113.5 |
113.2-114.4 |
5.01 |
7.26 |
‒7.72 |
None
|
|
5 |
qGN5
|
Bin5_592.5 |
30.4 |
30.0-31.3 |
3.41 |
5.58 |
6.69 |
None
|
|
7 |
qGN7
|
Bin7_2204.5 |
79.5 |
78.9-80.8 |
3.71 |
5.48 |
‒6.72 |
None
|
|
100GW |
8 |
q100GW8*
|
Bin8_160.5 |
8.11 |
7.2-10.3 |
3.95 |
10.17 |
0.09 |
None
|
Table 5Epistatic QTLs detected for yield-related traits in RIL population.
Table 5
|
Traitz)
|
Chr |
Position (cM) |
Left marker |
Right marker |
Chr |
Position (cM) |
Left marker |
Right marker |
LODy)
|
PVEx) (%) |
AAijw)
|
|
CL |
4 |
155.0 |
Bin4_1785 |
Bin4_1805.5 |
4 |
160.0 |
Bin4_1864.5 |
Bin4_1883 |
3.30 |
8.46 |
‒63.51 |
|
4 |
210.0 |
Bin4_2854.5 |
Bin4_2858 |
5 |
100.0 |
Bin5_2914.5 |
Bin5_2916 |
3.43 |
8.14 |
‒34.27 |
|
5 |
45.0 |
Bin5_1704 |
Bin5_1716 |
8 |
40.0 |
Bin8_588 |
Bin8_604.5 |
4.26 |
10.23 |
‒40.12 |
|
9 |
35.0 |
Bin9_1500.5 |
Bin9_1512.5 |
11 |
30.0 |
Bin11_574 |
Bin11_595.5 |
3.28 |
9.07 |
‒33.38 |
|
3 |
105.0 |
Bin3_2867 |
Bin3_2905 |
12 |
10.0 |
Bin12_463.5 |
Bin12_474.5 |
3.10 |
8.23 |
‒34.76 |
|
PL |
1 |
90.0 |
Bin1_2506 |
Bin1_2510 |
2 |
125.0 |
Bin2_3522.5 |
Bin2_3537 |
3.40 |
5.55 |
‒7.48 |
|
3 |
60.0 |
Bin3_1712 |
Bin3_1793 |
3 |
70.0 |
Bin3_2340.5 |
Bin3_2343 |
3.04 |
6.94 |
9.68 |
|
3 |
25.0 |
Bin3_493.5 |
Bin3_520 |
6 |
15.0 |
Bin6_2951 |
Bin6_2959.5 |
4.03 |
5.64 |
7.57 |
|
7 |
10.0 |
Bin7_200.5 |
Bin7_242.5 |
8 |
5.0 |
Bin8_105 |
Bin8_109.5 |
3.92 |
6.71 |
7.81 |
|
3 |
0.0 |
Bin3_6 |
Bin3_16.5 |
8 |
55.0 |
Bin8_973 |
Bin8_1289.5 |
3.11 |
6.72 |
6.78 |
|
10 |
10.0 |
Bin10_1009.5 |
Bin10_1061.5 |
11 |
65.0 |
Bin11_2201.5 |
Bin11_2204 |
3.53 |
5.77 |
6.91 |
|
2 |
35.0 |
Bin2_671 |
Bin2_684.5 |
12 |
35.0 |
Bin12_1763.5 |
Bin12_1785 |
4.88 |
6.84 |
8.21 |
|
4 |
185.0 |
Bin4_2206.5 |
Bin4_2210.5 |
12 |
60.0 |
Bin12_2296 |
Bin12_2320.5 |
3.13 |
5.82 |
6.72 |
|
PN |
4 |
5.0 |
Bin4_171.5 |
Bin4_205.5 |
4 |
15.0 |
Bin4_511.5 |
Bin4_562.5 |
3.37 |
10.55 |
‒0.94 |
|
PBN |
1 |
110.0 |
Bin1_3194 |
Bin1_3205 |
4 |
195.0 |
Bin4_2559 |
Bin4_2563.5 |
3.90 |
12.53 |
0.52 |
|
GN |
10 |
25.0 |
Bin10_1467 |
Bin10_1469.5 |
11 |
10.0 |
Bin11_226 |
Bin11_235.5 |
3.02 |
10.45 |
‒7.15 |
|
100GW |
3 |
70.0 |
Bin3_2340.5 |
Bin3_2343 |
8 |
55.0 |
Bin8_973 |
Bin8_1289.5 |
3.85 |
10.57 |
0.10 |
|
3 |
75.0 |
Bin3_2452.5 |
Bin3_2460 |
12 |
75.0 |
Bin12_2570.5 |
Bin12_2572.5 |
3.05 |
10.22 |
0.08 |
References
- Abe A, Kosugi S, Yoshida K, Natsume S, Takagi H, Kanzaki H, et al. 2012. Genome sequencing reveals agronomi-cally important loci in rice using MutMap. Nat. Biotechnol.. 30: 174-178.
- Ashikari M, Sakakibara H, Lin S, Yamamoto T, Takashi T, Nishimura A, et al. 2005. Cytokinin oxidase regulates rice grain production. Science. 309: 741-745.
- Bernardo R. 2008. Molecular markers and selection for com-plex traits in plants: Learning from the last 20 years. Crop Sci.. 48: 1649-1664.
- Chen Z, Wang B, Dong X, Liu H, Ren L, Chen J, et al. 2014. An ultra-high density bin-map for rapid QTL mapping for tassel and ear architecture in a large F2 maize population. BMC Genomics. 15: 1-10.
- Cho YG, Kang MR, Kim YW, Eun MY, Chung TY, Lee YT. 1998a. Development of RFLP framework map of rice (Oryza sativa L.) using recombinant inbred population derived from Milyang23/Gihobyeo cross. Korean J. Breed. Sci.. 30: 289-297.
- Cho YG, McCouch SR, Kuiper M, Kang MR, Pot J, Groenen JTM, et al. 1998b. Integrated map of AFLP, SSLP and RFLP markers using a recombinant inbred population of rice (Oryza sativa L.) Theor. Appl. Genet.. 97: 370-380.
- Cho YG, Kang HJ, Lee JS, Lee YT, Lim SJ, Gauch H, et al. 2007. Identification of quantitative trait loci in rice for yield, yield components, and agronomic trait across years and locations. Crop Sci.. 47: 2403-2417.
- Fan CH, Xing YZ, Mao HL, Lu TT, Han B, Xu CG, et al. 2006. GS3, a major QTL for grain length and weight and minor QTL for grain width and thickness in rice, encodes a putative transmembrane protein. Theor. Appl. Genet.. 112: 1164-1171.
- Fujita D, Kurniawan RT, Analiza GT, Maria VS, Yohei K, Sasaki K, et al. 2013. NAL1 allele from a rice landrace greatly increases yield in modern indica cultivars. Proc. Natl. Acad. Sci. U.S.A.. 110: 20431-20436.
- Gao ZY, Zhao SC, He WN, Guo LB, Peng YL, Wang JJ, et al. 2013. Dissecting yield-associated loci in super hybrid rice by resequencing recombinant inbred lines and improving parental genome sequences. Proc. Natl. Acad. Sci. U.S.A.. 110: 14492-14497.
- Guo L, Gao Z, Qian Q. 2014. Application of resequencing to rice genomics, functional genomics and evolutionary analysis. Rice (N. Y.). 7: 1-10.
- Han K, Jeong HJ, Yang HB, Kang SM, Kwon JK, Kim S, et al. 2016. An ultra-high-density bin map facilitates high-throughput QTL mapping of horticultural traits in pepper (Capsicum annuum). DNA Res.. 23: 81-91.
- Huang X, Feng Q, Qian Q, Zhao Q, Wang L, Wang A, et al. 2009. High-throughput genotyping by whole-genome re-sequencing. Genome Res.. 19: 1068-1076.
- Jansen RC. 2004. Quantitative trait loci in inbred lines. Handbook of statistical genetics. Part 3. Animal and plant breeding. John Wiley & Sons. New York, U.S.A: pp. 445-476.
- Ji H, Kim H, Lee GS, Yoon UH, Kim TH, Seol YJ, et al. 2012. Development of rice molecular genetic and physical map using PCR-based DNA markers with the recombinant inbred population derived from Milyang23/Gihobyeo cross. Korean J. Breed. Sci.. 44: 273-281.
- Kosambi DD. 1943. The estimation of map distances from re-combination values. Ann. Eugen.. 12: 172-175.
- Lee HJ, Jeong IS, Ji H, Lee GS, Yoon UH, Kim TH. 2014. Development of new CAPS markers and their application in QTL analysis of stem diameter in rice. Korean J. Breed. Sci.. 46: 116-128.
- Lee YJ, Byeon EJ, Bae SH, Ji H, Lee GS, Yoon UH, et al. 2016. Development of NGS-based new CAPS markers and QTL analysis of stem diameter using Milyang23/Gihobyeo recombinant inbred lines (MGRIL). Korean J. Breed. Sci.. 48: 217-233.
- Liao CY, Wu P, Hu B, Yi KK. 2001. Effects of genetic background and environment on QTLs and epistatics for rice (Oryza sativa L.) panicle number. Theor. Appl. Genet.. 103: 104-111.
- Meng L, Li H, Zhang L, Wang J. 2015. QTL IciMapping: Integrated software for genetic linkage map construction and quantitative trait locus mapping in biparental popu-lations. Crop J.. 3: 269-283.
- Mu P, Li ZC, Li CP, Zhang HL, Wang XK. 2004. QTL analysis for lodging resistance in rice using a DH popu-lation under lowland and upland ecosystems. Acta Genetica Sinica. 31: 717-723.
- Qi X, Li MW, Xie M, Liu X, Ni M, Shao G, et al. 2014. Identification of a novel salt tolerance gene in wild soybean by whole-genome sequencing. Nat. Commun.. 5: 1-11.
- Sasaki A, Ashikari M, Ueguchi-Tanaka M, Itoh H, Nishimura A, Swapan D, et al. 2002. A mutant gibberellin-synthesis gene in rice. Nature. 416: 701-702.
- Singer T, Fan Y, Chang HS, Zhu T, Hazen SP, Briggs SP. 2006. A high-resolution map of Arabidopsis recombinant inbred lines by whole-genome exon array hybridization. PLoS Genet.. 2: 1352-1361.
- Spielmeyer W, Ellis MH, Chandler PM. 2002. Semidwarf (sd-1), "green revolution" rice, contains a defective gib-berellin 20-oxidase gene. Proc. Natl. Acad. Sci. U.S.A.. 99: 9043-9048.
- Spindel J, Wright M, Chen C, Cobb J, Gage J, Harrington S, et al. 2013. Bridging the genotyping gap: using genotyping by sequencing (GBS) to add high-density SNP markers and new value to traditional bi-parental mapping and breeding populations. Theor. Appl. Genet.. 126: 2699-2716.
- Suh JP, Ahn SN, Cho YC, Kang KH, Choi IS, Kim YG, et al. 2005. Mapping of QTLs for yield traits using an ad-vanced backcross population from a cross between Oryza sativa and O. glaberrima. Korean J. Breed. Sci.. 37: 214- 220.
- Takagi H, Abe A, Yoshida K, Kosugi S, Natsume S, Mitsuoka C, et al. 2013a. QTL-req: rapid mapping of quantitative trait loci in rice by whole genome resequencing of DNA from two bulked populations. Plant J.. 74: 174-183.
- Takagi H, Uemura A, Yaegashi H, Tamiru M, Abe A, Mitsuoka C, et al. 2013b. MutMap-Gap: whole-genome resequencing of mutant F2 progeny bulk combined with de novo assembly of gap regions identifies the rice blast resistance gene Pii. New Phytol.. 200: 276-283.
- Terao T, Nagata K, Morino K, Hirose T. 2010. A gene con-trolling the number of primary rachis branches also controls the vascular bundle formation and hence is responsible to increase the harvest index and grain yield in rice. Theor. Appl. Genet.. 120: 875-893.
- Varshney RK, Nayak SN, May GD, Jackson SA. 2009. Next-generation sequencing technologies and their implica-tions for crop genetics and breeding. Trends Biotechnol.. 27: 522-530.
- Wang L, Wang A, Huang X, Zhao Q, Dong G, Qian Q, et al. 2011. Mapping 49 quantitative trait loci at high resolution through sequencing-based genotyping of rice recombi-nant inbred lines. Theor. Appl. Genet.. 122: 327-340.
- Wang S, Basten CJ, Zeng ZB. 2012. Windows QTL Cartog-rapher 2.5. Department of Statistics, North Carolina State University. Raleigh, NC, U.S.A.
- Wei XJ, Xu JF, Guo HN, Jiang L, Chen SH, Yu CY, et al. 2010. DTH8 suppresses flowering in rice, influencing plant height and yield potential simultaneously. Plant Physiol.. 153: 1747-1758.
- Xie W, Feng Q, Yu H, Huang X, Zhao Q, Xing Y, et al. 2010. Parent-independent genotyping for constructing an ultra-high-density linkage map based on population sequencing. Proc. Natl. Acad. Sci. U.S.A.. 107: 10578-10583.
- Xue WY, Xing YZ, Weng XY, Zhao Y, Tang WJ, Wang L, et al. 2008. Natural variation in Ghd7 is an important re-gulator of heading date and yield potential in rice. Nat. Genet.. 40: 761-767.
- Yamamoto T, Taguchi SF, Ukai Y, Sasaki T, Yano M. 2001. Mapping quantitative trait loci for days-to heading, and culm, panicle and internode lengths in a BC1F3 popu-lation using an elite rice variety, Koshihikari, as the recurrent parent. Breed. Sci.. 51: 63-71.
- Yano K, Yamamoto E, Aya K, Takeuchi H, Lo P, Yamasaki M, et al. 2016. Genome-wide association study using whole-genome sequencing rapidly identifies new genes influencing agronomic traits in rice. Nat. Genet.. 48: 927- 934.
- Yu H, Xie W, Wang J, Xing Y, Xu C, Li X, et al. 2011. Gains in QTL detection using an ultra-high density SNP map based on population sequencing relative to traditional RFLP/SSR markers. PLoS One. 6: 1-11.