Abstract
Previously, we mapped the qSPP7 QTL affecting the number of spikelets per panicle (SPP) on rice chromosome 7 using near-isogenic line (NIL WH29001) derived from an interspecific cross between the japonica ‘Hwaseong’ and Oryza minuta. In the present study, we confirmed this QTL using progeny derived from a cross between IL102, a WH29001 sister line and Hwaseong. Genetic analysis determined that qSPP7 was located between a KASP marker KJ07–049 and RM21605. The O. minuta segment on chromosome 7 introgressed into the Hwaseong background was associated with an increase in SPP. The panicle structure of IL102 revealed that not only the number of SPP increased significantly, but also the number of branches per panicle increased as compared to Hwaseong suggesting that the donor allele of qSPP7 promotes branching in the genetic background of Hwaseong. Linkage analysis indicated that qEhd1 on chromosome 10 is involved in the difference in heading date of IL102 and Hwaseong. Experiments under 3 different day length conditions revealed that IL102 always showed earlier heading and higher SPP as compared to Hwaseong indicating that the effect of qSPP7 in the Hwaseong background was not dependent on photoperiod, and SPP increased in proportion to the number of days to heading.
-
Key words: Interspecific cross, Quantitative trait locus, Spikelets per panicle, KASP, Rice
INTRODUCTION
Rice is one of the staple food crops feeding over half of the world’s population. Therefore, increasing rice yield becomes an imperative and challenging task in breeding programs to meet the demands of an ever-increasing global population. Rice grain yield is directly determined by three yield components: panicles per plant, spikelets per panicle, and grain weight. Among them, spikelets per panicle (SPP) shows a wide variation and makes a large contribution to yield output. Therefore, the identification of the SPP-related genes will play a significant role in high-yield rice breeding.
During the past two decades, a number of SPP-related genes/QTLs have been identified using various approaches and mapping populations (
Xing et al. 2008;
Liu et al. 2009;
Balkunde et al. 2013;
Takai et al. 2018;
Ma et al. 2019). Additionally, numerous genes have been cloned, for example,
GN1A (
Ashikari et al. 2005),
Ghd7 (
Xue et al. 2008),
DEP1 (
Huang et al. 2009),
WFP/IPA1 (
Jiao et al. 2010;
Miura et al. 2010),
LP (
Li et al. 2011),
NAL (
Fujita et al. 2013), and
FZP (
Bai et al. 2016). The detected QTLs/genes have been useful to survey genes that govern grain yield among different populations of cultivated rice. These findings have allowed early-generation marker-assisted selection of breeding materials to increase SPP in commercial rice varieties and more efficiently to improve rice yield. However, the continuous use of cultivated rice with desirable genes to increase rice yield in intensive breeding projects narrows the genetic diversity and reduces the exploitation of the genetic material from landraces and wild rice. Thus, identifying the genetic sources through comprehensively understanding the tertiary gene pool can lead to defined exploitation of wild rice and landraces that can partially support the targeted breeding program. The rapid advancement in molecular technologies create opportunities not previously possible, to identify molecular markers associated with desirable traits in wild species.
Recently, Kompetitive Allele-Specific PCR (KASP) has become one of the promising approaches due to their wide distribution within genomes and suitability for high-throughput automated genotyping. KASP markers are highly accurate, inexpensive and highly flexible, has high conversion rates, and good complements for genome-wide association studies (GWAS) (
Yang et al. 2019).
In our previous study, we mapped the
qSPP7 QTL affecting the number of spikelets per panicle (SPP) on rice chromosome 7 using near-isogenic line (NIL WH29001) derived from an interspecific cross between the
japonica ‘Hwaseong’ and
Oryza minuta (
Linh et al. 2008;
Balkunde et al. 2013). In the present study, firstly, we aimed to confirm this QTL and characterize the effect of
qSPP7 on yield-related traits using progeny derived from a cross between IL102, a WH29001 sister and Hwaseong. Secondly, we tried to map the gene responsible for the difference in days to heading between two parents.
MATERIALS AND METHODS
Plant materials
One introgression line, IL102 selected in the generation advancement (BC
5F
3) from the cross between Hwaseong and
O. minuta, was used in this study (
Linh et al. 2008). IL102 showed early heading and higher SPP than the recurrent parent Hwaseong (
Fig. 1,
Table 1). From the previous result that the
qSPP7 is associated with the variation in SPP, we first screened 540 BC
6F
2 plants with 2 SSR markers, RM21596 and RM418 linked to
qSPP7. Ten recombinant plants between two SSR markers were detected and advanced to BC
6F
3 generation. In 2017, these BC
6F
3 lines were grown for agronomic traits evaluation. Among the 540 BC
6F
2, 62 BC
6F
2 plants were randomly selected for genotype and phenotype analysis of the gene responsible for early heading of IL102.
Rice seeds were sown in trays and placed in greenhouse on April 25. Approximately 1 month later, seedlings (one plant per hill) were transplanted with a distance of 15 cm between plants within a row and 30 cm between rows. All plant materials were grown in a bird net-equipped field at the experimental farm of Chungnam National University, Daejeon, South Korea. Completely randomized block design with two replications per genotype was adopted for field-testing. For each replication, one line was grown in a single row of twenty plants. Field management followed normal agricultural practices.
SSR marker analysis
Total genomic DNA of individual plants was extracted from 2–3 cm fresh leaves by using CTAB method as described by
Murray & Thompson (1980) with slight modifications. SSR makers tightly linked to
qSPP7 on chromosome 7 were used for genotyping. The PCR reaction mixtures and PCR conditions were as follows: 2 μL of template DNA (10 ng/μL), 0.8 μL of forward primer (10 pmol) and reverse primer (10 pmol) each, 1 μL of 10x PCR buffer, 2.5 μM of each dNTP, 1 unit of
Taq DNA polymerase. Amplification was achieved using Thermo (BioRad) according to the step-cycle program set for an initial denaturation at 94°C for 5 minutes, 35 cycles of 3 steps following: denaturation at 94°C for 30 seconds, annealing at 55°C for 30 seconds, extension at 72°C for 30 seconds, and lastly, extension at 72°C for 5 minutes. PCR products were run on a 6% polyacrylamide denaturing gel for 1 hour and 15 minutes at 1800–2000V in 0.5X TBE buffer. DNA bands were identified using the Silver Staining Kit (Bioneer Co., Korea).
Hwaseong and IL102 were genotyped with KASP markers at Seed Industry Promotion Center, Foundation of Agri. Tech. Commercialization & Transfer, Korea. The KASP analysis was carried out based on the method described by
Yang et al. (2019). A total of 513 KASP markers were screened to detect
O. minuta chromosomal segments in IL102 and six markers detected the
O. minuta segments on chromosomes 1, 2, 5, 7, 10, and 11 (
Fig. 2).
Total RNAs of all materials were extracted from young panicle at different stages using a RNA isolation kit (MACHEREY-NAGEL GmbH & Co. KG, Germany) according to the user manual. Quality and concentration of the extracted RNA were checked with electrophoresis on a 0.8% agarose gel and measured using the Nanodrop ND-2000 spectrophotometer (NanoDrop Technologies, Wilmington, CA, USA). RNAs after DNase treatment were subjected to reverse transcriptase reactions using oligo(dT) primer and RTase/RI Enzyme Mix (SMART-GENE, SJ Bioscience, Daejeon, Korea) according to the manufacturer’s protocol. Subsequent PCR was conducted with the first-strand cDNA and Emerald Amp
® GT PCR Master Mix (Takara, Shiga, Japan). The amplification was performed in a thermal cycler following the manufacturer’s instructions. The PCR products were analyzed by electrophoresis on a 2% agarose gel and visualized under the UV transilluminator. All primers were designed based on gene sequences and are listed in
Supplementary Table S1.
To identify nucleotide polymorphisms in the coding regions of candidate genes between Hwaseong and IL102, 13 pairs of primers for sequencing were designed based on annotated DNA sequences from the Rice Annotation Project Database IRGSP-1.0 (
Sakai et al. 2013) by using NCBI’s Primer-BLAST software. Multiple sequence alignment was performed using ClustalW. PCR was performed in a total volume of 50 μL and contained 100 ng genomic DNA, using Solg
TM Pfu DNA Polymerase (Solgent Co., Ltd.). PCR conditions were followed according to the manufacturer’s protocol. After purification using a Gel & PCR Purification kit (GeneAll Biotechnology, co., Ltd, Seoul, Korea), PCR products were sequenced by SolGent Co., Ltd (Daejeon, Korea).
Two parent lines Hwaseong and IL102 were synchronously grown under three different daylength conditions: short-day condition 1 (SD1), short-day condition 2 (SD2), and natural long-day condition (ND). For SD1 while maintaining the other natural conditions, rice plants were covered with an opaque black cloth to completely block out the light in a dark room. Every day, plants were covered and moved to the dark room at 6:00 PM and uncovered and moved outside at 10:00 AM, thus giving them 8 hours of daylight and 16 hours of darkness. For SD2, Hwaseong and IL102 were synchronously grown in a growth-chamber under short-day condition (with 10 hour light/14 hour dark, at 28°C, 70% humidity). For ND, Hwaseong and IL102 were grown in the paddy field in 2017. The meteorological data including day-length are available on the website
www.timeanddate.com.
Agronomic traits of two parents (Hwaseong and IL102) and 10 BC6F3 lines were measured at the physiological maturity stage, taking the 10 consecutive plants from the middle of each line. For measuring SPP, number of primary branches per panicle (PBP), number of secondary branches per panicle (SBP), and panicle length (PL), we selected 2 biggest panicles from each of the 10 plants and counted separately. For 1000-grain weight, 100 filled seeds were measured with 5 replicates and calculated for 1000-grain weight. For yield per plant, 5 random plants were measured with 2 replicates and calculated for yield per plant. Amylose content was measured according to the method of Megazyme Amylose/Amylopectin assay kit (Megazyme, Co. Wicklow, Ireland). Heading date of 62 BC6F2 plants was determined individually, and heading date of 10 BC6F3 lines was determined when 50% plants/line showed panicle emergence starting from the date of sowing. All the observed data from plant materials were analyzed using ANOVA followed by Tukey’s test for multiple comparisons. Statistical analysis for mean comparison was performed at the 0.05 significance level.
RESULTS
Phenotypic analysis of parental lines
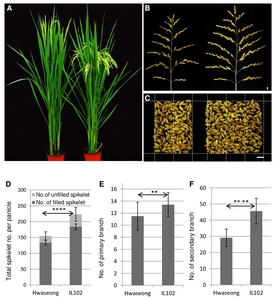
Comparison between the parents was made for agronomic traits. IL102 showed longer panicles than Hwaseong in 2017 (
P < 0.05) and 2018 (
P < 0.01). IL102 had considerably higher SPP, number of primary and secondary branch than the recurrent parent Hwaseong in both years (
Fig. 1). However, spikelet fertility (SF), 1000-grain weight (TGW), panicle number (PN), and amylose content of IL102 were statistically lower than Hwaseong (
Table 1). Grain yield of IL102 increased significantly compared to Hwaseong in 2018, suggesting that an increase in SPP contributed to an increase in grain yield of IL102.
Based on the KASP markers, IL102 has the
O. minuta segment harboring
qSPP7 (
Fig. 2). To confirm and characterize the effect of
qSPP7, 10 recombinant BC
6F
2 plants between 2 SSR markers, RM21596 and RM418 were selected and advanced to BC
6F
3 generation. These 10 recombinants were genotyped with 4 SSR markers and based on the genotype, 10 lines were classified into 5 groups (
Fig. 3). Ten BC
6F
3 lines also displayed a large variation in SPP, PBP, SBP, and spikelets on secondary branches (SSB) (
Table 2). SPP of each of the seven groups including parents showed a wide range from 154 to 233 spikelets. Similarly, the SSB, PBP, and SBP also had a wide variation which ranged from approximately 86 to 157 spikelets, 11.5 to 13.6 branches, and 30 to 48 branches, respectively. However, SPB did not show any significant difference compared to the parents indicating that the effect of
qSPP7 on the number of spikelets per panicle was mainly attributed to greater primary and secondary branching.
Substitution mapping indicated that
qSPP7 was located between RM418 and RM21596 on the long arm of chromosome 7. We classified the target region of
qSPP7 into three small candidate parts (
Fig. 3). Multiple comparisons of the SPP from the recombinant groups were carried out using the two parents as controls (IL102 and Hwaseong). Three groups showed statistically similar SPP to each other: (1) P2 and group E, (2) groups A, B, and C, and (3) P1 and group D. These results indicated that
qSPP7 is located in the interval between a KASP marker KJ07–049 and RM21605. Multiple comparisons of the SPB, SSB, PBP, and SBP from the recombinant groups were also carried out and all three traits except SPB were co-located in the interval between KJ07–049 and RM21605 (
Table 2). The location of
qSPP7 in this study is different from the previous result that
qSPP7 was located in a 28.64-kb region between RM4952 and RM21605 (
Balkunde et al. 2013). Considering that the phenotype of SPP is affected by genetic interaction and environmental factors, it is possible that other unknown
O. minuta gene(s) introgressed into Hwaseong and environments affected the SPP phenotype in 10 BC
6F
3 lines because IL102 has more
O. minuta segments than WH29001 used in the study by
Balkunde et al. (2013).
We delineated
qSPP7 to an interval of 62.5 kb between KJ07–049 and RM21605. According to the Rice Annotation Project database (
Sakai et al. 2013), there are seven predicted genes in the target region for
qSPP7 (
Supplementary Table S2). Among these, 2 genes
LOC_OS07-g30110 and
LOC_OS07g30120 were excluded because of their unknown functions. To identify the gene responsible for the increased SPP in IL102, we compared the sequence of the remaining five candidate genes between two parent lines. However, the sequence in coding regions of the annotated genes had no difference between the parents (data not shown), except for one gene
LOC_OS07g30130. The
LOC_OS07g30130 had four nucleotide substitutions in exon regions and two of these changes are non-synonymous amino acid substitutions (
Fig. 3). We also speculated that the effect at
qSPP7 might result from the difference of the expression levels between the Hwaseong and IL102 alleles caused by different sequence in promoter regions or splicing variants. Semi-qRT-PCR analysis for each of the five genes was performed to determine potential candidate underlying
qSPP7. However, no obvious difference in expression level between the parents at the inflorescence stage was observed (data not shown). We also compared the sequence of
LOC_OS07g30150 gene in the promoter region but no difference between parents was detected.
In addition to more SPP, IL102 also showed early heading than Hwaseong. To know whether
qSPP7 is associated with the difference of heading date between the parents, the number of days to heading among 7 groups: 2 parents and 5 recombinant groups were compared (
Fig. 3A). However, the differences in the heading date among the 7 groups were not associated with the
qSPP7 suggesting the existence of other gene(s) controlling the difference in heading date between parents. To find out candidate genes for heading date, KASP assays were carried out to detect the
O. minuta introgressions in IL102. IL102 has six
O. minuta introgressions including one near
Ehd1 on chromosome 10 (
Fig. 2). To test whether
Ehd1 is associated with heading date, we developed an INDEL marker derived from polymorphic sites within the
Ehd1 genes (
Zhao et al. 2015, Ehd1-INDEL-F-CTGTGTCT AGCTTGCACTACAC, Ehd1-INDEL-R-AATGCTAAC TACAGTTAATAACTGA). Genotype analysis of 62 BC
6F
2 plants indicated that all 13 early heading plants and all 15 late heading plants were homozygous for
O. minuta and Hwaseong alleles, respectively, and 34 plants were heterozygous (
Fig. 4). The segregation of these three genotypes fitted into 1:2:1 ratio. Statistical difference was observed between early heading group and late heading group (
Fig. 4). This result indicated that
Ehd1 is involved in heading date in the population.
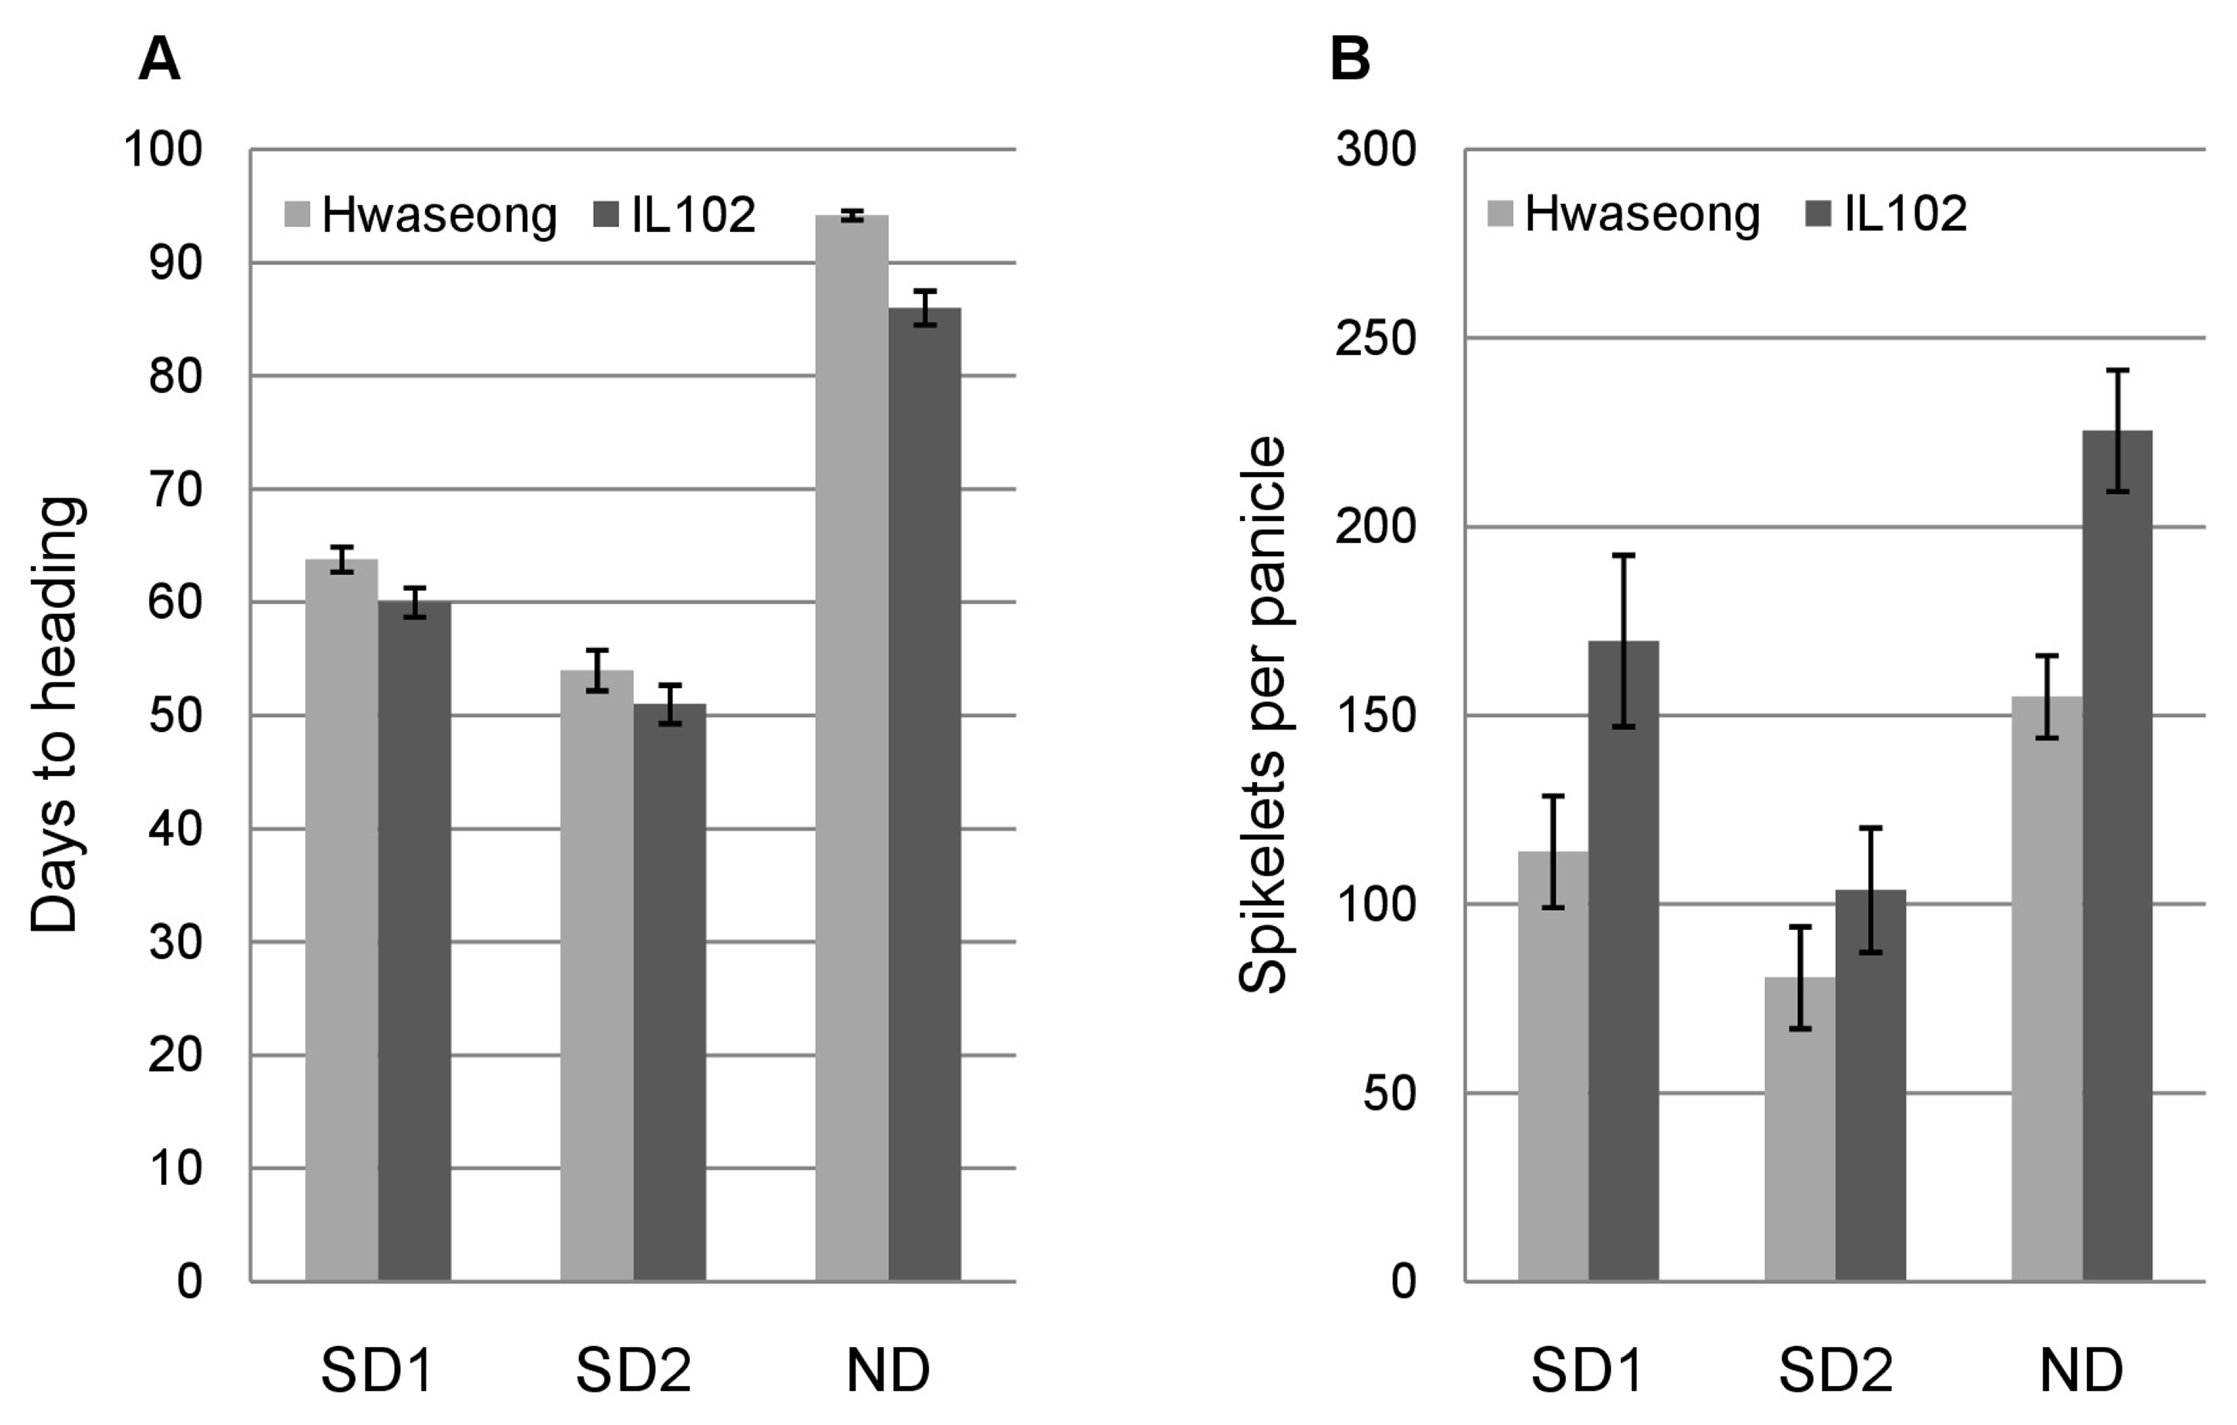
To know whether the effect of
qSPP7 is dependent on photoperiod, we imposed three different day-length conditions for Hwaseong and IL102 (
Fig. 5). At the SD conditions, SD1 with 8 hours of light, and SD2 with 10 hours, the number of days to heading in both parental lines decreased. At ND condition, a delay in heading date was observed in Hwaseong (24–30 days compared to SD1 and SD2) and IL102 (25–31 days compared to SD1 and SD2) indicating that both Hwaseong and IL102 are photoperiod sensitive. The SPP displayed an increase in proportion with the number of days to heading in two parents and the SPP of IL102 was always higher than that of Hwaseong. These results suggested that the effect of
qSPP7 in the Hwaseong background was not dependent on photoperiod.
DISCUSSION
KASP markers are accurate, flexible, have a high conversion rate, and good complements for GWAS (
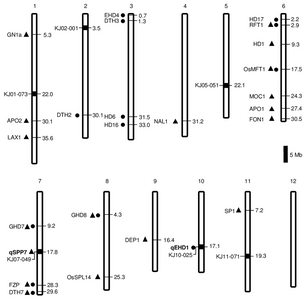
Yang et al. 2019). In this study, 513 loci were used to screen IL102 and Hwaseong and six
O. minuta segments on chromosomes 1, 2, 5, 7, 10, and 11 were detected in IL102. This result suggested that IL102 still possesses
O. minuta segments although phenotypic selection had been practiced in the repeated backcrossing programs and KASP markers might be effectively useful in selecting NILs or recombinants in the generation advancement.
To date, many QTLs/genes for SPP-related traits have been identified and used for developing high-yield rice. Although six QTL for SPP-related traits including
qgpa7,
qSPP7,
Ghd7,
qGL7,
qTSN7.1, and
qSBN7 were located on chromosome 7 (
Tian et al. 2006;
Xing et al. 2008;
Xue et al. 2008;
Bai et al. 2010;
Koide et al. 2013;
Wang et al. 2017), none of them was localized to the same region of
qSPP7 detected in this study suggesting that the
qSPP7 in this study might be different from the previously described QTLs on chromosome 7.
Among the 7 genes identified within the target region, we tried to reduce the number of candidate genes based on the function predicted based on RAP-DB, comparison of coding sequences, and semi-qRT-PCR results. We chose 2 genes which might be responsible for the observed effects of
qSPP7. First,
LOC_Os07g30130 encodes a Myb transcription factor domain containing protein. The MYB family, one of the largest transcription factor (TF) families in the plant, plays vital roles in the whole process of plant growth and development. Comparison of coding sequences between Hwaseong and IL102 showed two missense mutations, Threonine (Hwaseong) to Alanine (IL102) in the first exon and Aspartate (Hwaseong) to Glycine (IL102) in the third exon. We speculated that the amino acid changes might be associated with the variation of SPP at
qSPP7. Additional study using knockdown and overexpression lines will be necessary to characterize this gene. Second,
LOC_Os07g30150 encodes a protein similar to Adenine Phosphoribosyl Transferase (APT) protein. In plants, APT is the key enzyme that converts adenine to adenosine monophosphate (AMP) in the purine salvage metabolism pathway. APT from plants is able to convert cytokinin bases to their corresponding nucleotide forms
in vitro. Several studies reported a possible role of APT in cytokinin metabolism and APT activity has been detected in many plant species in
Arabidopsis (
Zang et al. 2013) and rice (
Zhou et al. 2006). We considered the involvement of this gene in
qSPP7 based on the observations that this gene had the most sensitive response to cytokinin among the seven candidate genes in RiceXpro (ricexpro.dna.affrc.go. jp) and cytokinins have a common effect on inflorescence branching by promoting meristem activity of inflorescence meristem (
Han et al. 2014). However, no sequence difference in the coding and promoter regions of
LOC_Os07g30150 gene between two parents was observed suggesting that this gene might not be casual gene for
qSPP7. However, we cannot rule out the possibility that other genetic mechanisms such as the altering splicing might be involved in
qSPP7 gene considering that
LOC_Os07g30150 has large intron regions (12,521 bp with 5 introns) and 3 transcript variants based on NCBI (
https://www.ncbi.nlm.nih.gov). With different protein isoforms,
LOC_Os07g30150 has different response to cytokinin caused changing in phenotype between Hwaseong and IL102. For further study, we will demonstrate this hypothesis using intron sequencing and altering splicing analysis.
The
qSPP7 increased not only SPP, primary, and secondary branches but also panicle length. Panicle length impacts grain yield by affecting several panicle-related traits such as the number of primary branches per panicle, the number of secondary branches per panicle, and the grain density per panicle. Improving the balance between panicle-related traits is a key in improving SPP in rice (
Jang et al. 2018). However, spikelet fertility, panicle numbers per plant, 1000-grain weight, and amylose content of the IL102 was lower than Hwaseong. These results were not consistent from the previous report that no significance difference between IL-34 and Hwaseong in grain weight and amylose content was observed (
Balkunde et al. 2013). Many studies reported the co-localization of QTLs for heading date and grain quality traits and heading date affected the chemical components including alkali digestion value and amylose content (
Wada et al. 2006;
Hori et al. 2012). This raises the possibility that lower amylose content and grain weight in IL102 might be due to the decrease in the number of days to heading compared to Hwaseong. More spikelets per panicle is often linked with lower fertility which may be caused by severe competition for carbohydrate allocation among grains within a rachis, consequently causing poor grain filling (
Nagata et al. 2002). Taken together,
qSPP7 was useful for balancing panicle-related traits considering that IL102 showed higher yield than Hwaseong despite lower fertility and 1000-grain weight. In addition, the phenotype of SPP is easily affected by genetic interaction and environmental factors. To facilitate the use of
qSPP7 in rice breeding, future work should focus on understanding the effect of
qSPP7 in diverse genetic backgrounds and/or environments.
Recent studies have shown that many flowering time genes often play important roles in controlling grain yield. It is generally believed that longer vegetative periods result in greater grain production. In fact, the pleiotropy of heading date on the other agronomic traits has only been confirmed for a few genes such as Ghd7 and DTH8/Ghd8. In this regard, the effect of rice flowering time genes on the developmental mechanism of plant architecture including panicle formation needs to be clarified. In this study, KASP analysis indicated that IL102 has six O. minuta segments on six chromosomes in Hwaseong background and displayed earlier heading and more SPP than Hwaseong. Multiple comparisons of days to heading among 7 recombinant groups confirmed that qSPP7 was not responsible for the difference in heading between the parents. Genetic analysis confirmed that Ehd1 on chromosome 10 might be involved in the difference in heading date of IL102 and Hwaseong. For this, an InDel marker derived from polymorphic sites within the Ehd1 gene was employed to genotype 62 BC6F2 plants. The results indicated that the segregation ratio of three genotypes (13 Hwaseong homo: 34 hetero: 15 O. minuta homo) fits into 1:2:1 ratio (χ2 = 1.09, 0.5 < P < 0.9). The mean of days to heading of the Hwaseong homozygotes was significantly higher than that of the O. minuta homozygotes indicating that Ehd1 is involved in heading date in the population (R2 = 42.4%). Altogether, this study indicates that IL102 with qSPP7 and qEhd1 alleles from O. minuta could be employed as breeding materials to develop early heading and high-yielding japonica rice in breeding programs.
Supplementary Information
ACKNOWLEDGEMENTS
This work was carried out with the support of “Co-operative Research Program for Agriculture Science and Technology Development (Project No. PJ01321401)” Rural Development Administration, Republic of Korea.
Fig. 1Phenotypic performance of Hwaseong and IL102. (A) Image of Hwaseong and IL102, (B) Panicle structure of Hwaseong and IL102, (C) Image of spikelets per panicle of Hwaseong and IL102, Scale bar = 1 cm. (D) Comparison of total spikelet number per panicle, (E) number of primary branches per panicle, (F) number of secondary branches per panicle. Data presented are means with error bars indicating SD (n = 10 plants).

Fig. 2Positional comparison of genes/QTLs for heading date and/or spikelet numbers with the O. minuta segments in Hwaseong background. Genes/QTLs for heading date (black circle) and spikelet numbers (black triangle) detected by previous studies are indicated on the left side. The positions of known genes/QTLs are based on RAP-BD (Mb) (rapdb.dna.affrc.go.jp). Black boxes indicate O. minuta segments detected by KASP markers in Hwaseong background. The detected QTLs in this study are written in bold letters. The bar indicates 5 Mb.

Fig. 3Substitution mapping of QTL for SPP on chromosome 7. (A) Graphical genotypes of five BC6F2 recombinant groups (A to E) from the cross between Hwaseong (P1) and IL102 (P2). Black, homozygous for O. minuta; white, homozygous for Hwaseong; gray, heterozygous for Hwaseong and O. minuta; hatched, recombination regions. Positions of DNA markers are indicated by vertical lines, # No. of recombinant lines in each group. The broken vertical lines indicate the location of qSPP7 candidate region. The table to the right of the graphical genotypes indicates the mean values of SPP and DTH (days to heading) for each group. The numbers followed by different letters in each column are significantly different at P < 0.05, based on the Tukey test. (B) Candidate genes for qSPP7 according to RAP-DB. The length of pentagon indicates nucleotide length. Bar = 3 kb. (C) Gene structure and variable sites of LOC_Os07g30130 in Hwaseong and IL102. Exons are indicated in gray boxes and non-synonymous nucleotide substitutions are indicated in bold letters. Positions of amino acids are indicated by vertical lines with numbers.
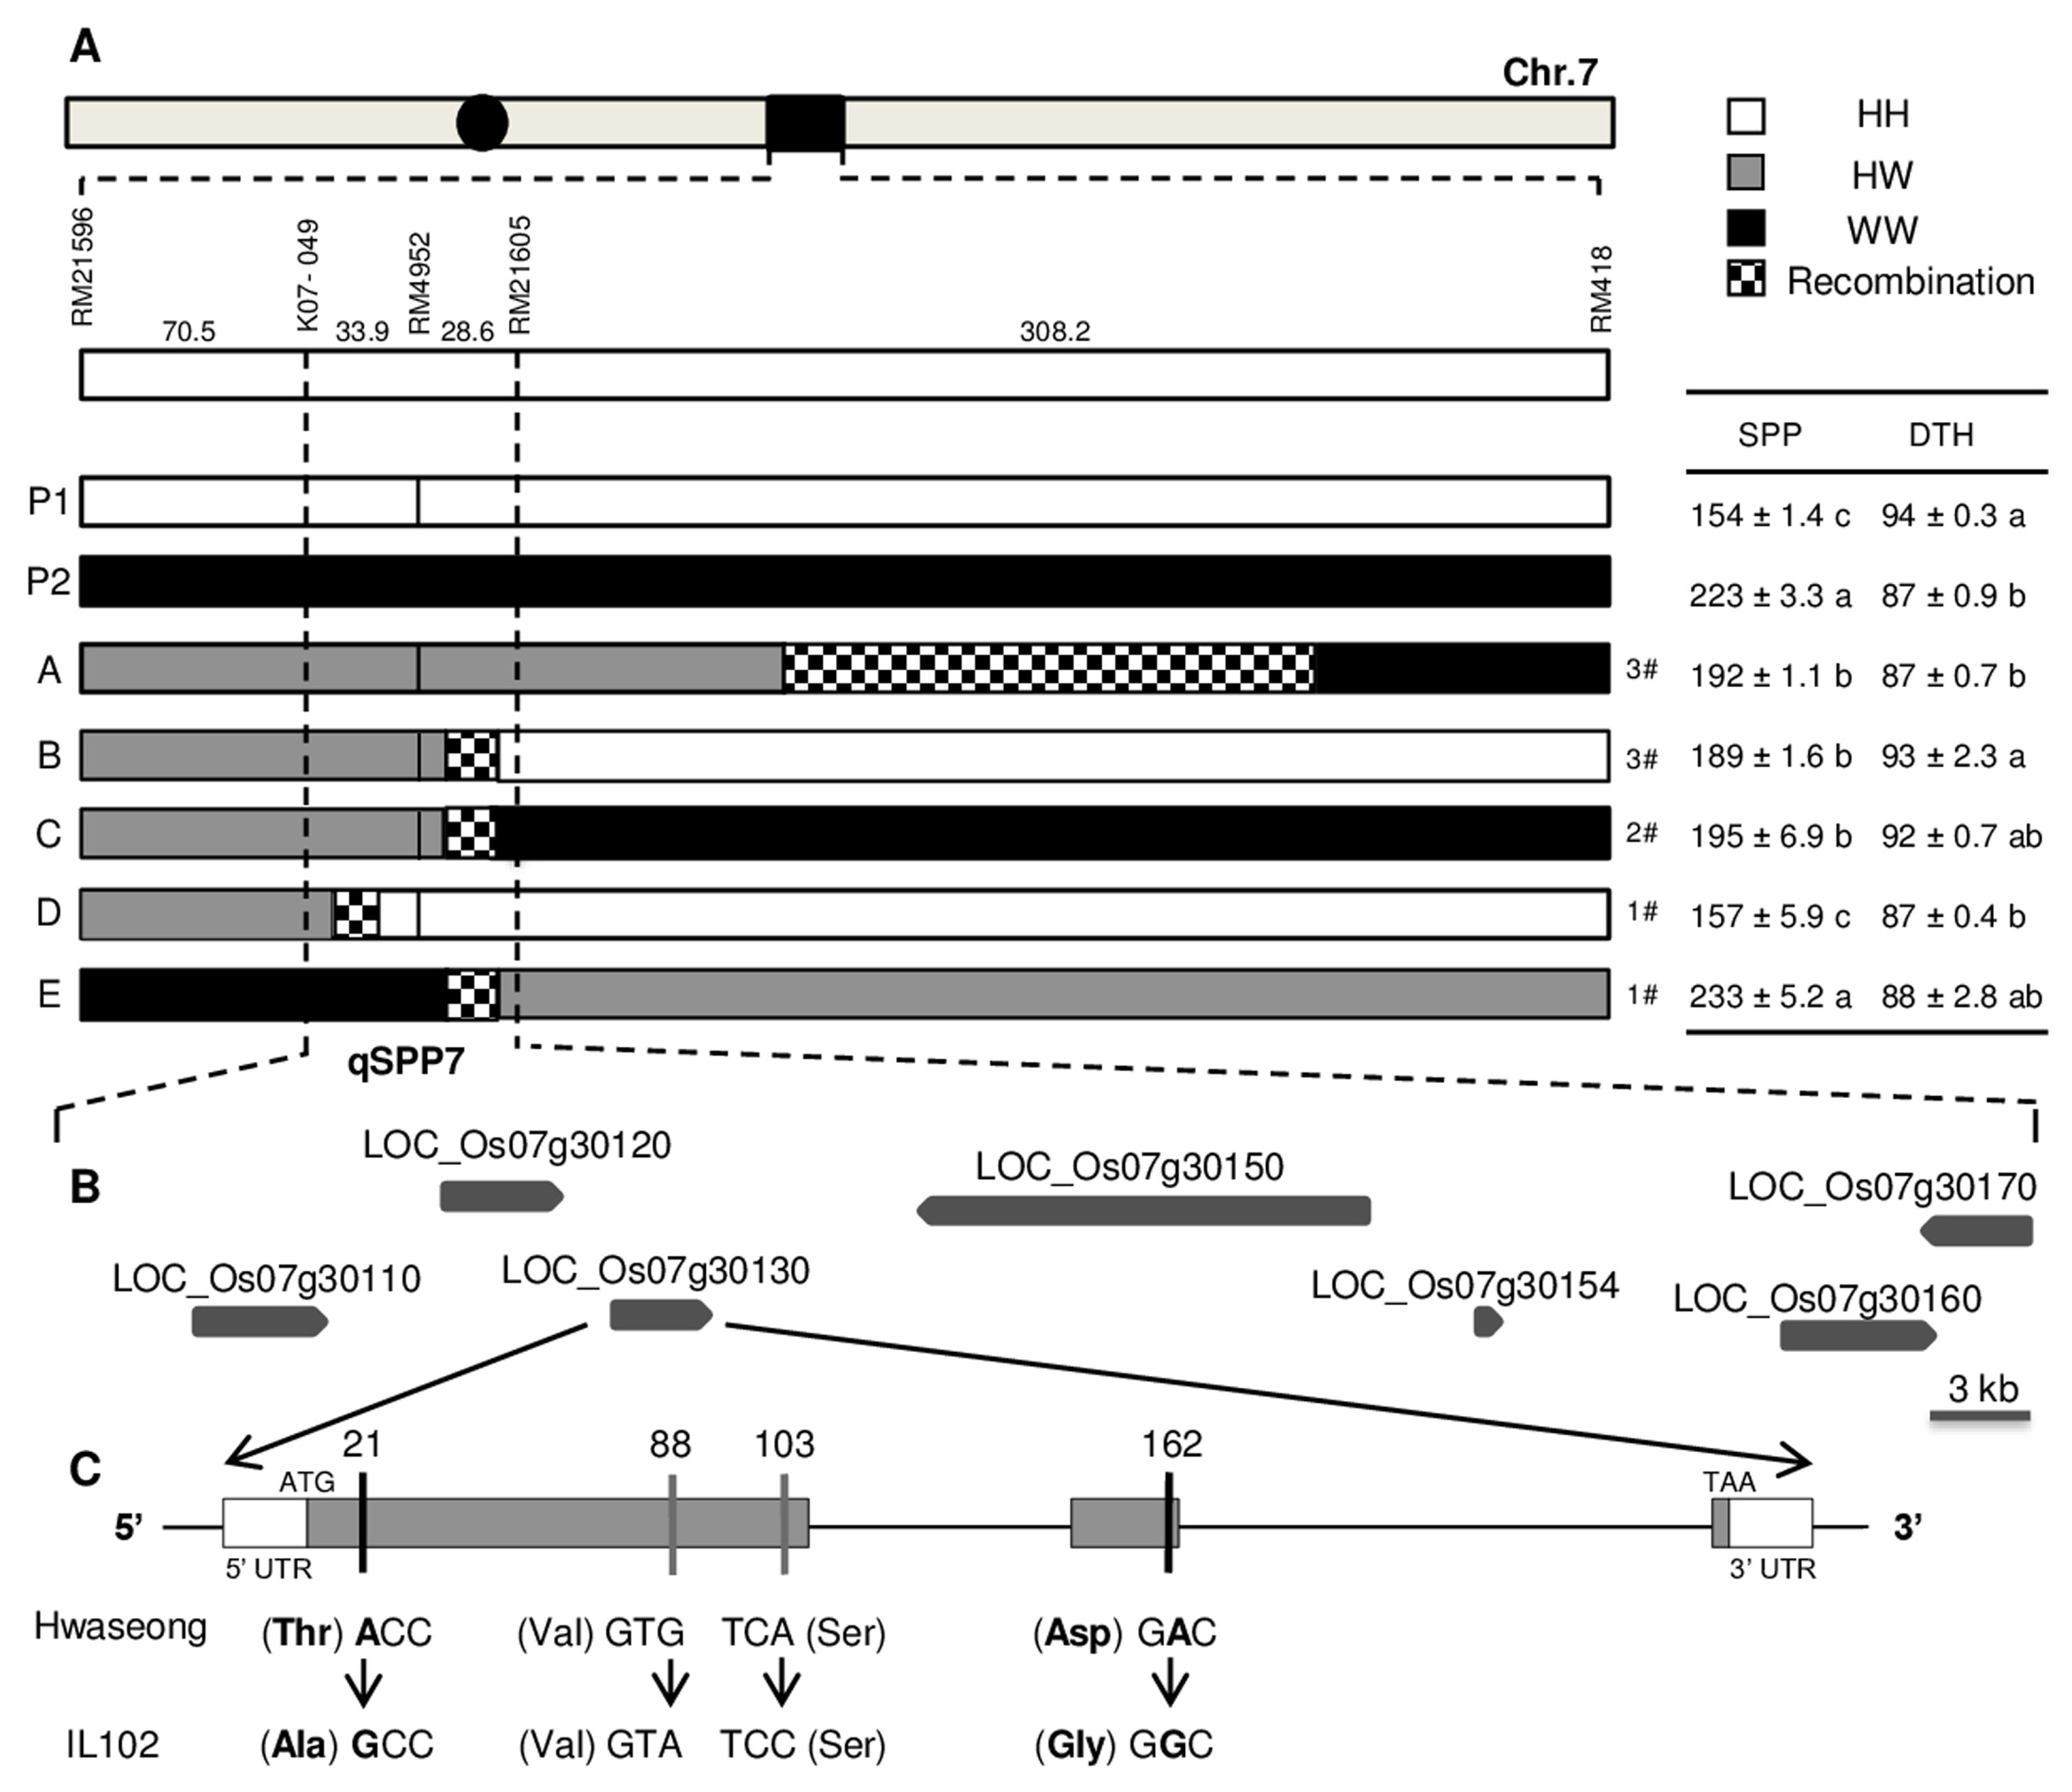
Fig. 4Statistical analysis for three genotypes of 62 BC6F2 plants. Means with the different letter are significantly different from each other (P < 0.05 ANOVA followed by Tukey test). Error lines represent ± standard deviation of the mean, (HH) Hwaseong type, (HW) heterozygous, and (WW) IL102 type.
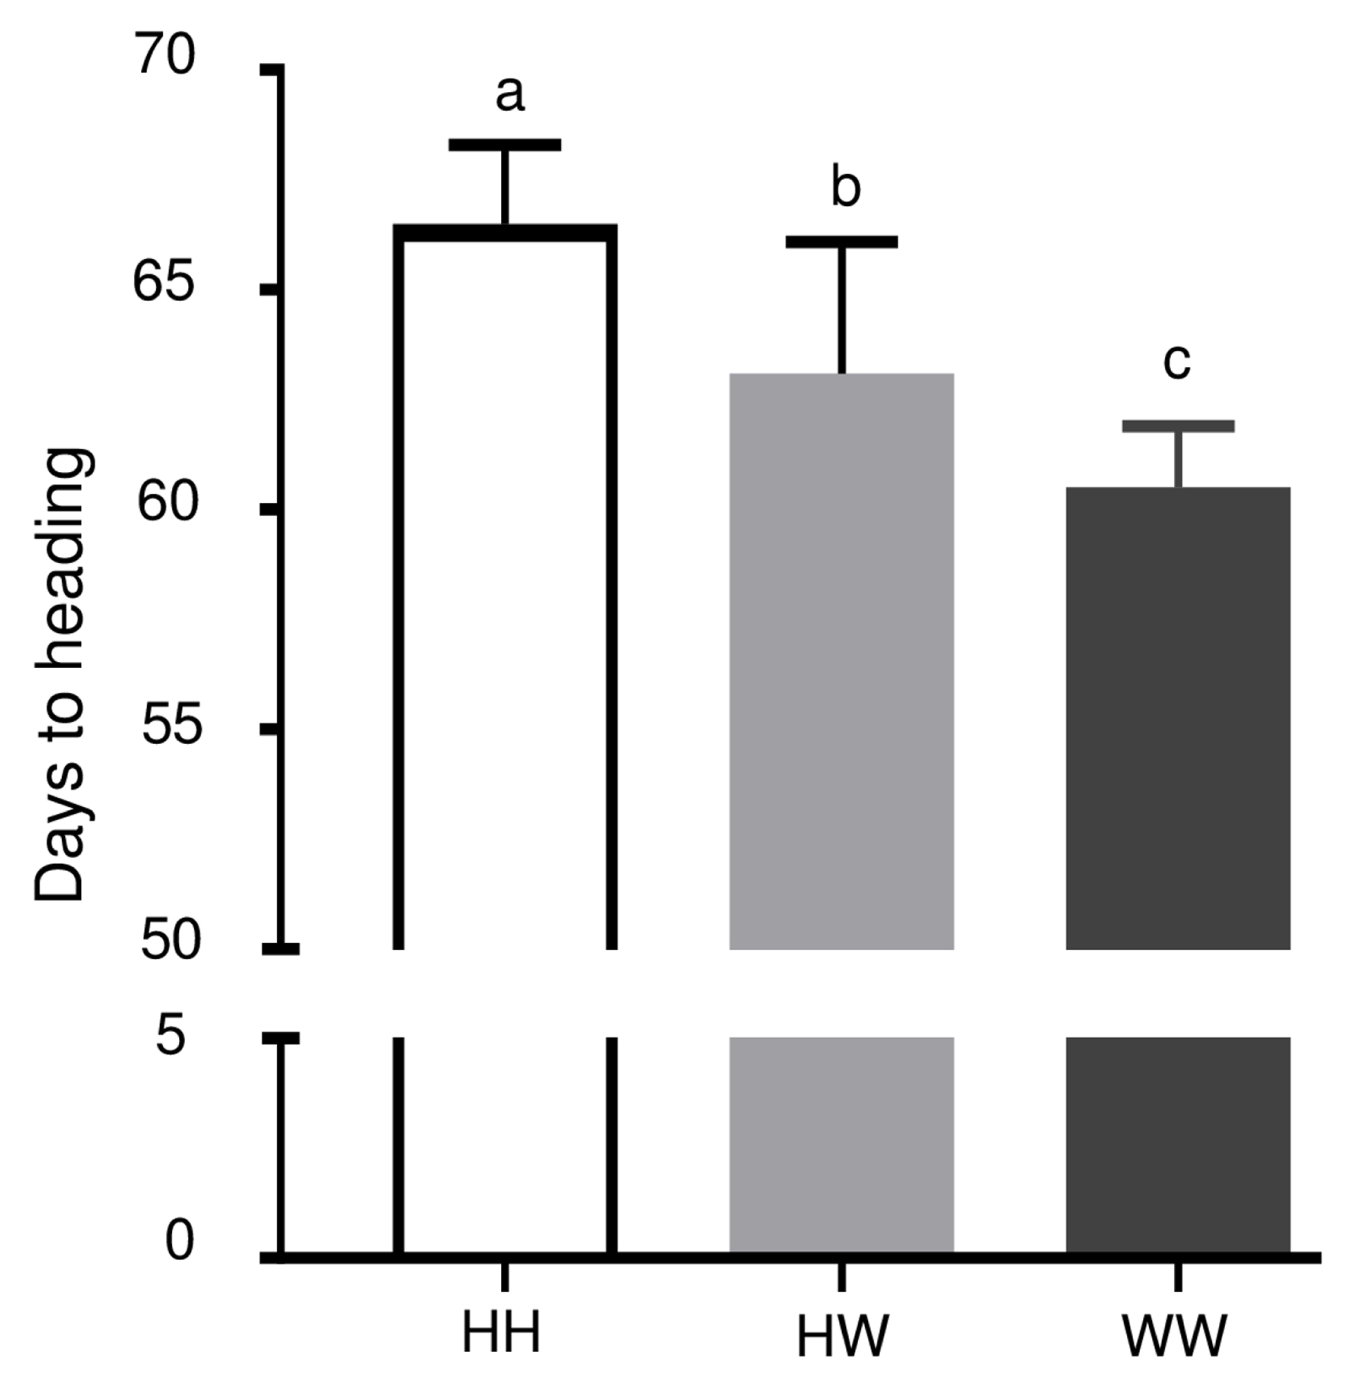
Fig. 5Comparisons of Hwaseong and IL102 under different day-length conditions. (A) Comparison of days to heading, (B) Comparison of spikelets per panicle. SD1: plants were grown under growth-chamber condition (8 hour light–16 hour dark), SD2: plants were grown under dark-room condition (10 hour light–14 hour dark), ND: Plants were grown in the paddy field.

Table 1Comparison of agronomic traits between Hwaseong and IL102 in 2017 and 2018.
Table 1
|
Traitz)
|
2017 |
2018 |
|
|
|
Mean ± SD |
Significance |
Mean ± SD |
Significance |
|
|
|
Hwaseong |
IL102 |
Hwaseong |
IL102 |
|
DTH (days) |
94.0 ± 2.0 |
86.0 ± 2.0 |
****
|
93.4 ± 0.5 |
89.6 ± 0.5 |
****
|
|
SPP |
154.0 ± 1.4 |
223.0 ± 3.3 |
****
|
146.0 ± 5.2 |
254.0 ± 11.7 |
****
|
|
PBP |
11.5 ± 0.2 |
13.4 ± 1.2 |
***
|
10.6 ± 0.6 |
13.1 ± 0.5 |
****
|
|
SBP |
29.1 ± 0.5 |
45.6 ± 4.5 |
****
|
26.7 ± 1.5 |
50.3 ± 2.3 |
****
|
|
PN |
13.4 ± 1.2 |
11.6 ± 0.7 |
*
|
15.1 ± 1.2 |
13.4 ± 0.3 |
*
|
|
PL (cm) |
23.5 ± 0.6 |
24.7 ± 0.4 |
*
|
23.1 ± 0.5 |
24.6 ± 0.5 |
**
|
|
SF (%) |
86.9 ± 0.8 |
85.0 ± 3.2 |
ns |
94.1 ± 0.6 |
87.7 ± 1.1 |
*
|
|
TGW |
24.2 ± 0.8 |
22.2 ± 0.8 |
**
|
24.6 ± 0.5 |
22.8 ± 0.4 |
****
|
|
GY (g) |
NA |
NA |
- |
31.3 ± 1.7 |
39.9 ± 4.1 |
**
|
|
Amy (%) |
15.6 ± 0.1 |
13.3 ± 0.1 |
****
|
14.6 ± 0.4 |
12.7 ± 0.1 |
****
|
Table 2Phenotypic variation in the parents and F3 recombinant lines in 2017.
Table 2
|
Groupz)
|
SPBy)
|
SSB |
PBP |
SBP |
|
P1 |
75 ± 6.3ns |
79 ± 3.5c |
11.5 ± 0.2b |
29.1 ± 0.5d |
|
P2 |
75 ± 1.8ns |
148 ± 5.2a |
13.4 ± 1.2a |
45.6 ± 4.5ab |
|
A |
73 ± 3.5ns |
119 ± 4.2b |
12.8 ± 0.1ab |
37.4 ± 0.5c |
|
B |
74 ± 3.0ns |
115 ± 1.2b |
13.1 ± 0.1ab |
35.9 ± 0.6cd |
|
C |
76 ± 0.1ns |
119 ± 7.8b |
13.5 ± 0.1a |
38.3 ± 2.1bc |
|
D |
71 ± 1.3ns |
86 ± 4.7c |
11.5 ± 0.1b |
29.5 ± 0.9d |
|
E |
76 ± 0.3ns |
157 ± 5.4a |
13.6 ± 0.1a |
47.4 ± 1.1a |
References
- Ashikari M, Sakakibara H, Lin S, Yamamoto T, Takashi T, Nishimura A, et al. 2005. Cytokinin oxidase regulates rice grain production. Science. 309: 741-745.
- Bai X, Huang Y, Mao D, Wen M, Zhang L, Xing Y. 2016. Regulatory role of FZP in the determination of panicle branching and spikelet formation in rice. Sci Rep. 6: 19022
- Bai X, Luo LJ, Yan WH, Rao KM, Zhan W, Xing Y. 2010. Genetic dissection of rice grain shape using a recombinant inbred line population derived from two contrasting parents and fine mapping a pleiotropic quantitative trait locus qGL7. BMC Genet. 11: 16-26.
- Balkunde S, Le HL, Lee HS, Kim DM, Kang JW, Ahn SN. 2013. Fine mapping of a QTL for the number of spikelets per panicle by using near-isogenic lines derived from an interspecific cross between Oryza sativa and Oryza minuta. Plant Breed. 132: 70-76.
- Fujita D, Trijatmiko KR, Tagle AG, Sapasapa MV, Koide Y, Sasaki K, et al. 2013. NAL1 allele from a rice landrace greatly increases yield in modern indica cultivars. Proc Natl Acad Sci USA. 110: 20431-20436.
- Han Y, Yang H, Jiao Y. 2014. Regulation of inflorescence architecture by cytokinins. Front Plant Sci. 5: 669
- Hori K, Kataoka T, Miura K, Yamaguchi M, Saka N, Nakahara T, et al. 2012. Variation in heading date conceals quantitative trait loci for other traits of importance in breeding selection of rice. Breed Sci. 62: 223-234.
- Huang X, Qian Q, Liu Z, Sun H, He S, Luo D, et al. 2009. Natural variation at the DEP1 locus enhances grain yield in rice. Nat Genet. 41: 494-497.
- Jang S, Lee Y, Lee G, Seo J, Lee D, Yu Y, et al. 2018. Association between sequence variants in panicle development genes and the number of spikelets per panicle in rice. BMC Genet. 19: 5
- Jiao Y, Wang Y, Xue D, Wang J, Yan M, Liu G, et al. 2010. Regulation of OsSPL14 by OsmiR156 defines ideal plant architecture in rice. Nat Genet. 42: 541-544.
- Koide Y, Fujita D, Tagle AG, Sasaki K, Ishimaru T, Ishimaru T, et al. 2013. QTL for spikelet number from a high-yielding rice variety, Hoshiaoba, detected in an introgression line with the genetic background of an indica rice variety, IR64. Euphytica. 192: 97-106.
- Li M, Tang D, Wang K, Wu X, Lu L, Yu H, et al. 2011. Mutations in the F-box gene LARGER PANICLE improve the panicle architecture and enhance the grain yield in rice. Plant Biotechnol J. 9: 1002-1013.
- Linh LH, Hang NT, Jin FX, Kang KH, Lee YT, Kwon SJ, et al. 2008. Introgression of a quantitative trait locus for spikelets per panicle from Oryza minuta to the O. sativa cultivar Hwaseongbyeo. Plant Breed. 127: 262-267.
- Liu T, Mao D, Zhang S, Xu C, Xing Y. 2009. Fine mapping SPP1, a QTL controlling the number of spikelets per panicle, to a BAC clone in rice (Oryza sativa). Theor Appl Genet. 118: 1509-1517.
- Ma F, Zhu X, Wang H, Wang S, Cui G, Zhang T, et al. 2019. Identification of QTL for kernel number-related traits in a rice chromosome segment substitution line and fine mapping of qSP1. Crop J. 7: 494-503.
- Miura K, Ikeda M, Matsubara A, Song XJ, Ito M, Asano K, et al. 2010. OsSPL14 promotes panicle branching and higher grain productivity in rice. Nat Genet. 42: 545-549.
- Murray HG, Thompson WF. 1980. Rapid isolation of high molecular weight DNA. Nucleic Acids Res. 8: 4321-4325.
- Nagata K, Fukuta Y, Shimizu H, Yagi T, Terao T. 2002. Quantitative trait loci for sink size and ripening traits in rice (Oryza sativa L.). Breed Sci. 52: 259-273.
- Sakai H, Lee SS, Tanaka T, Numa H, Kim J, Kawahara Y, et al. 2013. Rice annotation project database (RAP-DB): An integrative and interactive database for rice genomics. Plant Cell Physiol. 54: e6
- Takai T, Nakano H, Yoshinaga S, Kondo M. 2018. Identification of a novel QTL for the number of spikelets per panicle using a cross between indica- and japonica- type high-yielding rice cultivars in Japan. Plant Breed. 137: 109-117.
- Tian F, Zhu Z, Zhang B, Tan L, Fu Y, Wang X, et al. 2006. Fine mapping of a quantitative trait locus for grain number per panicle from wild rice (Oryza rufipogon Griff.). Theor Appl Genet. 113: 619-629.
- Wada T, Uchimura Y, Ogata T, Tsubone M, Matsue Y. 2006. Mapping of QTLs for physicochemical properties in Japonica rice. Breed Sci. 56: 253-260.
- Wang SS, Chen RK, Chen KY, Liu CY, Kao SM, Chung CL. 2017. Genetic mapping of the qSBN7 locus, a QTL controlling secondary branch number per panicle in rice. Breed Sci. 67: 340-347.
- Xing YZ, Tang WJ, Xue WY, Xu CG, Zhang Q. 2008. Fine mapping of a major quantitative trait loci, qSSP7, controlling the number of spikelets per panicle as a single Mendelian factor in rice. Theor Appl Genet. 116: 789-796.
- Xue W, Xing Y, Weng X, Zhao Y, Tang W, Wang L, et al. 2008. Natural variation in Ghd7 is an important regulator of heading date and yield potential in rice. Nat Genet. 40: 761-767.
- Yang G, Chen S, Chen L, Sun K, Huang C, Zhou D, et al. 2019. Development of a core SNP arrays based on the KASP method for molecular breeding of rice. Rice (N Y). 12: 21
- Zhang X, Chen Y, Lin X, Hong X, Zhu Y, Li W, et al. 2013. Adenine phosphoribosyl transferase 1 is a key enzyme catalyzing cytokinin conversion from nucleobases to nucleotides in Arabidopsis. Mol Plant. 6: 1661-1672.
- Zhao J, Chen H, Ren D, Tang H, Qiu R, Feng J, et al. 2015. Genetic interactions between diverged alleles of Early heading date 1 (Ehd1) and Heading date 3a (Hd3a)/ RICE FLOWERING LOCUS T1 (RFT1) control differential heading and contribute to regional adaptation in rice (Oryza sativa). New Phytol. 208: 936-948.
- Zhou CJ, Li J, Zou JC, Liang FS, Ye CJ, Jin DM, et al. 2006. Cloning and characterization of a second form of the rice adenine phosphoribosyl transferase gene (OsAPT2) and its association with TGMS. Plant Mol Biol. 60: 365-376.