Abstract
Perilla species (Lamiaceae) have been used as a resource for oilseeds and vegetables, and medicinal purposes. Cytogenetic studies based on chromosomal composition are essential to understand the basic genome structure of a species and to provide vital information for crop improvements. However, only a few studies have assessed the cytogenetic aspects of Perilla species. Fluorescence in situ hybridization (FISH) karyotypes using 5S and 45S rDNA probes were analyzed for the wild and cultivated species of Perilla: P. citriodora and P. frutescens. Chromosome complements were diploid in P. citriodora and allotetraploid in P. frutescens. The chromosome length ranged from 3.07 to 4.92 μm and 2.41 to 5.73 μm in the diploid and allotetraploid variants, respectively. The karyotypic formula was 2n = 12m + 8sm (2 satellites) for P. citriodora and 2n = 20m + 20sm (2 satellites) for P. frutescens. A pair of 5S signals was detected in the telomeric region of chromosome pair 7, while a pair of 45S rDNA signals was detected in the telomeric region extending through the satellite region of chromosome 2 of P. citriodora. However, two pairs of 5S signals were detected from the interstitial to the telomeric regions of chromosome 7 and 17, and a pair of 45S rDNA signals was located on the satellite region of chromosome 20 of P. frutescens. This result will provide useful information to develop a breeding program and to construct the chromosomal backbone for the ongoing genome sequence assembly project.
-
Key words: Perilla, Fluorescence in situ hybridization (FISH), 5S rDNA, 45S rDNA
INTRODUCTION
Perilla is an upright, bushy annual plant, belonging to the mint family Lamiaceae (
Nitta et al. 2005;
Vaughan and Geissler 2009). The genus consists of one tetraploid species,
P. frutescens (L.) Britt. and three diploid species,
P. citriodora (Makino) Nakai,
P. hirtella Nakai, and
P. setoyensis G. Honda (
Nitta et al. 2005;
Ito and Honda 2007).
P. frutescens is an allotetraploid species derived from a diploid donor,
P. citriodora (
Honda et al. 1994). However, the three diploid species might also be the parents of the allotetraploid species (
Nitta et al. 2005).
The members of the genus
Perilla are generally known for having square stems, four stamens (
Brenner 1993) and wrinkled, serrated, and broad ovate leaves with medium green and purple colorations (
Lee and Ohnishi 2001). The plants naturally grow near roadsides, wastelands, and farm fields (
Sa et al. 2015). The limited distribution of
Perilla species is a result of biotic and abiotic external conditions and physiological reactions to various stress factors in the environment such as temperature fluctuation (
Larcher 2003).
Cytogenetic investigations based on chromosome number, structure, and ploidy are needed for breeding and development purposes of the species, due to the growing demand for
Perilla species in agriculture as a vegetable and for seed oil for medicinal purposes (
Kato et al. 2005). A molecular cytogenetic study using fluorescence
in situ hybridization (FISH) is a promising technique in the research on genome functions, ploidy levels, alien gene introgressions and genome evolution (
Hwang et al. 2009). Clarifying genome structures, identifying chromosome counts, physically locating repeats and genes, and knowing genome rearrangements like chromosomal segment inversions, duplications, and translocations (
Pellerin et al. 2018;
Zhou et al. 2018) offer an overview of the chromosome constitution, organization, and pairing (
Han et al. 2008).
Cytogenetic markers such as tandem repeats of 5S and 45S rDNAs provide excellent information on homologous chromosome pairing, DNA sequence location and genome organization (
Heslop-Harrison 2000;
Waminal et al. 2018). The highly conserved coding regions of these rDNAs are essential to ribosome functioning (
Lapitanz 1992). The 5S and 45S rDNAs typically appear in closely related groups (
Bergeron and Drouin 2008) in independent loci in the eukaryotic phylogenetic lineage (
Heslop-Harrison 2000;
Wicke et al. 2011). These commonly called eukaryotic ‘universal gene families’ showed intra- and inter-populational, numerical, and positional variations in most species (
Mantovani et al. 2005). Changes in the chromosomal distribution correlate to the rate of speciation (
Heslop-Harrison 2000).
The 120 bp coding gene of the 5S rDNA repeat unit with its relatively short intergenic spacer (IGS) of around 100 to 1,000 bp (
Galián et al. 2012) has gene copies varying from 2,000 to 75,000. Copies of these genes can be found in either the inter- or intra-chromosomal region and at multiple loci (
Wicke et al. 2011). The nucleolar organizing region (NOR) of the 45S rDNA repeat unit consists of three coding regions (18S, 5.8S, and 25S/26S/28S), internal transcribed spacers between genes (ITS1 and ITS2), and a long intergenic spacer (IGS) separating adjacent repeats. The NOR-forming 45S rDNA is a highly conserved region consisting of up to 10% plant genome (
Heslop-Harrison 2000;
Galián et al. 2012).
In this study, we carried out a FISH karyotype analysis on the two species of Perilla: the cultivated P. frutescens (L) Britt. and the wild P. citriodora (Makino) Nakai, using 5S rDNA and 45S rDNA probes. The results could provide elemental information of the genome which can be used in a breeding program and clarify interspecific relationships in the genus Perilla.
MATERIALS AND METHODS
Plant samples
The seeds of
Perilla citriodora and
P. frutescens ‘Deulkkae’ were provided by Professor Lee Ju Kyong (Kangwon National University) and Dr. Lee Myoung Hee (National Institute of Crop Science, RDA), respectively. In a petri dish containing a paper moistened with distilled water, seeds were cautiously germinated at room temperature until roots of 2 cm in length were harvested. The root samples were pretreated with 2 mM 8-hydroxy-quinoline for 5 hours at 18°C, fixed in Carnoy’s fixative for 2 hours, and stored in 70% ethanol (
Pellerin et al. 2018).
Somatic chromosome spreads were prepared following
Waminal et al. (2018) and
Zhou et al. (2018). The pretreated meristematic root tips were dissected and enzymatically digested in a 1% pectolyase and 2% cellulase for 1.5 hours at 37°C. Root tips were then washed with distilled water and resuspended in an aceto-ethanol solution (9:1 v/v). The suspension was pipetted onto pre-warmed slides in a humid chamber, air-dried, and fixed in 2% formaldehyde for 5 minutes (
Vrána et al. 2012). A series of ethanol treatments were used for dehydration (70%, 90%, and 100%) (
Pellerin et al. 2018).
Complying to
Waminal et al. (2018), a 9 kb 45S (18S-5.8S-25S) rDNA (
Gerlach and Bedbrook 1979) fragment was labeled with biotin-16-dUTP by nick translation (Roche, Germany). The 5S rDNA was obtained according to the procedure described by
Hwang et al. (2009) and labeled with digoxigenin-11-dUTP using a PCR DIG Probe Synthesis Kit (Roche, Germany) and using genomic DNA as a template following the protocol described by (
Koo et al. 2002).
Flourescence
in situ hybridizaztion (FISH) karyotypes using 5S and 45S rDNA probes were analyzed for the wild and cultivated species of
Perilla:
P. citriodora and
P. frutescens. The procedures were carefully adapted from
Pellerin et al. (2018). The hybridization mixture comprised of 50% formamide, 10% dextran sulfate, 2× saline-sodium citrate buffer (SSC), 5 ng/μL salmon sperm DNA, and 500 ng/μL per DNA probe and was repleted with nuclease-free water to a total volume of 40 μL per slide. The mixture was denatured at 90°C for 10 minutes, and 40 μL was added to each slide. Chromosomes were denatured at 80°C for 5 minutes and incubated overnight in a humidity chamber at 37°C. Later, the slides were stringently washed using 2 × SSC at 20°C to 25°C for 10 minutes, 0.1 × SSC at 42°C for 25 minutes, and 2 × SSC at room temperature for 5 minutes; followed by dehydration in an ethanol series (70%, 90%, and 95%) at room temperature. The slides were air-dried and counterstained with 1 μg/mL of 4′,6-diamidino-2-phenylindole (DAPI) in Vectashield (Vector Labs, H-1000, USA), and observed under an Olympus BX53 fluorescence microscope (Olympus America Corp., USA) equipped with a Leica DFC365 FS CCD camera (Leica microsystem Inc., Germany) using an oil lens (×100 magnification). The captured images were sorted out using Cytovision ver. 7.2 (Leica Microsystems, Germany). Adobe Photoshop CS6 was used for image enhancement and ideogram preparation. Mitotic metaphase chromosome spreads were used to analyze the FISH karyotype. The chromosomes were paired according to chromosomal size, centromeric position, and ribosomal signals, and arranged in a decreasing order based on total chromosome length (
Levan et al. 1964;
Waminal and Kim 2018).
RESULTS
The seeds from Perilla species yielded healthy root tips after 3–5 days of germination, which is required for metaphase spread preparation. Clear metaphase spreads without overlapping chromosome arms could easily be observed under a fluorescence microscope by counter-staining with DAPI. The chromosome spreads were successfully investigated through the FISH technique.
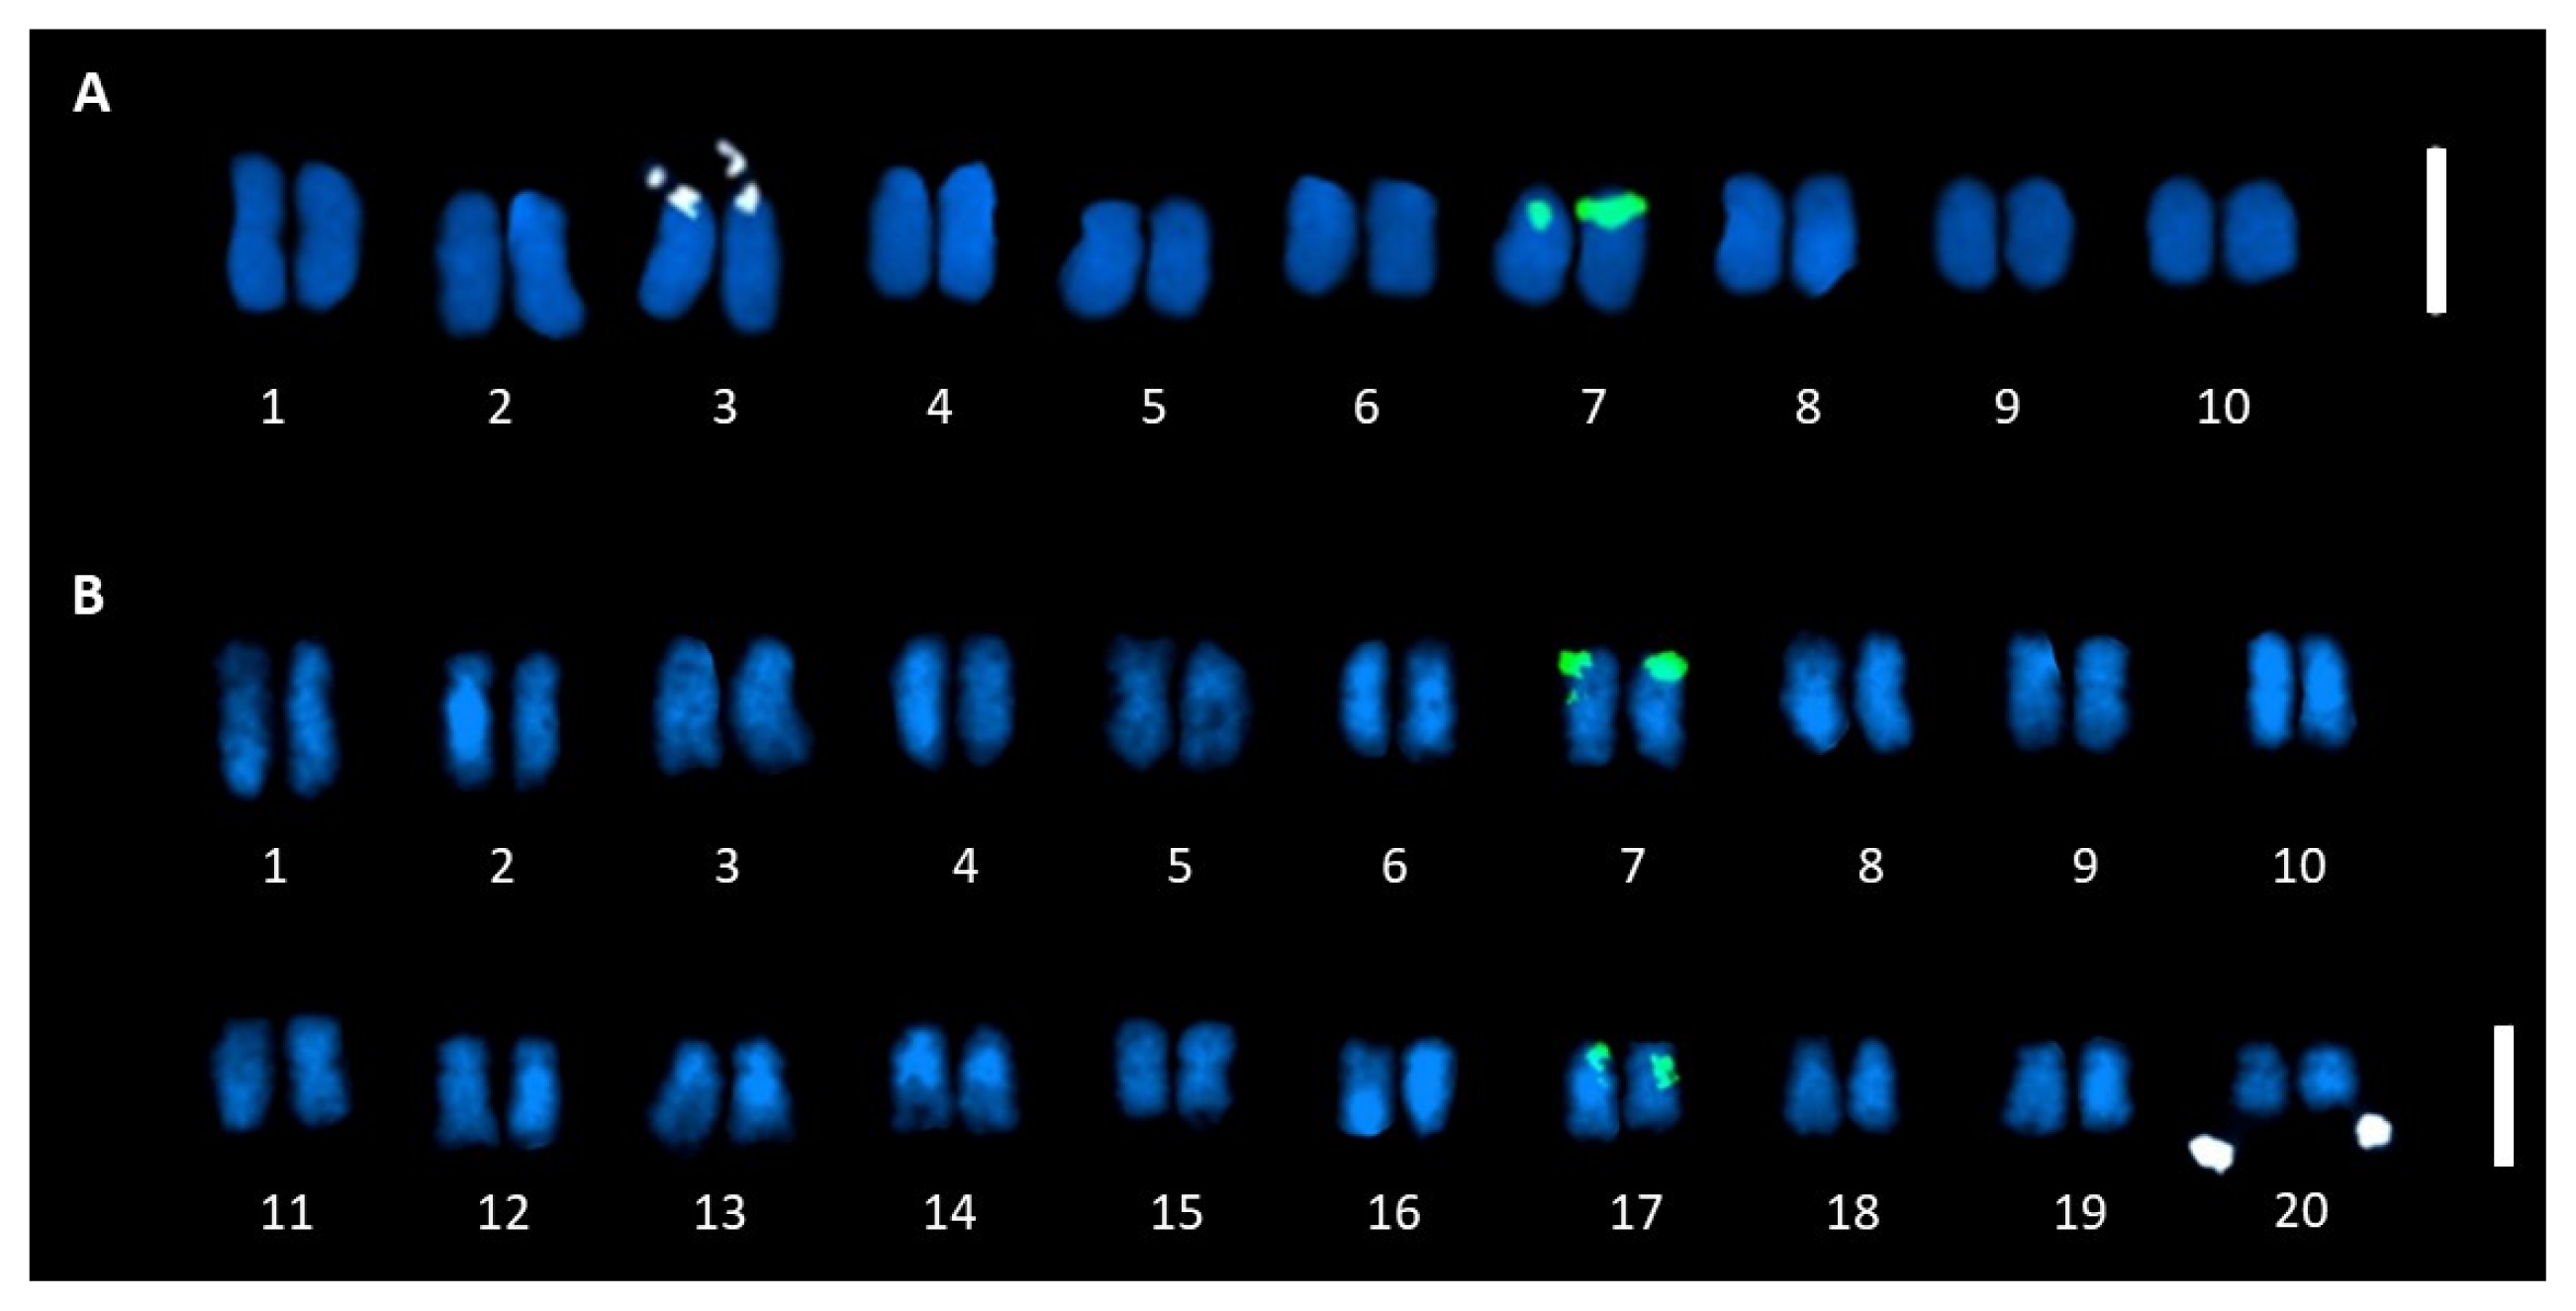
FISH karyotype
The FISH metaphase spreads and the karyograms of the diploid
P. citriodora and the allotetraploid
P. frutescens are shown in
Fig. 1 and
Fig. 2, respectively. Chromosome complements of the two species consisted of 2n = 20 in
P. citriodora and 2n = 40 in
P. frutescens, and a pair of satellite chromosome was observed in both species (
Figs. 1 and
2A, B). Karyotypic data analysis according to chromosome length, type, and FISH signals is shown in
Tables 1 and
2. The total chromosome length of
P. citriodora ranged from 3.07 to 4.92 μm, in which the short arm ranged from 1.03 to 2.43 μm and the long arm from 1.69 to 3.46 μm (
Table 1). For
P. frutescens, the total chromosomal length ranged from 2.41 to 5.73 μm, in which the short arm ranged from 0.73 to 2.16 μm, and the long arm from 1.68 to 4.24 μm (
Table 2).
In terms of chromosomal type,
P. citriodora exhibited 12 metacentric and eight submetacentric chromosomes with a pair of satellites in the 3
rd pair of chromosomes (
Table 1). The karyotype formula is 2n = 12m + 8sm (2 satellites).
P. frutescens revealed 20 metacentrics and 20 submetacentric chromosomes with a pair of satellites in chromosome 20 (
Table 2). The karyotype formula is 2n = 20m + 20sm (2 satellites). The chromosome complement of
P. frutescens somehow resembles its possible parent
P. citriodora.
The dual-color FISH analysis showed that the
P. citriodora genome contained single pair of 5S and 45S rDNA signals (
Fig. 1A) while
P. frutescens has two pairs of 5S rDNA and one pair of 45S rDNA signals (
Fig. 1B). The 5S rDNA was localized at the telomeric region of chromosome 7 in
P. citriodora (
Fig. 2A) whereas in
P. frutescens, it was detected in the interstitial region extending through the telomeric region of chromosomes 7 and 17 (
Fig. 2B). The 45S rDNA signals were located interstitially and extended to the satellite region of chromosome pair 3 for
P. citriodora (
Fig. 2A), unlike
P. frutescens where the signals were located entirely at the satellite region of chromosome 20 (
Fig. 2B). Probe signal size varied between the two species, however, they both showed a strong signal intensity for the 5S and 45S rDNAs probe (
Fig. 1). The chromosome complement of the cultivated species resembles the complement analysis of the diploid species.
DISCUSSION
The advancement in molecular cytogenetic techniques and FISH in particular, provides excellent information on chromosomal structures and functions (
Heslop-Harrison 2000). The technique uses repetitive DNAs as primary probes to clarify genomic structures at the chromosome level. Unique repeat probes can be used as cytogenetic markers for chromosome identification (
Hwang et al. 2009;
Waminal et al. 2018) and their distribution in the genome can be useful to trace phylogenetic relationships among species and in the plant breeding program (
Sybenga 2012).
The ploidy results demonstrated that
P. citriodora is diploid with 2n = 20, whereas
P. frutescens is tetraploid with 2n = 40, which is in accordance to the previous reports by
Honda et al. (1994),
Ito and Honda (2007), and
Diao et al. (2009). Both species exhibited single pair of satellite chromosomes (
Diao et al. 2009). Among
Perilla species, the wild
P. citriodora with one pair of 5S rDNA was considered the most closely related and possible parent to the cultivated
P. frutescens with two pairs of 5S rDNA. This conclusion is based on the phylogenetic relationship (
Nitta et al. 2005), the genetic diversity (
Woo et al. 2016) and the nucleotide sequences of geraniol synthases (
Ito and Honda 2007) of both species. The phylogenetic pattern and genetic diversity among
Perilla species are highly diverse and based on their endemic widespread and continental distribution, particularly in China, Japan, Korea, Vietnam, Taiwan, and other nearby Asian countries (
Nitta et al. 2005). Thus, the variation and distribution, especially in the 5S and 45S rDNA gene of both species, could be a result from unequal chromosomal crossover through genetic recombination during the gradual distribution and agricultural breeding across the country (
Diao et al. 2009). The karyotypic formula for
P. citriodora was 2n = 20 = 12m + 8sm (2 satellites) and 2n = 40 = 20m + 20sm (2 satellites) for
P. frutescens. The chromosome numbers of both species is also consistent with the study of
Zhang et al. (2008).
In this study, the NOR-forming 45S rDNA and non-NOR-forming 5S rDNA were used as FISH probes (
Singh et al. 2009) as these are highly repetitive DNA sequences with a distinct species-specific chromosomal distribution. In addition, 45S rDNA and 5S rDNA can be found interspersed with other multicopy genes in lower eukaryotes. However, these genes have often been shown to be located in separate areas of the genome in higher eukaryotes (
Martins and Galetti 1999), which is important to identify distinctly labeled probes in the chromosomes. The probes are widely used for plant taxonomic and evolutionary studies (
Volkov et al. 2017), since 5S and 45S rDNAs are usually not linked to the same chromosome, and conversion and crossing-over are be more probable (
Martins and Galetti 1999) The genomic rearrangements resulting from conversion or crossing-over are also common mechanisms in the evolution of multiple tandem arrays (
Dover 1989). There is a varying number of 5S and 45S rDNA loci, sizes, and patterns of distribution within the related species. The higher number of signals of 5S rDNA in the tetraploid species compared to the 45S rDNA signals are in contrast to many other plant species. In some rice species (
Ohmido et al. 2010),
Cucurbita (
Han et al. 2008),
Passiflora (
De Melo and Guerra 2003), and
Brassica rapa (
Lim et al. 2005), the transpositions and dispersions of 45S rDNA were higher compared to 5S rDNA in the genome. The specific features that may contribute to the intensive changes in multiple tandem repeats make these rDNA sequences cytologically essential in identifying species (
Eickbush and Eickbush 2007).
Furthermore, simple sequence repeat (SSR) analysis concluded that the original cultivation of the tetraploid species started in China (
Sa et al. 2015) and thrived in Korea, followed by Japan and other Asian countries (
Nitta et al. 2005). Thus, the phylogenetic relationship possibly resulted from a transfer of desirable traits from both parents during hybridization and introgression of the species (
Soltis and Soltis 2009).
In conclusion, FISH karyotypes of the diploid wild species
P. citriodora and the tetraploid cultivated species
P. frutescens were established, and the results will be useful for identifying the species and elucidating inter-specific relationship in
Perilla. In addition, the study provides essential information for breeding (
Sybenga 2012) and a chromosome backbone for the ongoing genomic sequencing research. FISH karyotype analysis using other major repeat probes is needed to refine the genomic organization in
Perilla.
ACKNOWLEDGEMENTS
This work was supported by the National Agricultural Genome Program (PJ013355012019) of Rural Development Administration, Republic of Korea.
Fig. 1Dual-color FISH metaphases of Perilla citriodora (A) and P. frutescens (B) showing the 5S (green) and 45S (white) rDNA signals. Bar = 5 μm.
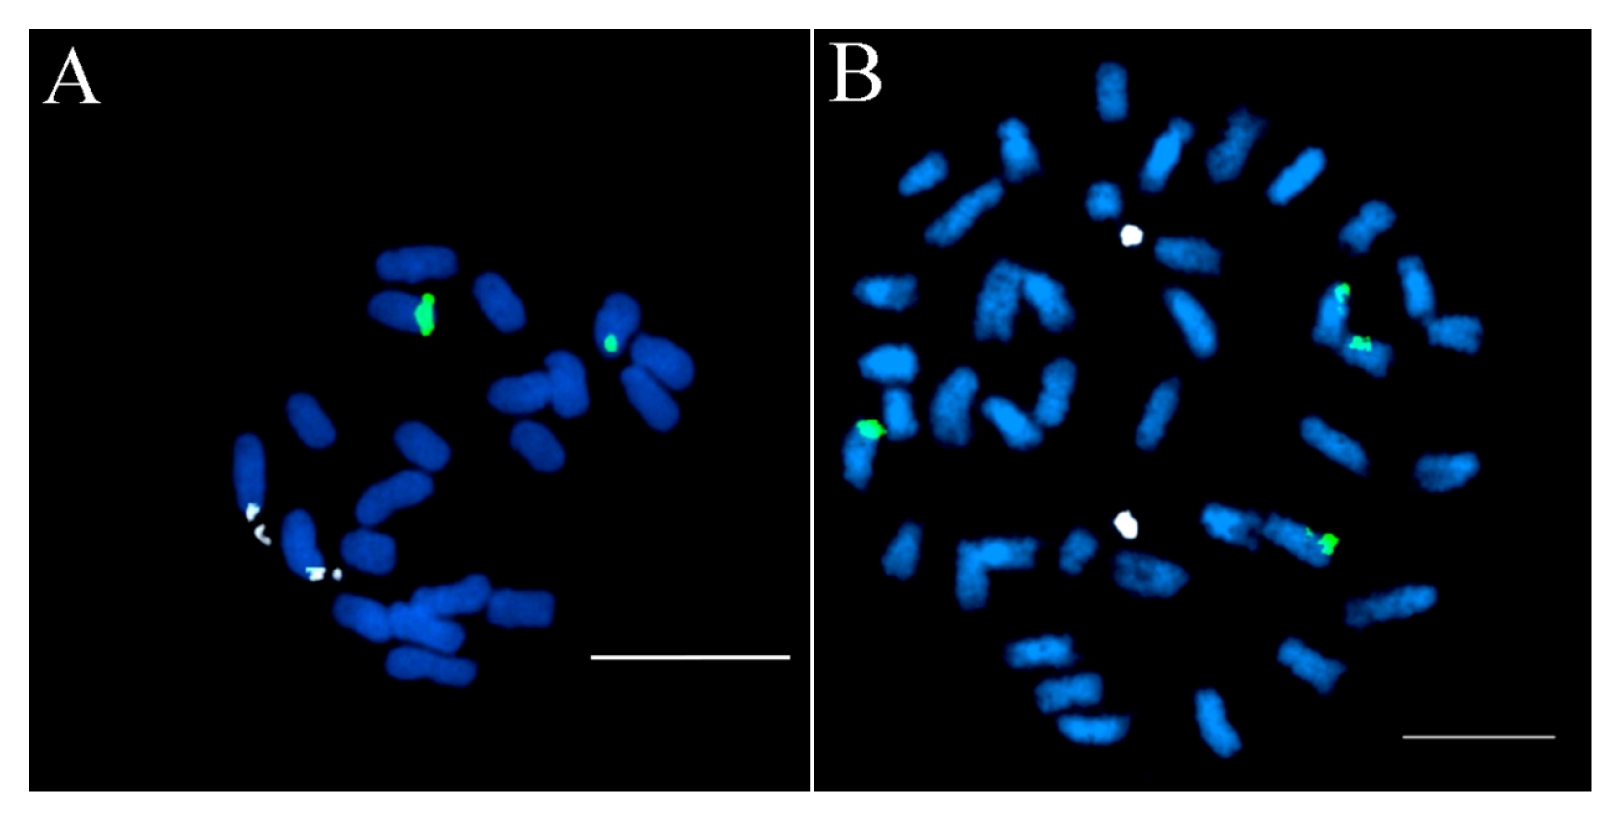
Fig. 2FISH karyotypic idiogram of diploid Perilla citriodora (A) and allotetraploid P. frutescens (B) showing 20 homologous pairs arranged in decreasing lengths. Bar = 5 μm.

Table 1FISH karyotype data of Perilla citriodora showing its per chromosome length, arm ratio, type, and rDNAs signals.
Table 1
|
Chr. pair no. |
Chromosome length (μm) |
Arm ratio (L/S) |
Chromosome type |
FISH signal |
|
|
|
Short arm (S) |
Long arm (L) |
Total (S + L) |
5S |
45S |
|
1 |
2.42–2.43 |
2.48–2.49 |
4.91–4.92 |
1.02–1.03 |
m††
|
− |
− |
|
2 |
1.31–1.41 |
3.24–3.46 |
4.55–4.87 |
2.45–2.47 |
sm††
|
− |
− |
|
3 |
1.31–1.37 |
3.05–3.06 |
4.36–4.43 |
2.24–2.33 |
sm*
|
− |
two chromosomes |
|
4 |
1.73–1.84 |
2.36–2.42 |
4.15–4.20 |
1.29–1.40 |
m |
− |
− |
|
5 |
1.03–1.06 |
3.02–3.03 |
4.06–4.08 |
2.85–2.95 |
sm |
− |
− |
|
6 |
1.62–1.64 |
1.94–1.97 |
3.58–3.59 |
1.19–1.21 |
m |
− |
− |
|
7 |
1.03–1.04 |
2.43–2.47 |
3.46–3.49 |
1.45–2.40 |
sm |
two chromosomes |
− |
|
8 |
1.35–1.38 |
2.01–2.06 |
3.40–3.41 |
1.45–1.53 |
m |
− |
− |
|
9 |
1.38–1.46 |
1.87–1.91 |
3.29–3.32 |
2.28–1.38 |
m |
− |
− |
|
10 |
1.38–1.42 |
1.69–1.71 |
3.07–3.13 |
1.21–1.22 |
m |
− |
− |
|
|
|
|
total |
12m + 8sm |
two chromosomes |
two chromosomes |
Table 2FISH karyotype data of Perilla frutescens showing its per chromosome length, arm ratio, type, and rDNAs signals.
Table 2
|
Chr. group no. |
Chromosome Length (μm) |
Arm ratio (L/S) |
Chromosome type |
FISH signal |
|
|
|
Short arm (S) |
Long arm (L) |
Total (S + L) |
5S |
45S |
|
1 |
1.39–1.48 |
4.03–4.24 |
5.42–5.73 |
2.86–2.28 |
sm†
|
− |
− |
|
2 |
1.28–1.48 |
3.36–3.81 |
4.96–5.09 |
2.11–2.97 |
sm |
− |
− |
|
3 |
2.09–2.10 |
2.81–2.87 |
4.90–4.95 |
1.34–1.37 |
m††
|
− |
− |
|
4 |
2.09–2.12 |
2.82–2.87 |
4.94–4.95 |
1.33–1.34 |
m |
− |
− |
|
5 |
1.92–2.11 |
2.73–2.85 |
4.77–4.83 |
1.29–1.48 |
m |
− |
− |
|
6 |
2.13–2.16 |
2.33–2.36 |
4.49–4.50 |
1.08–1.11 |
m |
− |
− |
|
7 |
1.37–1.55 |
2.94–2.98 |
4.36–4.48 |
1.90–2.18 |
sm |
two chromosomes |
− |
|
8 |
1.99–2.11 |
2.26–2.42 |
4.37–4.41 |
1.07–1.22 |
m |
− |
− |
|
9 |
2.01–2.02 |
2.35–2.38 |
4.35–4.39 |
1.17–1.19 |
m |
− |
− |
|
10 |
1.86–1.96 |
2.31–2.32 |
4.17–4.27 |
1.18–1.25 |
m |
− |
− |
|
11 |
1.80–1.98 |
2.16–2.35 |
4.14–4.15 |
1.09–1.31 |
m |
− |
− |
|
12 |
1.08–1.33 |
2.75–3.02 |
3.99–4.10 |
2.06–2.78 |
sm |
− |
− |
|
13 |
1.17–1.21 |
2.79–2.82 |
3.99–4.00 |
2.30–2.41 |
sm |
− |
− |
|
14 |
1.42–1.64 |
2.23–2.40 |
3.82–3.87 |
1.36–1.68 |
m |
− |
− |
|
15 |
1.70–1.81 |
2.00–2.09 |
3.79–3.81 |
1.10–1.23 |
m |
− |
− |
|
16 |
1.00–1.18 |
2.49–2.58 |
3.58–3.68 |
2.11–2.57 |
sm |
− |
− |
|
17 |
0.89–0.90 |
2.58–2.66 |
3.56–3.58 |
2.95–2.96 |
sm |
two chromosomes |
− |
|
18 |
1.02–1.08 |
2.38–2.44 |
3.44–3.46 |
2.21–2.39 |
sm |
− |
− |
|
19 |
0.98–1.03 |
2.40–2.46 |
3.43–3.44 |
2.32–2.50 |
sm |
− |
− |
|
20 |
0.73–1.00 |
1.68–1.90 |
2.41–2.91 |
1.89–2.31 |
sm*
|
− |
two chromosomes |
|
|
|
|
total |
20m + 20sm |
four chromosomes |
two chromosomes |
References
- Bergeron J, Drouin G. 2008. The evolution of 5S ribosomal RNA genes linked to the rDNA units of fungal species. Curr Genet. 54: 123-131.
- Brenner DM. 1993. Perilla, botany, uses and genetic resources. J Janick and JE. 677.
- De Melo NF, Guerra M. 2003. Variability of the 5S and 45S rDNA sites in Passiflora L species with distinct base chromosome numbers. Ann Bot. 92: 309-316.
- Diao Y, Miao Y, Lin X, Liao C, Guo F, Hu Z. 2009. Comparative analysis of five varieties in Perilla frutescens (L) Britton by 45S rDNA FISH and 5S rDNA sequences. Russ J Genet. 45: 440-444.
- Dover G. 1989. Linkage disequilibrium and molecular drive in the rDNA gene family. Genetics. 122: 249
- Eickbush TH, Eickbush DG. 2007. Finely orchestrated movements: evolution of the ribosomal RNA genes. Genetics. 175: 477-485.
- Galián JA, Rosato M, Rosselló J. 2012. Early evolutionary colocalization of the nuclear ribosomal 5S and 45S gene families in seed plants: evidence from the living fossil gymnosperm Ginkgo biloba. Heredity. 108: 640
- Gerlach W, Bedbrook J. 1979. Cloning and characterization of ribosomal RNA genes from wheat and barley. Nucleic Acids Res. 7: 1869-1885.
- Han Y, Zhang Z, Liu J, Lu J, Huang S, Jin W. 2008. Distribution of the tandem repeat sequences and karyo-typing in cucumber (Cucumis sativus L.) by fluorescence in situ hybridization. Cytogenet Genome Res. 122: 80-88.
- Heslop-Harrison J. 2000. Comparative genome organization in plants: from sequence and markers to chromatin and chromosomes. Plant Cell. 12: 617-635.
- Honda G, Yuba A, Kojima T, Tabata M. 1994. Chemo-taxonomic and cytogenetic studies on Perilla frutescens var. citriodora (“Lemon Egoma”). Natural Medicines. 48: 185-190.
- Hwang YJ, Kim HH, Kwon SJ, Yang TJ, Ko HC, Park BS, et al. 2009. Karyotype analysis of three Brassica species using five different repetitive DNA markers by Fluorescence in situ Hybridization. Korean J Hortic Sci Technol. 27: 456-463.
- Ito M, Honda G. 2007. Geraniol synthases from Perilla and their taxonomical significance. Phytochemistry. 68: 446-453.
- Ito M, Kiuchi F, Yang LL, Honda G. 2000. Perilla citriodora from Taiwan and its phytochemical characteristics. Biol Pharm Bull. 23: 359-362.
- Kato A, Vega JM, Han F, Lamb JC, Birchler JA. 2005. Advances in plant chromosome identification and cytogenetic techniques. Curr Opin Plant Biol. 8: 148-154.
- Koo DH, Hur Y, Jin DC, Bang JW. 2002. Karyotype analysis of a Korean cucumber cultivar (Cucumis sativus L. cv. Winter Long) using C-banding and bicolor fluorescence in situ hybridization. Mol Cells. 13: 413-418.
- Lapitanz NL. 1992. Organization and evolution of higher plant nuclear genomes. Genome. 35: 171-181.
- Larcher W. 2003. Physiological plant ecology: ecophysiology and stress physiology of functional groups. Springer Science & Business Media.
- Lee JK, Ohnishi O. 2001. Geographic differentiation of morphological characters among Perilla crops and their weedy types in East Asia. Breed Sci. 51: 247-255.
- Levan A, Fredga K, Sandberg AA. 1964. Nomenclature for centromeric position on chromosomes. Hereditas. 52: 201-220.
- Lim KB, De Jong H, Yang TJ, Park JY, Kwon SJ, Kim JS, et al. 2005. Characterization of rDNAs and tandem repeats in the heterochromatin of Brassica rapa. Mol Cells. 19: 436-444.
- Mantovani M, Abel S, Moreira-Filho O. 2005. Conserved 5S and variable 45S rDNA chromosomal localisation revealed by FISH in Astyanax scabripinnis (Pisces, Characidae). Genetica. 123: 211-216.
- Martins C, Galetti PM. 1999. Chromosomal localization of 5S rDNA genes in Leporinus fish (Anostomidae, Characiformes). Chromosome Res. 7: 363-367.
- Mo JS, Kim K, Lee MH, Lee JH, Yoon UH, Kim TH. 2017. The complete chloroplast genome sequence of Perilla citriodora (Makino) Nakai. Mitochondrial DNA A DNA Mapp Seq Anal. 28: 131-132.
- Nitta M, Lee JK, Kang CW, Katsuta M, Yasumoto S, Liu D, et al. 2005. The distribution of Perilla species. Genet Resour Crop Evol. 52: 797-804.
- Ohmido N, Fukui K, Kinoshita T. 2010. Recent advances in rice genome and chromosome structure research by fluorescence in situ hybridization (FISH). Proc Jpn Acad, Ser B, Phys Biol Sci. 86: 103-116.
- Pellerin RJ, Waminal NE, Kim HH. 2018. Triple-color FISH karyotype analysis of four Korean wild Cucurbitaceae species. Hortic Sci Technol. 36: 98-107.
- Sa KJ, Choi SH, Ueno M, Lee JK. 2015. Genetic diversity and population structure in cultivated and weedy types of Perilla in East Asia and other countries as revealed by SSR markers. Hortic Environ Biote. 56: 524-534.
- Seo WH, Baek HH. 2009. Characteristic aroma-active compounds of Korean Perilla (Perilla frutescens Britton) leaf. J Agric Food Chem. 57: 11537-11542.
- Singh M, Kumar R, Nagpure N, Kushwaha B, Mani I, Chauhan U, et al. 2009. Population distribution of 45S and 5S rDNA in golden mahseer, Tor putitora: population- specific FISH marker. J Genet. 88: 315-320.
- Soltis PS, Soltis DE. 2009. The role of hybridization in plant speciation. Annu Rev Plant Bio. 60: 561-588.
- Sybenga J. 2012. Cytogenetics in plant breeding. 17: Springer Science & Business Media.
- Vaughan J, Geissler C. 2009. The new Oxford book of food plants. OUP Oxford.
- Volkov RA, Panchuk II, Borisjuk NV, Hosiawa-Baranska M, Maluszynska J, Hemleben V. 2017. Evolutional dynamics of 45S and 5S ribosomal DNA in ancient allohexaploid Atropa belladonna. BMC Plant Biol. 17: 21
- Vrána J, Šimková H, Kubaláková M, Číhalíková J, Doležel J. 2012. Flow cytometric chromosome sorting in plants: the next generation. Methods. 57: 331-337.
- Waminal NE, Pellerin RJ, Jang W, Kim HH, Yang TJ. 2018. Characterization of chromosome-specific microsatellite repeats and telomere repeats based on low coverage whole genome sequence reads in Panax ginseng. Plant Breed Biotech. 6: 74-81.
- Wicke S, Costa A, Muñoz J, Quandt D. 2011. Restless 5S: the re-arrangement (s) and evolution of the nuclear ribosomal DNA in land plants. Mol Phylogenet Evol. 61: 321-332.
- Woo SY, Sa KJ, Lee JK. 2016. Collection and evaluation of genetic variation of Perilla accessions in the Jeju Island. Plant Breed Biotech. 4: 87-98.
- Yamamoto H, Ogawa T. 2002. Antimicrobial activity of Perilla seed polyphenols against oral pathogenic bacteria. Biosci Biotechnol Biochem. 66: 921-924.
- Zhang X, Wu W, Zheng Yl, Yuan Zh. 2008. Chromosome numbers and karyotypes analysis of genus Perilla L. Acta Bot Boreali-Occidentalia Sin. 10.
- Zhou HC, Park EJ, Kim HH. 2018. Analysis of chromosome composition of Gastrodia elata Blume by fluorescent in situ hybridization using rDNA and telomeric repeat probes. Korean J Med Crop Sci. 26: 113-118.