Abstract
Since traditional taxonomic studies possess intrinsic limitations with plant species identification, combinations of DNA barcodes have been considered a powerful tool to discover undetected genetic variation within species across large geographic areas, providing more precise estimates of biodiversity. However, the lack of efficient and universal markers is often considered a peculiar challenge in molecular taxonomic studies across plant taxa. Similarly, many loci have been proposed for DNA barcodes; still standardizing regions as a DNA barcode is vital for making them efficiently discriminate plant species. In this study, we tested the phylogenetic utility of nuclear (nrDNA) region (ITS2) with chloroplast (cpDNA) regions (matK, psbA-trnH, and rbcL) for efficient discrimination of Triticum species. A total of 109 accessions representing 16 recognized genotypes in the Triticum genus have been sampled to assess the efficiency of barcoding loci to resolve species discrimination. As expected from earlier studies, our results also revealed that a single locus has difficulty in discriminating Triticum species. Species discrimination in Triticum taxa was martially improved by using a combination of gene loci; however, the closely related species, T. aestivum and T. turgidum, had no DNA barcode to separate them. Thus, we recommend further research on finding species-specific SNP using intragenic regions as standard DNA barcode loci in Poaceae.
-
Key words: DNA barcoding, Phylogenetic analysis, Species discrimination, Triticum, Wheat
INTRODUCTION
The grass family (Poaceae), which includes approximately 11,000 recognized species and about 600–700 genera (
Clayton and Renvoize 1986;
Peat 2009). Among the crop plants, grasses are considered the most important species as they play a significant role in poverty alleviation, environmental protection and sustainable development (
Ureta et al. 2012). It includes all major cereals, such as wheat, maize, rice, barley, etc., minor grains, such as rye, common millet, finger millet, etc., and many other weeds that are less familiar. The cultivated cereals have rich carbohydrates and offer a major source of daily calorie intake for humans and animals (
Ureta et al. 2012). Many grasses are used as fodder and in specific industrial production as well. The economic and ecological significances of the grasses make widespread interest in their evolution and classification studies (
Watson 1992).
Triticum is an annual grass in the Poaceae (grass family) native to the Mediterranean region and southwest Asia, which includes the wild and domesticated species, usually thought of as wheat. It is one of the most ancient among domesticated crops, with archaeological evidence of the cultivation of various species in the Fertile Crescent dating back to 9600 B.C. The various species have been developed into thousands of cultivars that differ in chromosome number from diploid types to hybrid allopolyploids. Cultivars are variously categorized according to their growth such as spring and winter wheat or by seed characteristics in which six major categories are recognized. Understanding the Triticum genus is vital for understanding the crops that comprises more physiological, morphological, and genetic variation in the major cereal crops. Despite the enormous economic and ecological importance of wheat in the global context within the Poaceae, the evolutionary history of Tritium is only partially understood.
The rapid increase in the molecular phylogenetic studies based on chloroplast and nuclear genomes (
Middleton et al. 2014;
Ganopoulos et al. 2017) provides more information, as well as some interesting insight for wheat phylogeny. However, not all studies are congruent regarding the relationships between the species and lack resolution, particularly within closely related species. So far, the molecular resolution of wheat conflicts with the traditional morphological concept. Thus, a robust and reliable method is crucial to discriminate plant species to secure their diversity. Various markers, such as isozymes (
Moghaddam et al. 2000), RAPD (
Thomas and Bebeli 2010), SSR and ISSR (
Moradkhani et al. 2013;
Moradkhani et al. 2016), CDDP (
Guo et al. 2016), DArT (
Edet et al. 2018), SCoT (
Pour-Aboughadareh et al. 2018) and cpDNA and nrDNA sequences (
Petersen et al. 2006) have been applied to study the genetic relationships between
Aegilops and
Triticum species. Recently, DNA barcoding has become a hotspot of biodiversity research (
Gregory 2005). DNA barcoding provides a rapid solution to distinguish morphologically similar species as this method is highly reproducible in most plant species.
Previously many investigations have been performed for finding suitable DNA barcodes in the family Poaceae.
Culumber (2007) investigated the efficiency of two chloroplast regions (
tmH-psbA and
trnK-rpsl6) along with the ITS region in the
Leymus genus.
Lopez-Alvarez et al. (2012) have proposed the combination of
trnLF and ITS region to differentiate the close relatives of the
Brachypodium species. Similarly, various combinations of DNA barcodes were proposed to discriminate the
Aegilops and
Triticum species (
Dizkirici et al. 2013;
Awad et al. 2017). However, the efficiency of DNA barcodes is always evaluated based on the barcoding gap (threshold based approach) analysis (
Čandek and Kuntner 2015). Additionally, by analyzing a large number of samples, consensus barcodes can be provided which could be unique to each taxon (
Meier et al. 2006). The plant barcoding committee always recommends to use barcode combinations to achieve maximum species identification (
Li et al. 2011). Thus, our study was designed with combination markers to construct the standard DNA barcode database for the identification of
Triticum species. Our data could be helpful for the examination of
Triticum species that are very difficult to distinguish from one another during germplasm revival in GenBank.
MATERIALS AND METHODS
Plant material
For this study, we collected a total of 109 accessions representing 16
Triticum species from the National Agrobiodiversity Center at the National Institute of Agricultural Sciences, Rural Development Administration, Republic of Korea (
Supplementary Table S1). Appropriate taxon sampling is thought to be the most important for accurate phylogenic inferences; where possible, each species was represented by two or more different samples.
Fresh leaf tissue was harvested from 3-week-old germinated seedling, ground well in liquid nitrogen, and total DNA was extracted using the DNeasy
® Plant Mini kit (Qiagen, Valencia, CA, USA) according to the manufacturer’s instructions. Finally, the extracted DNA was resuspended in 100 μL water, and dilutions were made to 10 ng/μL followed by storage at either −20°C or −80°C. Genomic DNA was quantified using a Nanodrop/UVS-99 instrument (ACTGene, Piscataway, NJ, USA), and the A260/A280 nm ratio was determined. DNA quality was confirmed on a 0.8% agarose gel. Sequences of the universal primers for four barcoding regions (ITS2,
matK,
psbA-trnH, and
rbcL) and thermocycling reaction conditions were obtained from
Chen et al. (2010).
DNA barcode sequence (
Table 1) amplifications were carried out in 20 μL reaction volumes which contained 1× PCR buffer, 0.1 mM primers, 0.2 mM each dNTP, 1 U Taq DNA polymerase and 100 ng of template DNA. PCR products were loaded on 1% agarose gels containing Dyne LoadingSTAR (Dynebio, Seongnam, South Korea) and visualized using the MyGelDoc (Labgenomics, Seongnam, South Korea). The PCR products were purified using a PCR purification kit (Solgent), and purified samples were sent to LabGenomics (
http://www.Lab.genomics.com/kor/) for sequencing.
Sequences of all four barcode regions were manually edited with MEGA6 (
Tamura et al. 2013) and aligned using the ClustalW option implemented in the MEGA6 program. All intra- and inter-specific pairwise genetic distances were calculated based on the Kimura-2-Parameter (K2P) model (
Kimura 1980) using Species Identifier 1.8 (
Meier et al. 2006). The barcoding gap present in the dataset was visualized by the difference between the maximum intraspecific genetic distances and the minimum interspecific genetic distances. All positions containing gaps in the barcode sequences were eliminated and a neighbor-joining (NJ) tree was constructed based on the K2P distance values obtained under 1000 bootstrap value (
Felsenstein 1985) using MEGA6 for the phylogenetic comparison among sequences.
RESULTS
Barcode sequence characteristics
To make the reference barcode database for all 16 known species and subspecies of
Triticum, we performed PCR amplification of the four barcoding loci, in which all nucleotide fragments were successfully sequenced from 109 individual samples (
Supplementary Table S1).
Table 2 summarized the sequence characteristics of the four barcoding regions assessed in this study. Regarding primer success rate in barcode sequence amplifications, the proportion was 100% for both the cpDNA and nrDNA regions (data not shown). The ClustalW aligned sequence length of ITS2 was 431 bp, 708 bp for
matK, 568 bp for
psbA-trnH, and 595 bp for
rbcL (
Table 2). All positions containing gaps and missing data were eliminated which resulted in a concatenated sequence length of 2,302 bp with all four regions. The multiple sequence alignment analysis revealed a total of 340 variable sites (S) with mean nucleotide diversity (π) of 0.03 among the four loci, in which
psbA-trnH showed highest pi values (0.10).
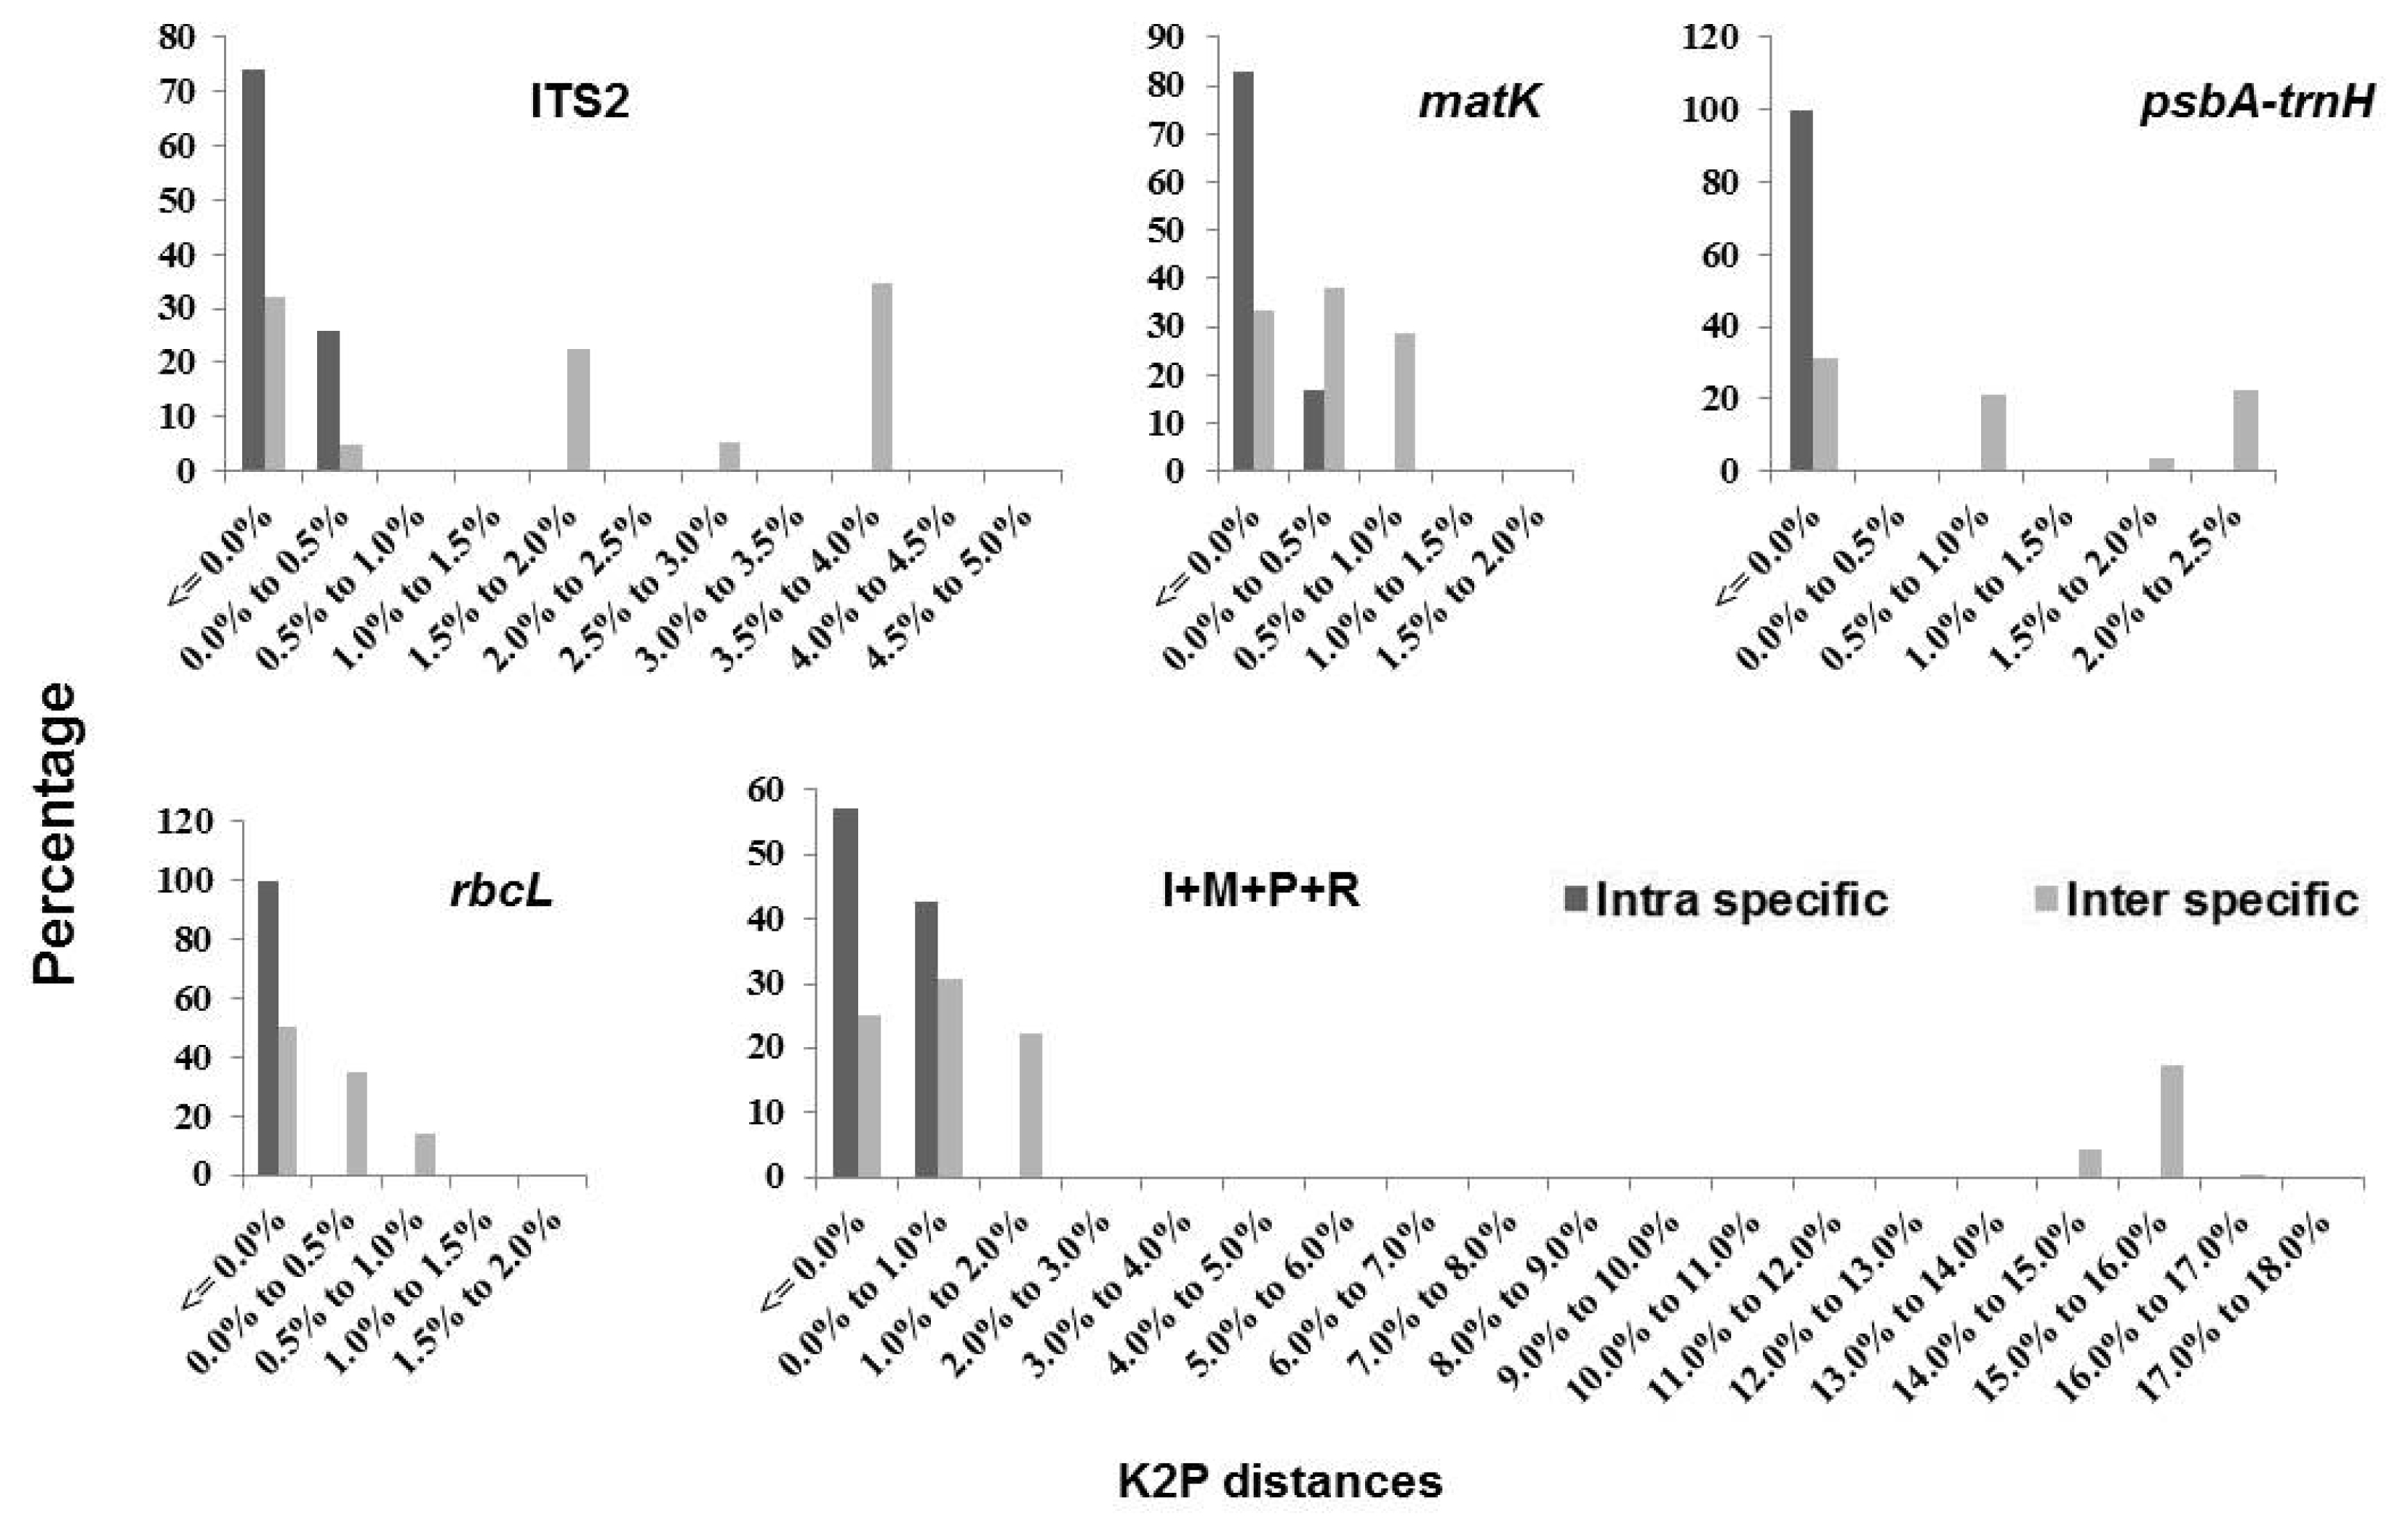
The relative distribution of K2P distances based on single barcodes and combinations ITS2 +
matK +
rbcL and ITS2 +
matK +
psbA-trnH +
rbcL demonstrated significant overlap and no barcoding gap (
Fig. 1). Among the single barcodes,
psbA-trnH had the highest variation in interspecific divergence, followed by ITS2, when compared to the range of intraspecific distances (
Fig. 1). Similarly, among the barcode combinations, ITS2 +
matK +
psbA-trnH +
rbcL showed the highest variation in interspecific divergence compared to the range of intraspecific distances (
Fig. 1).
The utility of loci and their sequences for barcoding alone and in multigene combinations is presented in
Table 2. Results indicate that only a very limited number of
Triticum species are diagnosable using individual plastid barcodes. Similarly, the multigene combination has also resolved a limited number of taxa (32%) and provided poor support in species discrimination (37%). The results of similarity tests performed in TAXONDNA software are shown in
Table 3. In the genus
Triticum, the same success rate of species identification (37%) was observed for the all four datasets based on both best match (BM) and best close match (BCM) TAXONDNA functions. Moreover, in the TAXONDNA functions, the
Triticum species identification failed and considered as ambiguous (62%) among all four datasets.
The barcode sequence evaluation based on phylogenetic trees was performed with un-rooted NJ analysis and K2P (
Kimura 1980) distances of the four loci according to the correct assignment of individuals (
Fig. 2,
Supplementary Figs. S1–S4). When considering the phylogenetic method,
psbA-trnH recovered the highest value of species monophyly (37% of species correctly identified), which was due to the identification of one extra subspecies with the NJ method. When comparing all four datasets within
Triticum species, similar discriminatory power was observed (37%) as all four loci failed to discriminate the
Triticum species. The phylogenetic analyses based on the four loci were generally discriminating the
Triticum species (
Fig. 2).
Only the species identification was considered successful if species or subspecies formed a distinct clade. In the present study, species and subspecies of
T. monococcum,
T. timopheevii,
T. urartu, and
T. turgidum subsp.
turgidum were identified successfully using the four DNA barcodes, in multigene combinations (
Fig. 2). In the NJ tree analyses, individual and multigene combinations failed to discriminate the
T. aestivum and
T. turgidum subspecies other than the
T. turgidum subsp.
turgidum in the genus
Triticum. However, the barcode sequence analysis provides a new tool to discriminate the large collection of
Triticum species in the GenBank accession as the
Triticum species are very difficult to distinguish from one another during germplasm revival.
DISCUSSION
The genus
Triticum is an allopolyploid complex which contains two diploids, two tetraploids and two hexaploids. Taxonomy of the genus has been considered problematic as the allopolyploid nature of the genus is more difficult to decipher based on nuclear genome sequences. Various studies have been reported for the investigation of paternal and maternal ancestors of polyploid wheat, based on the sequence analysis of many nuclear genes. The phylogenetic relationships among species were reported based on morphology (
Sarkar and Stebbins 1956), nrDNA sequences (
Dvorak and Zhang 1990), chromosome banding (
Gill and Kimber 1974) and molecular phylogeny (
Mori et al. 1997;
Pour-Aboughadareh et al. 2018). Moreover, chloroplast-based phylogenetic analysis of a large collection of
Aegilops/Triticum species revealed possible cytoplasmic exchanges between them (
Gornicki et al. 2014).
In DNA barcoding, the universality of primers is an important criterion for their success (
Hollingsworth et al. 2009). Four primer pairs that were tested (ITS2,
matK,
psbA-trnH, and
rbcL) resulted in 100% PCR amplification and sequencing success, which suggests the importance of primer selection in barcoding studies. According to our results, the tested barcoding regions were found to be easily amplified with PCR (
Table 1). A total of 436 sequences from 109 accessions, which belongs to 16
Triticum species were obtained. Sequence alignment analysis revealed considerable nucleotide diversity (π) between the loci, in which all pairwise comparisons showed the average genetic distance ranging from 0.001 to 0.108, as shown in
Table 2. In general, the chloroplast genome (
Saski et al. 2007;
Young et al. 2011) and the rDNA regions (
Erickson et al. 2008;
Heubl 2010) were reported as potential loci for barcoding due to the low sequence divergence; however, high-quality, full-length barcode sequences are needed for a robust phylogenetic analysis at and below the species level.
Numerous studies have reported that the sequence of the ITS region is variable enough to differentiate closely related species in Triticeae (
Hsiao et al. 1995;
Blattner 2004).
Zhang et al. (2002) studied the possible evolution of tetraploid wheats and reported a 2-bp indel in ITS1 region and 1-bp indel in ITS2 region. Moreover,
Cao (1997) reported a total of 13 variable sites in the ITS regions among the five groups of hexaploid wheat, which is in agreement with the present study that there were 19 variable sites in the ITS2 region. Phylogenetic relationships among
Triticum species based on the chloroplast genome sequences have also been reported (
Tsunewaki and Ogihara 1983;
Terachi et al. 1984;
Gornicki et al. 2014;
Awad et al. 2017). The maternal inheritance nature in the chloroplast genome simplifies sequence based phylogenetic analysis of polyploid wheat. However, a sizable sequence length requires for phylogenetic analysis as low nucleotide substitution rates were found in the chloroplast genomes compared to nuclear genomes (
Wolfe et al. 1987;
Khakhlova and Bock 2006).
The success of DNA barcoding lies in the distinct identification of the clusters in the phylogenetic analysis (
Steinke et al. 2009). In this study, phylogenetic relationships within
Triticum species were tested by using four barcode regions. Among the tested loci,
psbA-trnH resolved the greatest number of species as a single barcode (
Table 3). However, only marginal gains in taxon resolution (27% vs. 32%) were achieved with all four barcode combinations. Similarly, the conspecific samples formed monophyletic clusters, supported by a high bootstrap value, which proved the reliability of barcoding loci to identify
Triticum species. However, species discrimination with single as well as combination of barcodes could not be used to discriminate
T. aestivum and
T. turgidum species as shown in the NJ tree of
Fig. 2, which coincided with the previous study (
Gornicki et al. 2014).
DNA barcoding will not be useful in particular plant groups due to various factors including hybridization events in the polyploidy species (
Hollingsworth et al. 2011). Like many other genera in the Poaceae,
Triticum is an allopolyploid complex with four (A, B, D, and G) basic genomes (
Gill and Friebe 2002), which makes them one of the complex species for molecular studies in the last decades. Various barcodes were tested for resolving the phylogenetic relationships among closely related
Aegilops/Triticum species, but the studies were conducted with limited sample size (
Dizkirici et al. 2013;
Gornicki et al. 2014;
Ganopoulos et al. 2017). The present study was conducted with a large group of GenBank accessions, which includes 16 known species and subspecies in the genus
Triticum. However, the tested barcode failed to discriminate
T. aestivum and
T. turgidum species alone as the hexaploid wheat (
T. aestivum) was originated from the tetraploid wheat
T. turgidum. Phylogenetic analyses with a combination of nrDNA and cpDNA are one of the most effective methods to understand evolutionary relationships between and within diploid and/or polyploid
Triticum species. However, additional experiments with larger sample sizes could aid the study for the complex phylogenetic structures of the
Triticum genera.
Supplementary Information
ACKNOWLEDGEMENTS
This study was carried out with the support of the “Research Program for Agricultural Science & Technology Development (Project No. PJ012580)” and was supported by 2017 Postdoctoral Fellowship Program of National Academy of Agricultural Science, Rural Development Administration, Korea.
Fig. 1Relative distribution of K2P distances across all sequence pairs of Triticum datasets for different markers.

Fig. 2Phylogenetic analysis of Triticum species based on combinations of barcode loci. The NJ tree was developed using the Kimura 2-parameter method on nucleotide sequences of ITS2 + matK + psbA-trnH + rbcL region. Numbers next to the branches are the NJ bootstrap support values.
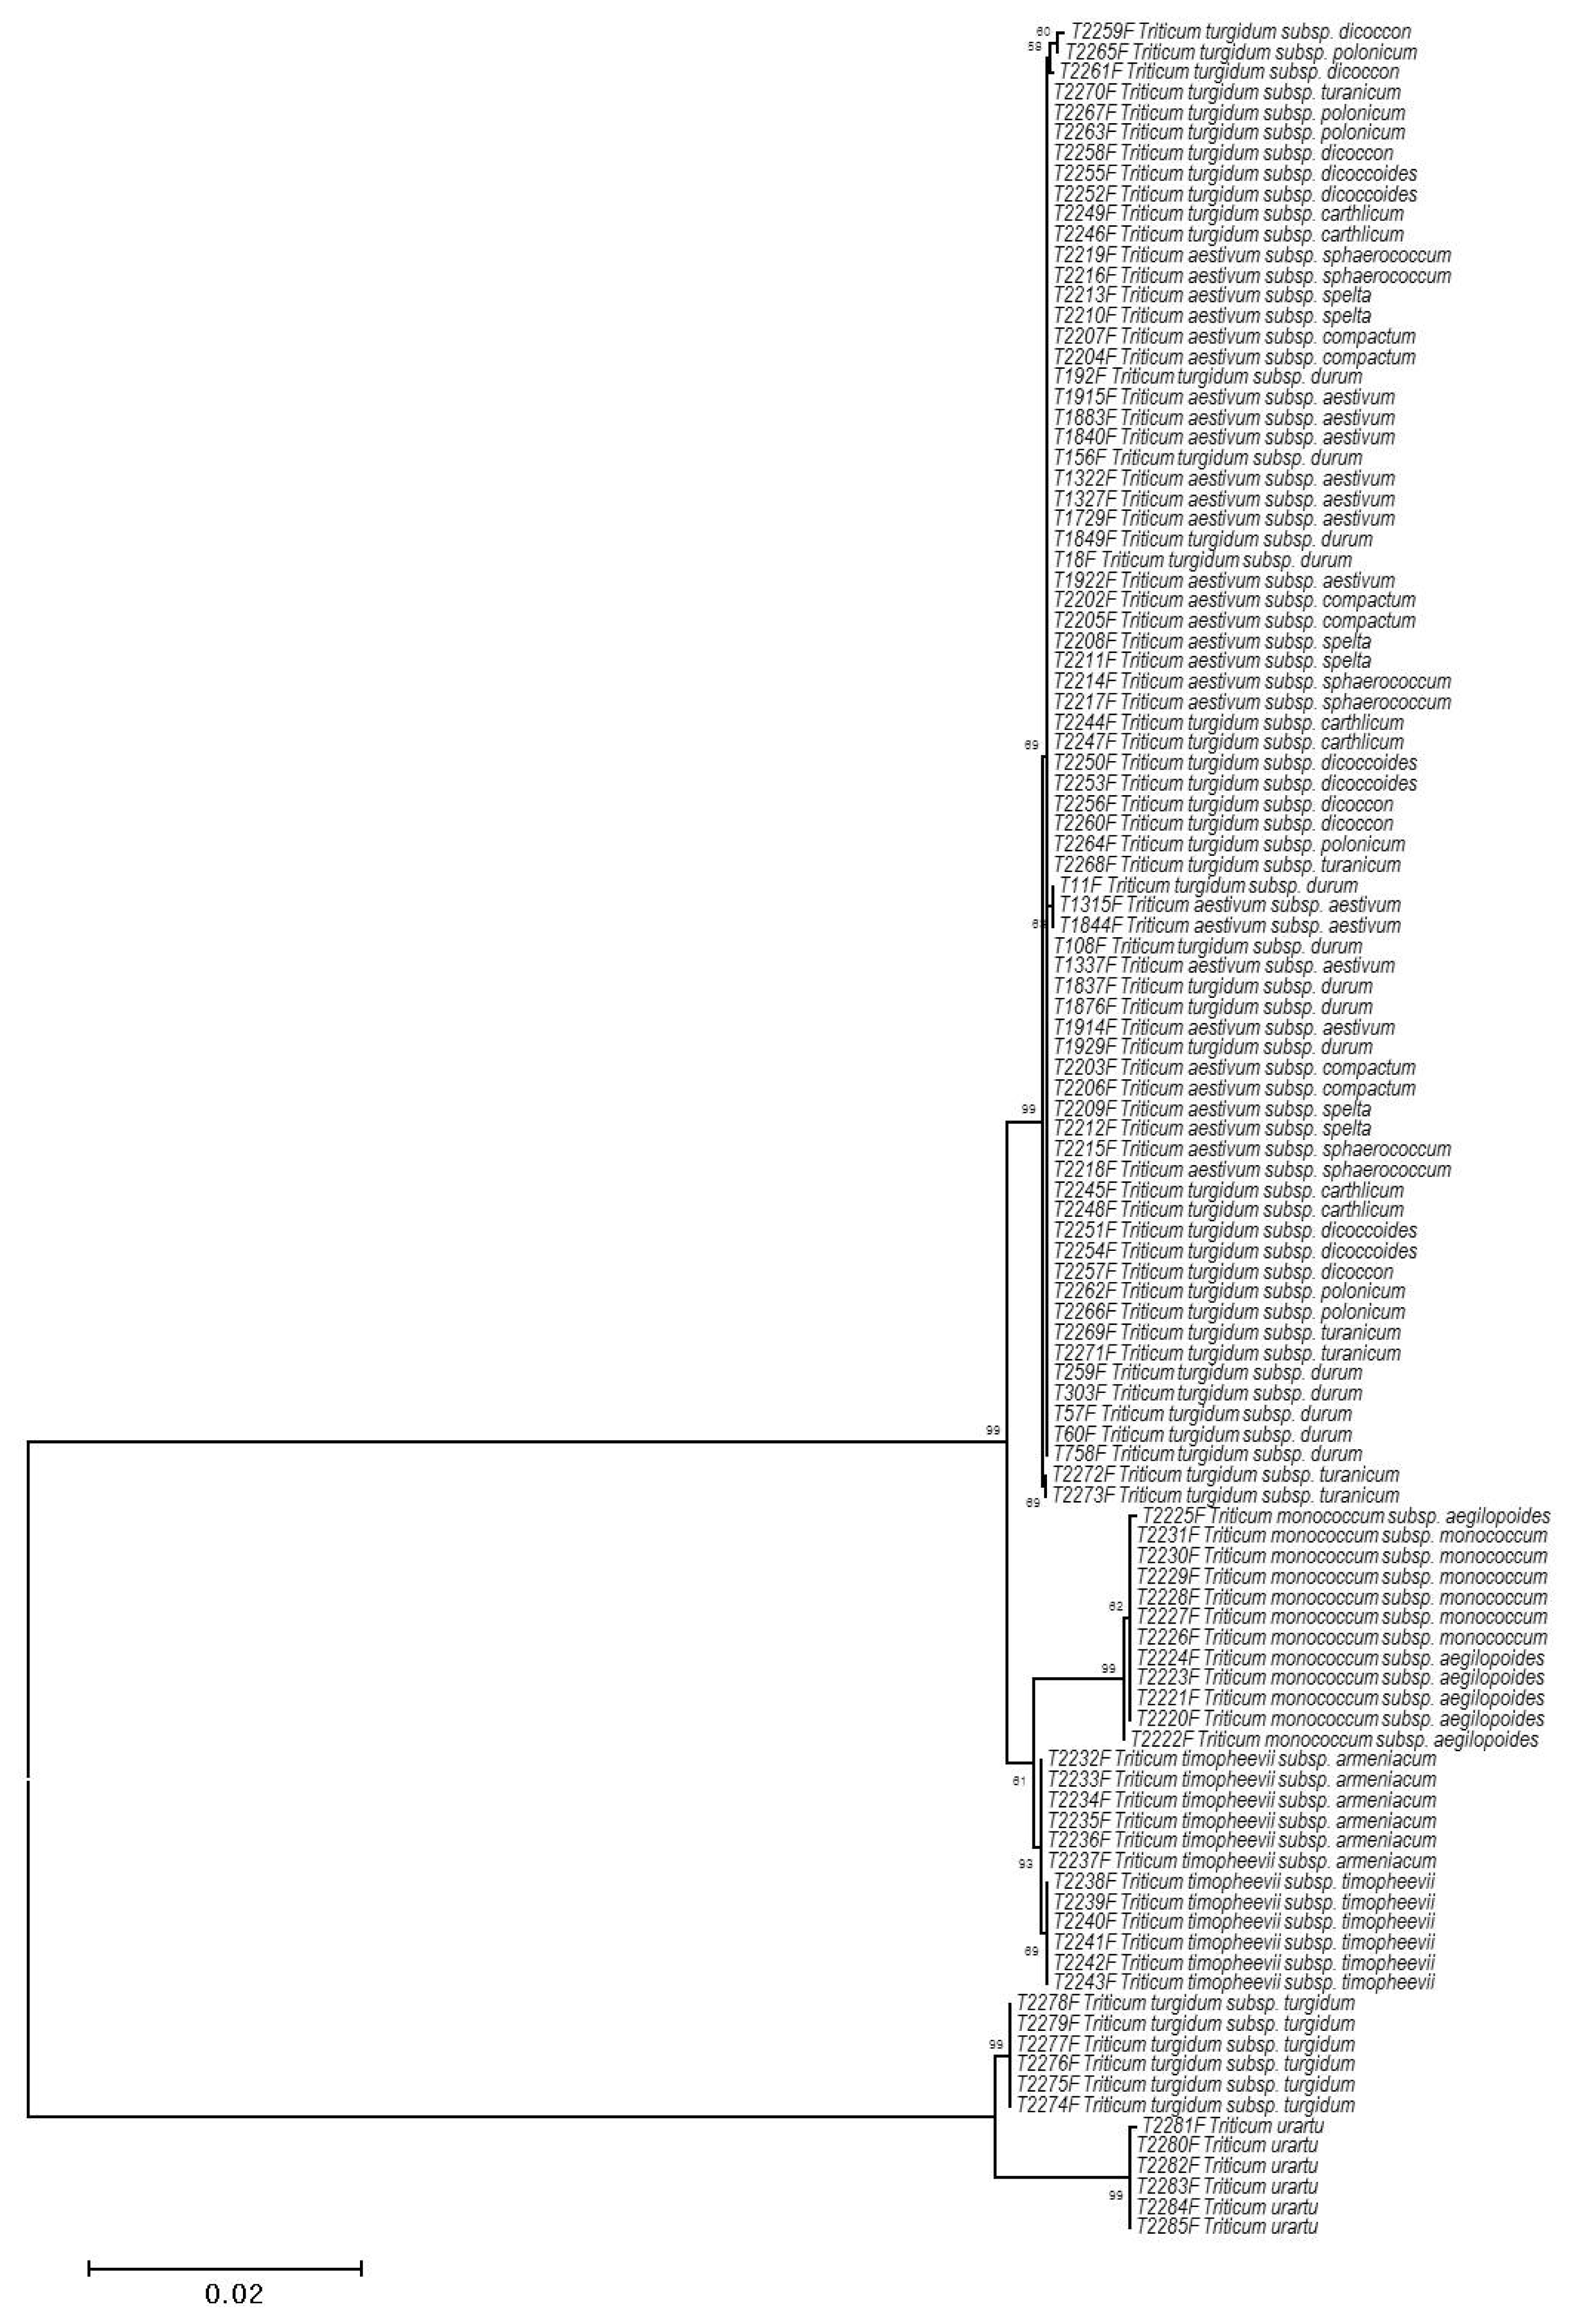
Table 1Barcode primer sequences and PCR conditions used in this study.
Table 1
|
Regions |
Primer sequences 5′-3′ |
PCR conditions |
|
ITS2 |
ATGCGATACTTGGTGTGAAT
GACGCTTCTCCAGACTACAAT |
94°C 3 minutes; 95°C 30 seconds, 56°C 30 seconds, 72°C 30 seconds, 35 cycles; 72°C 7 minutes |
|
matK
|
CGTACAGTACTTTTGTGTTTACGAG
ACCCAGTCCATCTGGAAATCTTGGTTC |
94°C 2 minutes 30 seconds; 94°C 30 seconds, 54°C 30 seconds, 72°C 30 seconds, 10 cycles and 88°C 30 seconds, 54°C 30 seconds, 72°C 30 seconds, 25 cycles; 72°C 10 minutes |
|
psbA-trnH
|
GTTATGCATGAACGTAATGCTC
CGCGCATGGTGGATTCACAATCC |
95°C 2 minutes 30 seconds; 95°C 30 seconds, 58°C 30 seconds, 64°C 1 minute, 35 cycles; 72°C 7 minutes |
|
rbcL
|
ATGTCACCACAAACAGAGACTAAAGC
GAAACGGTCTCTCCAACGCAT |
94°C 2 minutes 30 seconds; 94°C 30 seconds, 54°C 30 seconds, 72°C 30 seconds, 10 cycles and 88°C 30 seconds, 54°C 30 seconds, 72°C 30 seconds, 25 cycles; 72°C 10 minutes |
Table 2Genetic diversity of marker combinations about four markers used in this study.
Table 2
|
DNA barcode |
Individuals (n) |
Number of species |
Aligned length |
variable characters |
nucleotide diversity (π) |
Tajima’s test (D) |
Species Resolved (%) |
Discrimination (%) |
|
ITS2 |
109 |
16 |
431 |
19 |
0.012301 |
1.333055 |
19 |
31 |
|
matK
|
109 |
16 |
708 |
9 |
0.002093 |
−0.328027 |
12 |
31 |
|
psbA-trnH
|
109 |
16 |
568 |
309 |
0.108425 |
0.164594 |
27 |
37 |
|
rbcL
|
109 |
16 |
595 |
3 |
0.001315 |
0.659231 |
14 |
25 |
|
I + M + P + R |
109 |
16 |
2302 |
340 |
0.030040 |
0.236857 |
32 |
37 |
Table 3The number (rates) of sample identification based on analysis of the ‘Best Match’ and ‘Best Close Match’ functions of TAXONDNA software for each DNA barcoding marker and combinations from 109 individuals.
Table 3
|
Barcoding Region |
Best match, N (%) |
Best close match, N (%) |
|
|
|
Correct |
Ambiguous |
Incorrect |
Correct |
Ambiguous |
Incorrect |
No match |
|
ITS2
|
30 (27.52%) |
78 (71.55%) |
1 (0.91%) |
30 (27.52%) |
78 (71.55%) |
1 (0.91%) |
0 (0.0%) |
|
matK
|
30 (27.52%) |
79 (72.47%) |
0 (0.0%) |
30 (27.52%) |
79 (72.47%) |
0 (0.0%) |
0 (0.0%) |
|
psbA-trnH
|
36 (33.02%) |
73 (66.97%) |
0 (0.0%) |
36 (33.02%) |
73 (66.97%) |
0 (0.0%) |
0 (0.0%) |
|
rbcL
|
26 (23.85%) |
83 (76.14%) |
0 (0.0%) |
26 (23.85%) |
83 (76.14%) |
0 (0.0%) |
0 (0.0%) |
|
I + M + P + R |
40 (36.69%) |
68 (62.38%) |
1 (0.91%) |
40 (36.69%) |
68 (62.38%) |
1 (0.91%) |
0 (0.0%) |
References
- Awad M, Fahmy RM, Mosa KA, Helmy M, El-Feky FA. 2017. Identification of effective DNA barcodes for Triticum plants through chloroplast genome-wide analysis. Comput Biol Chem. 71: 20-31.
- Blattner FR. 2004. Phylogenetic analysis of Hordeum (Poaceae) as inferred by nuclear rDNA ITS sequences. Mol Phylogenet Evol. 33: 289-299.
- Čandek K, Kuntner M. 2015. DNA barcoding gap: reliable species identification over morphological and geographical scales. Mol Ecol Resour. 15: 268-277.
- Cao W. 1997. Wheat taxonomy and cultivar identification using molecular markers. Thesis Department of Crop Science and Plant Ecology, University of Saskatchewan.
- Chen SL, Yao H, Han JP, Liu C, Song JY, Shi LC, et al. 2010. Validation of the ITS2 region as a novel DNA barcode for identifying medicinal plant species. PLoS One. 5: e8613
- Clayton WD, Renvoize SA. 1986. Genera graminum. - Kew Bull. Add Ser. 13: 280-281.
- Culumber CM. 2007. DNA barcoding of western North American taxa: Leymus (Poaceae) and Lepidium (Brassicaceae). Thesis Utah State University.
- Dizkirici A, Kansu C, Onde S, Birsin M, Ozgen M, Kaya Z. 2013. Phylogenetic relationships among Triticum L. and Aegilops L. species as genome progenitors of bread wheat based on sequence diversity in trnT-F region of chloroplast DNA. Genet Resour Crop Ev. 60: 2227-2240.
- Dvorak J, Zhang HB. 1990. Variation in repeated nucleotide sequences sheds light on the phylogeny of the wheat B and G genomes. Proc Natl Acad Sci USA. 87: 9640-9644.
- Edet OU, Gorafi YSA, Nasuda S, Tsujimoto H. 2018. DArTseq-based analysis of genomic relationships among species of tribe Triticeae. Sci Rep. 8: 16397-16397.
- Erickson DL, Spouge J, Resch A, Weigt LA, Kress JW. 2008. DNA barcoding in land plants: developing standards to quantify and maximize success. Taxon. 57: 1304-1316.
- Felsenstein J. 1985. Confidence limits on phylogenies: An approach using the bootstrap. Evolution. 39: 783-791.
- Ganopoulos I, Kapazoglou A, Bosmali I, Xanthopoulou A, Nianiou-Obeidat I, Tsaftaris A, et al. 2017. Application of the ITS2 Region for Barcoding Plants of the Genus Triticum L. and Aegilops L. Cereal Res Commun. 45: 381-389.
- Gill BS, Friebe B. 2002. Cytogenetics, phylogeny and evolution of cultivated wheats. pp. 71-88. Curtis BC, Rajaram S, Gomez Macpherson H, editors. Bread wheat: improvement and production. Food and Agriculture Organization of the United Nations. Rome.
- Gill BS, Kimber G. 1974. Giemsa C-banding and the evolution of wheat. Proc Natl Acad Sci USA. 71: 4086-4090.
- Gornicki P, Zhu H, Wang J, Challa GS, Zhang Z, Gill BS, et al. 2014. The chloroplast view of the evolution of polyploid wheat. New Phytol. 204: 704-714.
- Gregory TR. 2005. DNA barcoding does not compete with taxonomy. Nature. 434: 1067-1067.
- Guo J, Yu X, Yin H, Liu G, Li A, Wang H, et al. 2016. Phylogenetic relationships of Thinopyrum and Triticum species revealed by SCoT and CDDP markers. Plant Syst Evol. 302: 1301-1309.
- Heubl G. 2010. New aspects of DNA-based authentication of Chinese medicinal plants by molecular biological techniques. Planta Med. 76: 1963-1974.
- Hollingsworth ML, Andra Clark A, Forrest LL, Richardson J, Pennington RT, Long DG, et al. 2009. Selecting barcoding loci for plants: evaluation of seven candidate loci with species-level sampling in three divergent groups of land plants. Mol Ecol Resour. 9: 439-457.
- Hollingsworth PM, Graham SW, Little DP. 2011. Choosing and using a plant DNA barcode. PLoS One. 6: e19254
- Hsiao C, Chatterton NJ, Asay KH, Jensen KB. 1995. Phylogenetic relationships of the monogenomic species of the wheat tribe, Triticeae (Poaceae), inferred from nuclear rDNA (internal transcribed spacer) sequences. Genome. 38: 211-223.
- Khakhlova O, Bock R. 2006. Elimination of deleterious mutations in plastid genomes by gene conversion. Plant J. 46: 85-94.
- Kimura M. 1980. A simple method for estimating evolutionary rates of base substitutions through comparative studies of nucleotide sequences. J Mol Evol. 16: 111-120.
- Li DZ, Gao LM, Li HT, Wang H, Ge XJ, Liu JQ, et al. 2011. Comparative analysis of a large dataset indicates that internal transcribed spacer (ITS) should be incorporated into the core barcode for seed plants. Proc Natl Acad Sci USA. 108: 19641-19646.
- Lopez-Alvarez D, López-Herranz ML, Betekhtin A, Catalán P. 2012. A DNA barcoding method to discriminate between the model plant Brachypodium distachyon and its close relatives B. stacei and B. hybridum (Poaceae). PLoS One. 7: e51058
- Meier R, Shiyang K, Vaidya G, Ng PKL. 2006. DNA barcoding and taxonomy in diptera: A tale of high intraspecific variability and low identification success. Syst Biol. 55: 715-728.
- Middleton CP, Senerchia N, Stein N, Akhunov ED, Keller B, Wicker T, et al. 2014. Sequencing of chloroplast genomes from wheat, barley, rye and their relatives provides a detailed insight into the evolution of the Triticeae tribe. PLoS One. 9: e85761
- Moghaddam M, Ehdaie B, Waines JG. 2000. Genetic diversity in populations of wild diploid wheat Triticum urartu Tum. ex. Gandil. revealed by isozyme markers. Genet Resour Crop Ev. 47: 323-334.
- Moradkhani H, Mehrabi AA, Etminan A, Pour-Aboughadareh A. 2016. Molecular diversity and phylogeny of Triticum-Aegilops species possessing D genome revealed by SSR and ISSR markers. Plant Breeding and Seed Science. 71: 81-95.
- Moradkhani H, Pour-Aboughadareh A, Mehrabi A, Etminan A. 2013. Evaluation of genetic relationships of Triticum-Aegilops species possessing D genome in different ploidy levels using microsatellites. Intl J Agri Crop Sci. 4: 1746-1751.
- Mori N, Miyashita NT, Terachi T, Nakamura C. 1997. Variation in coxII intron in the wild ancestral species of wheat. Hereditas. 126: 281-288.
- Peat WE. 2009. The Grass Genera of the World, by L. Watson & M. J. Dallwitz. pp. 1038-Wallingford: CAB International. 1992. pp. 421.
- Petersen G, Seberg O, Yde M, Berthelsen K. 2006. Phylogenetic relationships of Triticum and Aegilops and evidence for the origin of the A, B, and D genomes of common wheat (Triticum aestivum). Mol Phylogenet Evol. 39: 70-82.
- Pour-Aboughadareh A, Ahmadi J, Mehrabi AA, Etminan A, Moghaddam M. 2018. Insight into the genetic variability analysis and relationships among some Aegilops and Triticum species, as genome progenitors of bread wheat, using SCoT markers. Plant Biosyst. 152: 694-703.
- Sarkar P, Stebbins GL. 1956. Morphological evidence concerning the origin of the B genome in wheat. Am J Bot. 43: 297-304.
- Saski C, Lee SB, Fjellheim S, Guda C, Jansen RK, Luo H, et al. 2007. Complete chloroplast genome sequences of Hordeum vulgare, Sorghum bicolor and Agrostis stolonifera, and comparative analyses with other grass genomes. Theor Appl Genet. 115: 591
- Steinke D, Zemlak TS, Boutillier JA, Hebert PDN. 2009. DNA barcoding of Pacific Canada’s fishes. Mar Biol. 156: 2641-2647.
- Tamura K, Stecher G, Peterson D, Filipski A, Kumar S. 2013. MEGA6: Molecular Evolutionary Genetics Analysis Version 6.0. Mol Biol Evol. 30: 2725-2729.
- Terachi T, Ogihara Y, Tsunewaki K. 1984. The molecular basis of genetic diversity among cytoplasms of Triticum and Aegilops. III. Chloroplast genomes of the M and modified M genome-carrying species. Genetics. 108: 681-695.
- Thomas KG, Bebeli PJ. 2010. Genetic diversity of Greek Aegilops species using different types of nuclear genome markers. Mol Phylogenet Evol. 56: 951-961.
- Tsunewaki K, Ogihara Y. 1983. The molecular basis of genetic diversity among cytoplasms of Triticum and Aegilops species. II. on the origin of polyploid wheat cytoplasms as suggested by chloroplast DNA restriction fragment patterns. Genetics. 104: 155-171.
- Ureta C, Martínez-Meyer E, Perales HR, Álvarez-Buylla ER. 2012. Projecting the effects of climate change on the distribution of maize races and their wild relatives in Mexico. Glob Chang Biol. 18: 1073-1082.
- Watson L. 1992. The Grass Genera of the World / Leslie Watson and Michael J. Dallwitz. Accessed from https://nla.gov.au/nla.cat-vn2736507. C.A.B International; Wallingford, England
- Wolfe KH, Li WH, Sharp PM. 1987. Rates of nucleotide substitution vary greatly among plant mitochondrial, chloroplast, and nuclear DNAs. Proc Natl Acad Sci USA. 84: 9054-9058.
- Young HA, Lanzatella CL, Sarath G, Tobias CM. 2011. Chloroplast genome variation in upland and lowland switchgrass. PLoS One. 6: e23980
- Zhang W, Qu J, Gu H, Gao W, Liu M, Chen J, et al. 2002. Studies on the origin and evolution of tetraploid wheats based on the internal transcribed spacer (ITS) sequences of nuclear ribosomal DNA. Theor Appl Genet. 104: 1099-1106.