Abstract
Production of spring wheat, the major crop in Mongolia, accounts for 98% of the cultivated area. Understanding genetic variability in existing gene bank accessions is critical for collection, conservation and use of wheat germplasms. To determine genetic diversity and population structure among a representative collection of Mongolian local wheat cultivars and lines, 200 wheat accessions were analyzed with 15 SSR markers distributed throughout the wheat genome. A total of 85 alleles were detected, with three to five alleles per locus and a mean genetic richness of 5.66. Average genetic diversity index was 0.69, with values ranging from 0.37–0.80. The 200 Mongolian wheat accessions were mainly divided into two subgroups based on structure and phylogenetic analyses, and some phenotypes were divergent by the subgroups. Results from this study will provide valuable information for conservation and sustainable use of Mongolian wheat genetic resources.
-
Key words: Wheat, Genetic diversity, Population structure, SSR marker
INTRODUCTION
Mongolia, the 18th largest country with total population of three million estimated in 2016, is one of the lowest population density in the world and has a rich heritage in using grazing lands to produce many diverse livestock products. The Institute of Plant and Agricultural Science (IPAS) prioritized for conservation and sustainable use of agro-biodiversity in Mongolia, a valuable source of genes to breed varieties with high yield, and resistance to various kinds of environmental stresses. Realizing the significance of plant genetic resources (PGR) conservation, IPAS established in 1989 a gene bank division that has the largest plant germplasm collection in Mongolia, with the mission of conservation and sustainable use of agricultural genetic resources. So far, a total of 20,934 seed accessions, including approximately 7,939 wheat germplasm accessions, have been conserved in the Mongolian IPAS gene bank.
Wheat belongs to the genus
Triticum L., a member of the tribe Triticeae, containing approximately 300 species (
Clayton and Renvoize 1986). In the past 60 years, classical wheat breeding has improved remarkably making them the second most-produced (749 million tons) cereal after maize (1.03 billion tons) in cultivated food crops (
FAO 2016). However, a catastrophic loss of bio-diversity is occurring worldwide due to replacement of local varieties in farmers’ fields with improved varieties and species narrowing wheat genetic diversity (
Hoisington et al. 1999). Wild species are useful to genetic improvement of cultivated crops species, and the collection, evaluation, and preservation of genetic resources are essential for crop breeding programs. Therefore, knowledge of genetic variation in conserved accessions is critical for additional collection, conservation and sustainable use of wheat germplasms in Mongolia.
Single Nucleotide polymorphisms (SNPs) has also become increasingly significant as genetic markers for studying population structure (
Gupta et al. 2012;
Singh et al. 2015). Recently, genotyping-by-sequencing (GBS) technology has been deployed to enable SNP discovery and genotyping (
Elshire et al. 2011). DArTseq and SNP markers based on GBS technology have been successfully applied for genetic diversity studies in wheat (
Baloch et al. 2017). As a gene bank possesses large numbers of accessions, this technology remains in laboratories because it needs special equipment and finical support. Unlike other crops, genetic variability has been reportedly low in wheat due to their hexaploid large genome size (
Gupta et al. 1999). In contrast, microsatellite SSRs marker is simple to use with large genomes. It has been used widely in genetic analysis of many crop species. This study was conducted to evaluate genetic diversity and population structures of Mongolian wheat accessions conserved at IPAS gene bank using 15 polymorphic SSR markers.
MATERIALS AND METHODS
Plant materials and phenotyping
To ensure broadly representative sampling, a total of 200 Mongolian wheat accessions, including 181
T. aestivum, 17
T. compactum, and 2
T. durum accessions representing 30 different Mongolian regions, were distributed from the IPAS gene bank in Mongolia. Names, origins and accession numbers are listed in
Supplementary Table S1. Representatives of Mongolian landraces were selected based on characters of nine agronomic traits as follows: vegetation period, seed yield, seed weight, plant height, leaf length, leaf width, seed number per spike, seed weight per spike and spike length.
For genomic comparisons, seeds of each accession were germinated and leaf samples were used for genomic DNA extraction using a DNA extraction kit (Qiagen Korea, Seoul, Republic of Korea). Purity and concentration of extracted DNA were estimated using a NanoDrop ND-1000 spectrophotometer (NanoDrop Technologies, Inc., Wilmington, DE). The final concentration of each DNA sample was adjusted to 20 ng/μL. For SSR assays, a total of 15 polymorphic SSR markers were selected from the previously reported study (
Chen et al. 2012). SSR alleles were amplified with fluorescent labeled primers, resolved on ABI Prism 3100 DNA sequencer (Applied Biosystems, Foster City, CA) using GeneScan 3.7 software (Applied Biosystems), and sized precisely using GeneScan 500 ROX (6-carbon-X-rhodamine) molecular size standards (35–500 bp) and Genotyper 3.7 software (Applied Bio-systems).
To determine variability at each locus, including the number of alleles (NA), major allele frequency (M
AF), number of genotypes (NG), observed heterozygosity (H
O), genetic diversity (GD), and polymorphic information content (PIC) were calculated using Genetic analysis package in PowerMarker ver. 3.23 (
Liu and Muse 2005).
Population structure was determined on 200 Mongolian wheat accessions. Molecular data were analyzed with a model-based software program STRUCTURE 2.3.3 (
Pritchard et al. 2000;
Falush et al. 2003). The number of subgroups (K) was set from 1–10 based on models characterized by admixture and correlated allele frequencies. For each K, three runs were conducted separately. The average likelihood value, L(
K), across all runs was calculated for each
K. In this model, several subpopulations (
K) were present, each characterized by a set of allele frequencies for each locus. Individuals in the sample were assigned to subpopulations or jointly to two or more subpopulations if genotypes were admixed. The model choice criterion to detect the most likely value of
K was ΔK, an ad hoc quantity related to the second-order change in log probability of data (LnP[D]) with respect to the number of clusters inferred by STRUCTURE (
Evanno et al. 2005). An individual was assigned to a subpopulation group if > 80% of its genome fraction value was derived from that group.
Significance of variance between and among wheat populations was tested by Analysis of Molecular Variance (AMOVA) permuting the DNA marker data 999 times using GENALEX 6.5 (
Peakall and Smouse 2012). To examine genetic relationships, phylogentic dendrogram was constructed based on genetic distance matrix using MEGA 4 software (
Tamura et al. 2007).
RESULTS
Diversity of SSR loci in the wheat accession
Analyzing among the 15 SSR loci, a total of 85 alleles were detected, and allelic richness per locus varied widely among markers, ranging from 3 (Xwmc720)-9 (Xwmc671), with an average of 5.7 alleles per locus (
Table 1). Major alleles frequency per locus ranged from 0.26 (Xwmc664)-0.77 (Xwmc720), with an average value of 0.42 per marker. Overall PIC value ranged from 0.33 (Xwmc720)-0.77 (Xwmc758 and Xwmc664), with an average value of 0.64. Genetic diversity index values ranged from 0.37 (Xwmc720)-0.80 (Xwmc758 and Xwmc664), and the mean genetic diversity index was 0.69. By the Triticum species,
T. aestivum (181 accs) and
T. compactum (17 accs) revealed average numbers of allele as 5.7 and 3.7, respectively, and polymorphism information contents were 0.64 and 0.51 for
T. aestivum and
T. compactum, respectively (
Table 2).
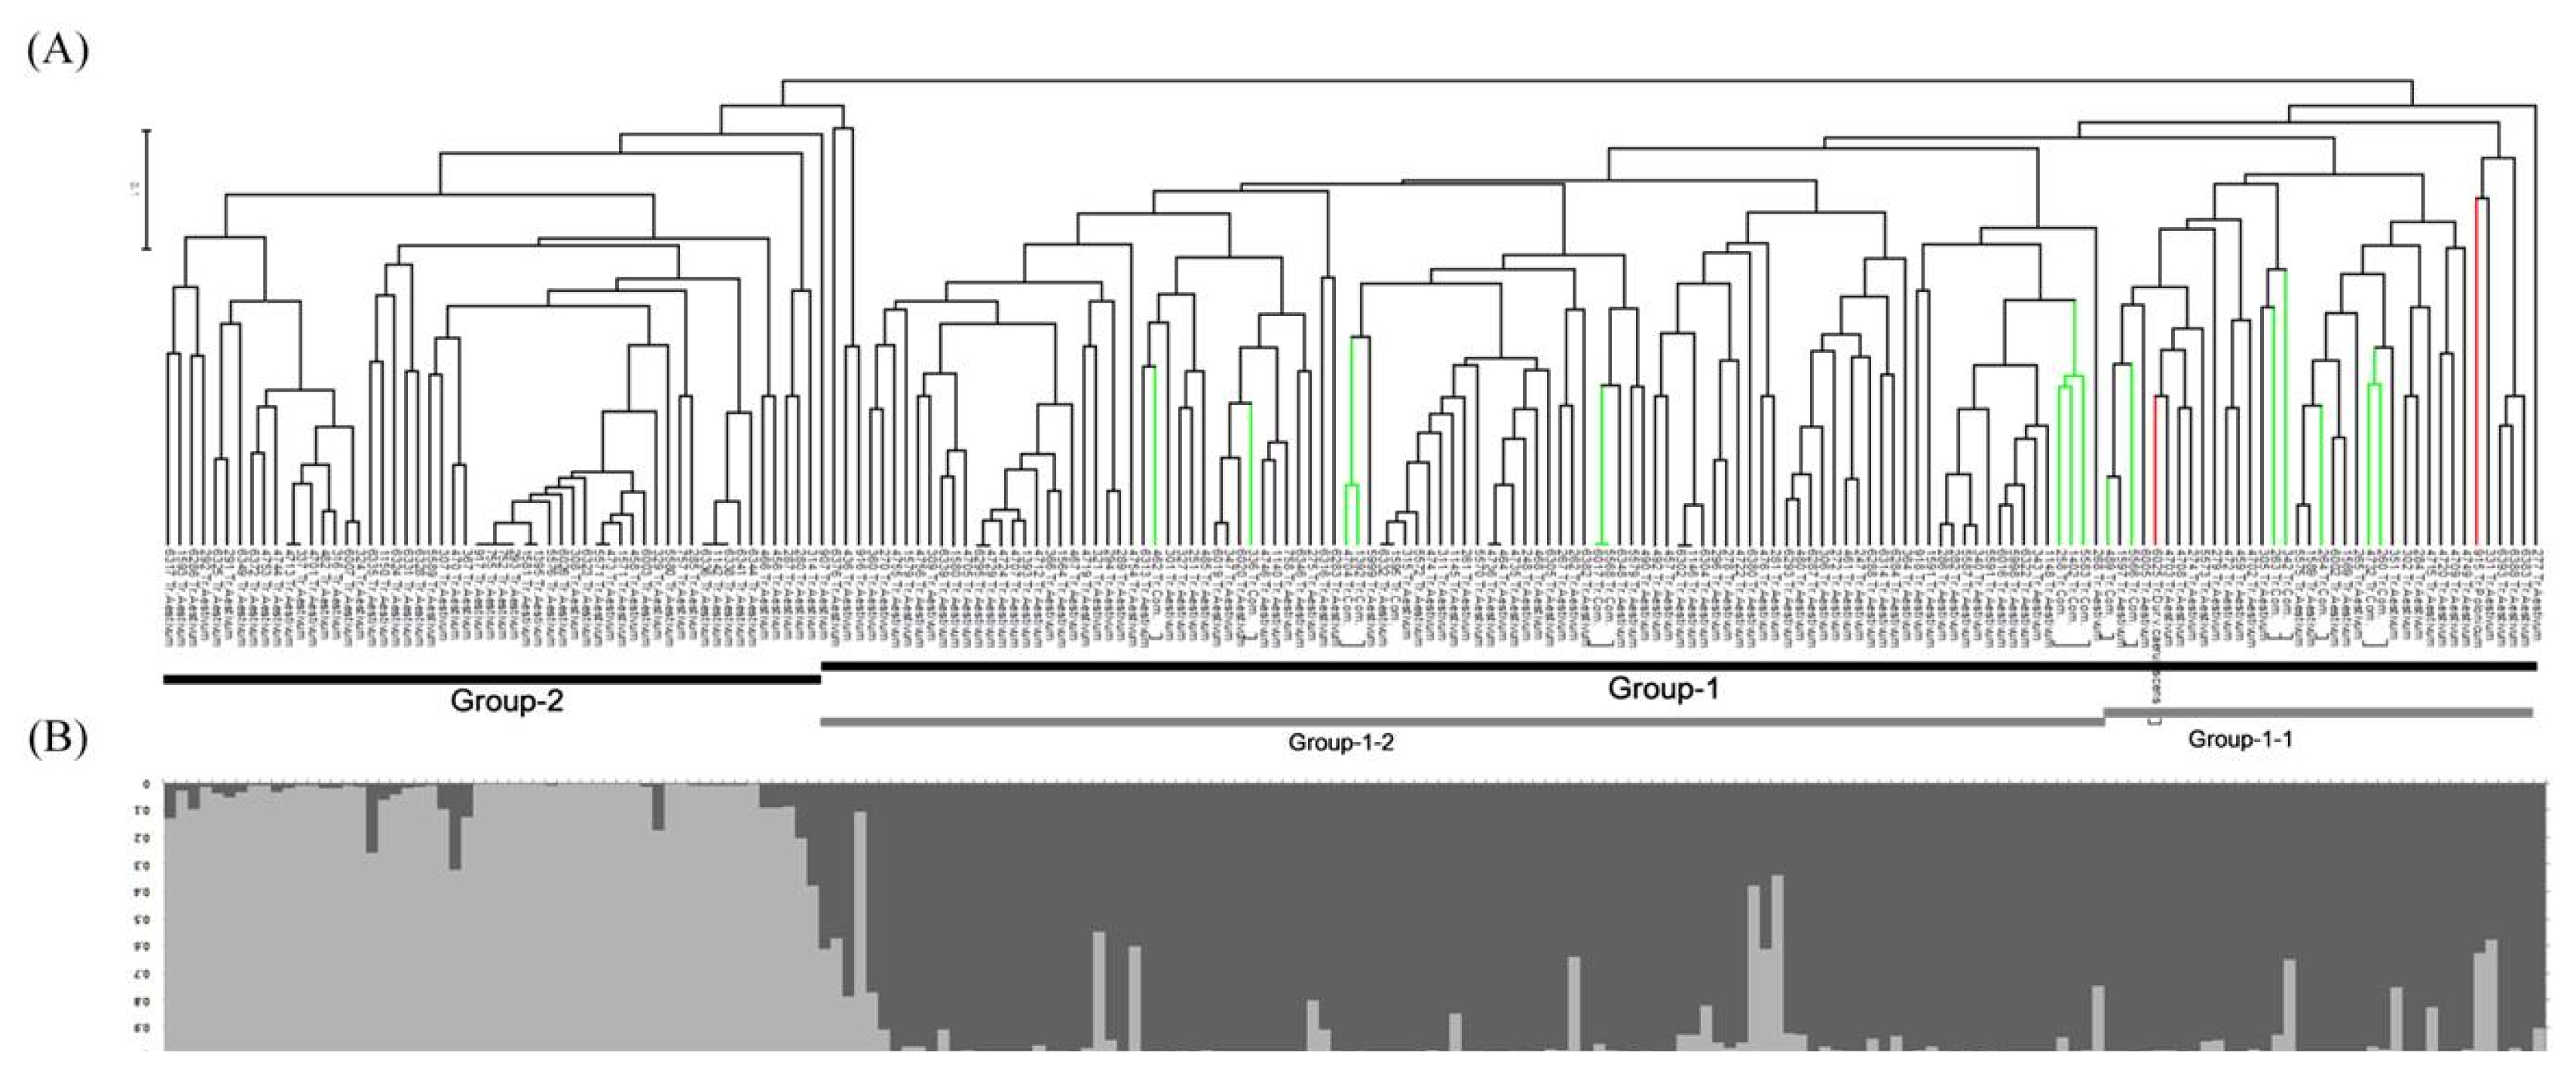
Phylogenetic dendrogram based on a genetic distance matrix revealed mainly two groups (Group-1 and Group-2) (
Fig 1A). In the constructed dendrogram,
T. aestivum accessions were divergent to Group-1 and Group-2. All
T. compactum and
T. polonicum wheat accessions were distributed in Group-1, and
T. polonicum accessions were appertained into sub-group of Group-1-1. Similarly, in the Bayesian STRUCTURE model,
T. aestivum accessions were clustered in to Group-1 and Group-2. All
T. compactum and
T. polonicum wheat accessions were distributed in Group-1, and accessions of
T. polonicum and
T. compactum were appertained into sub-group of Group-1-1.
Population structure of tested Mongolian wheat accessions was estimated using a Bayesian clustering approach to infer the number of clusters (populations) with STRUCTURE V2.3.3 software based on 15 genome-wide SSR markers. According to
Evanno et al. (2005), ΔK was plotted against the number of sub-groups. This model assumes that the number of populations was K and the loci were independent in Hardy-Weinberg equilibrium. K=1 to 10 populations were tested, Ln(PD) kept increasing with increasing population numbers but there was no clear population structure, therefore Ln(PD) derived ΔK was plotted against the K to determine the number of populations. Accordingly, the Mongolian wheat collection was classified into two populations, pop1 (dark gray) and pop2 (light gray) containing 146 and 54 accessions, respectively, and this inferred two populations revealed a similar trend to phylogenetic grouping (
Fig. 1B).
Mean genetic diversities for each SSR locus in pop1 and pop2 of Mongolian wheat were 0.63 and 0.51, respectively. Mean PIC values for each SSR locus in pop1 and pop2 were 0.59 and 0.47, respectively (
Table 3). Comparative study revealed that the accessions from pop1 (GD=0.63, PIC=0.59) possessed greater genetic diversities than pop2 (GD=0.51, PIC=0.47). Similarly, the average allele number in pop1 (5.3) was higher than that in pop2 (4.0), with an average of 4.6 for the two inferred clusters. Determination of pairwise F
ST for the inferred clusters pop1 and pop2 revealed a F
ST of 0.159 indicates high genetic variations between the two clusters (
Table 3). Distribution of molecular variance among and within clusters was estimated using AMOVA. Results revealed that 22% of the total variation was among species while 66% of the variations were among individuals within population clusters (
Table 4).
Agronomic characters were surveyed and these revealed diversity of agronomic phenotypes in tested Mongolian wheat accessions. Mean values of nine agronomic traits across inferred two populations are shown in
Table 5. Among the nine agronomic traits studied, four traits such as seed yield, seed weight, seed number per spike and seed weight per spike revealed significant variation according to the inferred two populations.
DISCUSSION
In this study, 15 SSR markers produced 85 alleles and the number of detected alleles over all loci across population ranged from 3 to 9, with an average of 5.7 alleles per locus. Various studies have reported averages of 4.81–18.1 alleles per locus on whole genome level in different wheat collections (
Huang et al. 2002;
Dreisigacker et al. 2004;
Roussel et al. 2004;
Maccaferri et al. 2005;
Breseghello and Sorrells 2006;
Zhang et al. 2010;
Hao et al. 2011). Results revealed SSR allele diversity in Mongolian wheat germplasm were comparable with estimates in earlier studies. Some differences in allele diversity may be because of differences in tested accessions, number of markers and techniques used to detect polymorphism. For example, genetic diversity of 90 Chinese winter wheat accessions were analyzed with 269 SSR markers that produced an average of 5.05 alleles per locus (
Chen et al. 2012), whereas,
Roussel et al. (2004) reported an average of 14.5 alleles per locus with 559 French wheat accessions using 42 SSR markers.
Genetic variability among accessions was assessed with PIC and GD values. Average PIC and GD were 0.64 and 0.69, respectively.
Huang et al. (2002) studied a worldwide collection of 998 accessions with 26 SSR loci that revealed a gene diversity value of 0.77.
Hao et al. (2011) have reported genetic diversity of 250 Chinese bread wheat accessions that revealed mean PIC value of 0.65.
Roussel et al. (2004) observed the average number of alleles and PIC were 16.1 and 0.72, respectively. In addition, using DArT markers yielded a lower level of genetic diversity within U.S. wheat in comparison with Australian wheat (
White et al. 2008). Compared to these reports, our results revealed similar levels of mean PIC (0.64) and GD value (0.69). Therefore, tested Mongolian wheat germplasm have considerable genetic diversity.
AMOVA analysis agreed with UPGMA clustering and supported a high level of diversity within tested samples. Although variation within Mongolian accessions was lower in comparison to accession variation, it was significant according to the partitioning value (
P=0.001). Recently, it was reported that genetic variability between subpopulations of durum wheat was much lower (17%) than variability within them (83%), though all subpopulations had similar biomass values in growth stages (
Soriano et al. 2016). This high variation within populations may be attributed to the time of growth condition. Phylogenetic dendrogram based on genetic distance revealed a similar trend to the population structure analysis, revealing two possible subpopulations using model-based STRUCTURE (
Fig. 1). Results revealed there are two possible divergent groups in tested representative Mongolian wheat germplasm.
In conclusion, 85 alleles were detected with an average of 5.7 alleles per SSR locus among diverse Mongolian wheat accessions. Model-based STRUCTURE analysis revealed the presence of two subpopulations, essentially consistent with clustering results based on genetic diversity. Our study revealed a high level of genetic diversity in tested Mongolian germplasm. Results of this study will provide information for future breeding programs and may be useful for evaluation and conservation of wheat genetic resources.
Supplementary Information
ACKNOWLEGEMENTS
This study was conducted with the support of the “Research Program for Agricultural Science & Technology Development (Project No. PJ012040)”. It was also supported by the 2016 Postdoctoral Fellowship Program of the National Institute of Agricultural Science funded by the Rural Development Administration, Republic of Korea.
Fig. 1Phylogenetic dendrogram (A) and Bayesian model-based population structure (B) based on simple sequence repeat profiles in Mongolian wheat accessions.

Table 1Characterization of genetic diversity in 200 Mongolian wheat accessions based on 15 simple sequence repeat (SSR) loci.
Table 1
|
Marker |
Primers |
NA |
MAF
|
NG |
GD |
Ho
|
PIC |
|
Xwmc765 |
F: 5′gggATCAgACTgggACTggAg3′
R: 5′gggTTggCTTggCAgAgAA3′ |
6.0 |
0.38 |
10.0 |
0.72 |
0.10 |
0.68 |
|
Xwmc609 |
F: 5′CATCCAgCCCATgTAgACgC3′
R: 5′AACggTgCCCATCATCTCCC3′ |
5.0 |
0.53 |
9.0 |
0.62 |
0.08 |
0.56 |
|
Xwmc758 |
F: 5′TAggggAggCgACggAg3′
R: 5′gTTgCTggAgAgTggATTgC3′ |
6.0 |
0.30 |
15.0 |
0.80 |
0.20 |
0.77 |
|
xwmc657 |
F: 5′CgggCTgCgggggTAT3′
R: 5′CggTTgggTCATTTgTCTCA3′ |
4.0 |
0.40 |
6.0 |
0.66 |
0.02 |
0.59 |
|
Xwmc795 |
F: 5′ggCTCgATTCCgTTACCTCA3′
R: 5′ggCgATTCgCCACACCT3′ |
7.0 |
0.36 |
12.0 |
0.74 |
0.03 |
0.70 |
|
xbarc213 |
F: 5′gCgTAgATTCTCggTTTgTTggCTTgC3′
R: 5′CCgTCCCTCCTTCCTggTCT3′ |
4.0 |
0.48 |
7.0 |
0.58 |
0.06 |
0.49 |
|
Xwmc598 |
F: 5′TCgAggAgTCAACATgggCTg3′
R: 5′ACggTCgCTAgggAggggAg3′ |
4.0 |
0.43 |
10.0 |
0.71 |
0.22 |
0.66 |
|
Xgwm539 |
F: 5′CTgCTCTAAgATTCATgCAACC3′
R: 5′gAggCTTgTgCCCTCTgTAg3′ |
8.0 |
0.52 |
12.0 |
0.65 |
0.03 |
0.60 |
|
Xgwm282 |
F: 5′TTggCCgTgTAAggCAg3′
R: 5′TCTCATTCACACACAACACTAgC3′ |
7.0 |
0.62 |
8.0 |
0.58 |
0.04 |
0.55 |
|
Xwmc661 |
F: 5′CCACCATggTgCTAATAgTgTC3′
R: 5′AgCTCgTAACgTAATgCAACTg3′ |
6.0 |
0.29 |
14.0 |
0.79 |
0.35 |
0.75 |
|
Xgwm645 |
F: 5′TgACCggAAAAgggCAgA3′
R: 5′gCCCCTgCAggAgTTTAAgT3′ |
5.0 |
0.33 |
5.0 |
0.76 |
0.00 |
0.73 |
|
Xwmc783 |
F: 5′AggTTggAgATgCAggTggg3′
R: 5′TCTTCCTTCTCCTgCCgCTA3′ |
5.0 |
0.31 |
8.0 |
0.77 |
0.03 |
0.73 |
|
Xwmc671 |
F: 5′gTACgTCAAAgAAAgAgAATTACCTC3′
R: 5′CTCAgAgATATATCTTCgTTgTCAgT3′ |
9.0 |
0.30 |
18.0 |
0.76 |
0.18 |
0.72 |
|
Xwmc664 |
F: 5′gggCCAACAAATCCAAT3′
R: 5′TCTACTTCCTTCATCCACTCC3′ |
6.0 |
0.26 |
14.0 |
0.80 |
0.25 |
0.77 |
|
Xwmc720 |
F: 5′CACCATggTTggCAAgAgA3′
R: 5′CTggTgATACTgCCgTgACA3′ |
3.0 |
0.77 |
5.0 |
0.37 |
0.02 |
0.33 |
|
Total |
|
85.0 |
|
153.0 |
|
|
|
|
Mean |
|
5.7 |
0.42 |
10.2 |
0.69 |
0.11 |
0.64 |
Table 2Genetic diversity in the Mongolian wheat based on 15 simple sequence repeat (SSR) loci.
Table 2
|
Group |
No. of accessions |
MAF |
NA |
GD |
PIC |
|
Total (200 accs) |
200 |
0.42 (0.26–0.77) |
5.7 (3–9) |
0.69 (0.37–0.80) |
0.64 (0.33–0.77) |
|
T. aestivum (181 accs) |
181 |
0.412 (0.25–0.77) |
5.7 (3–9) |
0.69 (0.37–0.80) |
0.64 (0.33–0.77) |
|
T. compactum (17 accs) |
17 |
0.53 (0.27–0.77) |
3.7 (2–5) |
0.58 (0.38–0.76) |
0.51 (0.31–0.72) |
|
T. polonicum (2 accs) |
2 |
0.5 (0–1) |
1.3 (0–3) |
0.52 (0–1) |
0.47 (0–1) |
Table 3Diversity information and FST values in the inferred subpopulations.
Table 3
|
Inferred group |
Diversity |
*FST
|
|
|
n |
NA |
GD |
H |
PIC |
1 |
2 |
Overall |
|
pop1 |
142 |
5.3 |
0.63 |
0.11 |
0.59 |
0.000 |
- |
- |
|
pop2 |
58 |
4.0 |
0.51 |
0.09 |
0.47 |
0.159 |
0.000 |
- |
|
Average |
|
4.6 |
0.57 |
0.10 |
0.53 |
- |
- |
0.159 |
Table 4Analysis of molecular variance (AMOVA) of a number of populations.
Table 4
|
Source |
df |
SS |
MS |
Est. Var. |
%Tv |
P
|
|
Among species |
1 |
239.199 |
239.199 |
1.398 |
22% |
0.001 |
|
Among accessions |
198 |
1767.981 |
8.929 |
4.088 |
66% |
0.001 |
|
Within accessions |
200 |
150.500 |
0.753 |
0.753 |
12% |
0.001 |
|
Total |
399 |
2157.680 |
|
6.239 |
100% |
|
Table 5Average values±SD of each group in STRUCTURE based on wheat characters.
Table 5
|
Structure |
Vegetation period |
Yield (g/m2) |
1000 seed weight |
Plant height |
Leaf length |
Leaf width |
Seed number per spike |
Seed weight per spike |
Spike length |
|
Pop1 |
107.2±19.4 |
268.1±55.3 |
30.2±4.4 |
96.1±9.6 |
20.7±3.9 |
1.3±0.3 |
36.0±7.9 |
1.2±0.3 |
7.9±1.0 |
|
Pop2 |
106.5±19.4 |
285.6±50.3 |
32.3±4.8 |
98.8±12.1 |
21.2±3.6 |
1.3±0.3 |
27.4±7.8 |
1.0±0.3 |
7.9±1.0 |
|
ns |
*
|
**
|
ns |
ns |
ns |
**
|
**
|
ns |
References
- Baloch FS, Alsaleh A, Shahid MQ, Çiftçi VE, Sáenz de Miera L, Aasim M, et al. 2017. A whole genome DArTseq and SNP analysis for genetic diversity assessment in durum wheat from Central Fertile Crescent. PLoS One. 12: e0167821
- Breseghello F, Sorrells ME. 2006. Association mapping of kernel size and milling quality in wheat (Triticum aestivum L.) cultivars. Genetics. 172: 1165-1177.
- Chen X, Min D, Yasir TA, Hu YG. 2012. Genetic diversity, population structure and linkage disequilibrium in elite Chinese winter wheat investigated with SSR markers. PLoS One. 7: e44510
- Clayton WD, Renvoize SA. 1986. Genera Graminum Grasses of the World. HMSO. London.
- Dreisigacker S, Zhang P, Warburton ML, Van Ginkel M, Hoisington D, Bohn M, et al. 2004. SSR and pedigree analyses of genetic diversity among CIMMYT wheat lines targeted to different megaenvironments. Crop Science. 44: 381-388.
- Elshire RJ, Glaubitz JC, Sun Q, Poland JA, Kawamoto K, Buckler ES, et al. 2011. A robust, simple genotyping-by-sequencing (GBS) approach for high diversity species. PLoS One. 6: e19379
- Evanno G, Regnaut S, Goudet J. 2005. Detecting the number of clusters of individuals using the software STRUCTURE: a simulation study. Mol Ecol. 14: 2611-2620.
- Falush D, Stephens M, Pritchard JK. 2003. Inference of population structure using multilocus genotype data: linked loci and correlated allele frequencies. Genetics. 164: 1567-1587.
- FAO.2016. World food situation: FAO cereal supply and demand brief. Rome, Italy: United Nations, Food and Agriculture Organization. 8; December 2016. Retrieved 19 January 2017.
- Fu Y-B. 2015. Understanding crop genetic diversity under modern plant breeding. Theor Appl Genet. 128: 2131-2142.
- Govindaraj M, Vetriventhan M, Srinivasan M. 2015. Importance of genetic diversity assessment in crop plants and its recent advances: an overview of its analytical perspectives. Genetics Research International. 2015: 14
- Gupta P, Idris A, Mantri S, Asif MH, Yadav HK, Roy JK, et al. 2012. Discovery and use of single nucleotide polymorphic (SNP) markers in Jatropha curcas L. Mol Breeding. 30: 1325-1335.
- Gupta PK, Varshney RK, Sharma PC, Ramesh B. 1999. Molecular markers and their applications in wheat breeding. Plant Breeding. 118: 369-390.
- Hao C, Wang L, Ge H, Dong Y, Zhang X. 2011. Genetic diversity and linkage disequilibrium in Chinese bread wheat (Triticum aestivum L.) revealed by SSR markers. PLoS One. 6: e17279
- Hoisington D, Khairallah M, Reeves T, Ribaut JM, Skovmand B, Taba S, et al. 1999. Plant genetic resources: what can they contribute toward increased crop productivity? Proc Natl Acad Sci USA. 96: 5937-5943.
- Huang X, Börner A, Röder M, Ganal M. 2002. Assessing genetic diversity of wheat (Triticum aestivum L.) germplasm using microsatellite markers. Theor Appl Genet. 105: 699-707.
- Khan MK, Pandey A, Choudhary S, Hakki EE, Akkaya MS, Thomas G. 2014. From RFLP to DArT: molecular tools for wheat (Triticum spp.) diversity analysis. Genetic Resources and Crop Evolution. 61: 1001-1032.
- Khan MK, Pandey A, Thomas G, Akkaya MS, Kayis SA, Ozsensoy Y, et al. 2015. Genetic diversity and population structure of wheat in India and Turkey. AoB PLANTS. 7: plv083-plv083.
- Laido G, Mangini G, Taranto F, Gadaleta A, Blanco A, Cattivelli L, et al. 2013. Genetic diversity and population structure of tetraploid wheats (Triticum turgidum L.) estimated by SSR, DArT and pedigree data. PLoS One. 8: e67280
- Landjeva S, Korzun V, Börner A. 2007. Molecular markers: actual and potential contributions to wheat genome characterization and breeding. Euphytica. 156: 271-296.
- Liu K, Muse SV. 2005. PowerMarker: an integrated analysis environment for genetic marker analysis. Bioinformatics. 21: 2128-2129.
- Maccaferri M, Sanguineti MC, Noli E, Tuberosa R. 2005. Population structure and long-range linkage disequilibrium in a durum wheat elite collection. Mol Breeding. 15: 271-290.
- Peakall R, Smouse PE. 2012. GenAlEx 6.5: genetic analysis in Excel. Population genetic software for teaching and research--an update. Bioinformatics. 28: 2537-2539.
- Pritchard JK, Stephens M, Donnelly P. 2000. Inference of population structure using multilocus genotype data. Genetics. 155: 945-959.
- Roussel V, Koenig J, Beckert M, Balfourier F. 2004. Molecular diversity in French bread wheat accessions related to temporal trends and breeding programmes. Theor Appl Genet. 108: 920-930.
- Ruiz M, Giraldo P, Royo C, Villegas D, Aranzana MJ, Carrillo JM. 2012. Diversity and Genetic Structure of a Collection of Spanish Durum Wheat Landraces. Crop Science. 52: 2262-2275.
- Singh N, Jayaswal PK, Panda K, Mandal P, Kumar V, Singh B, et al. 2015. Single-copy gene based 50 K SNP chip for genetic studies and molecular breeding in rice. Sci Rep. 5: 11600
- Soriano JM, Villegas D, Aranzana MJ, Garcia Del Moral LF, Royo C. 2016. Genetic structure of modern durum wheat cultivars and Mediterranean landraces matches with their agronomic performance. PLoS One. 11: e0160983
- Suresh S, Chung JW, Cho GT, Sung JS, Park JH, Gwag JG, et al. 2014. Analysis of molecular genetic diversity and population structure in Amaranthus germplasm using SSR markers. Plant Biosyst. 148: 635-644.
- Tamura K, Dudley J, Nei M, Kumar S. 2007. MEGA4: Molecular Evolutionary Genetics Analysis (MEGA) software version 4.0. Mol Biol Evol. 24: 1596-1599.
- Tautz D. 1989. Hypervariability of simple sequences as a general source for polymorphic DNA markers. Nucleic Acids Res. 17: 6463-6471.
- White J, Law JR, MacKay I, Chalmers KJ, Smith JS, Kilian A, et al. 2008. The genetic diversity of UK, US and Australian cultivars of Triticum aestivum measured by DArT markers and considered by genome. Theor Appl Genet. 116: 439-453.
- Zarei Abbasabad E, Mohammadi SA, Moghaddam M, Jalal Kamali MR. 2016. Analysis of genetic diversity, population structure and linkage disequilibrium in Iranian wheat landraces using SSR markers. Plant Genetic Resources. 1: 1-8.
- Zhang D, Bai G, Zhu C, Yu J, Carver BF. 2010. Genetic diversity, population structure, and linkage disequilibrium in U.S. elite winter wheat. The Plant Genome. 3: 117-127.