Abstract
Pre-harvest sprouting (PHS) of wheat reduces grain yield and has deleterious effects on wheat flour quality. PHS resistance is strongly associated with grain color and seed dormancy. Resistance to PHS is a priority of wheat breeding program. We have studied a population of 122 Doubled Haploid (DH) lines from the cross between two cultivars, ‘Keumkang’ and ‘Olgeuru’, in order to detect QTLs correlated with PHS resistance. PHS was evaluated using mist spray in the humid chamber (PHS-MS), and the germination index (GI) was determined for two years. The variety ‘Keumkang’ has white grains and higher percentage of PHS rate (30.2%), while ‘Olgeuru’ has red grains and lower PHS rate (2.8%). There was significant difference in grain color according to the GI. PHS-MS was positively correlated with GI (r = 0.732, P < 0.001). Two molecular markers, Xbarc12 and Xgwm3, were found correlated with PHS resistance and GI. These markers were mapped on chromosomes 3A and 3D with LOD scores of 4.95 and 4.02, respectively. Xbarc12 explained the highest amount of phenotypic variation (R2) which is 11.99% in GI and 27.25% in PHS. Xgwm3 explained 9.10% of phenotypic variation in GI. The respective value of PHS-MS and GI in Korean wheat cultivars ranged from 1.37% to 86.75% and from 0.03 to 0.73. This study provides useful information for marker-assisted wheat breeding for PHS resistance improvement in Korea.
-
Key words: Doubled haploid line, Pre-harvest sprouting resistance, Simple sequence repeats, Wheat
INTRODUCTION
Pre-harvest sprouting (PHS) of wheat, which causes a major loss of grain yield and a reduction of end-use quality, has been frequently observed in southern part of Korea due to the prevailing rainy seasons during the harvesting period (
Kim et al. 2012). Improvement of PHS resistance has been one of the most important efforts carried out in Korean wheat breeding programs to solve this problem. However, PHS is generally influenced by both genotype and environment, and PHS resistance could be also influenced by seed dormancy, seed coat permeability and color, α-amylase activities, endogenous hormones levels and genes (
Gao et al. 2013). Molecular markers associated with PHS resistance have been reported which consequently facilitated in understanding the genetic control of PHS resistance and in developing PHS resistance wheat cultivars, which is otherwise hard to achieve through phenotypic selection only (
Finkelstein et al. 2008;
Gupta et al. 2010).
Several sequence-tagged sites (STS) markers were evaluated to determine the relationship between PHS resistance and allelic variations of Korean wheat cultivars in our previous studies. Allelic variations at
TaPHS1 and
TaVp-1A loci, the molecular markers associated with PHS and seed dormancy, were not significantly different from PHS resistance in Korean wheat cultivars, although
TaSdr-B1a allele showed lower PHS value than
TaSdr-B1b allele (
Kim et al. 2012,
in press).
Kim et al. (in press) reported the relationship between seed dormancy and STS markers associated with grain weight,
TaSus2-2B,
TaGW2-6A and
TaCwi-A1 alleles. Seed dormancy was correlated positively with grain traits, including length, width, thickness and thousand kernel weight of grain (
Shin et al. 2013). Allelic variations at
TaGW2-6A and
TaCwi-A1 loci were not significantly different from seed dormancy, although
Hap-H haplotype showed a higher seed dormancy than
Hap-L haplotype in
TaSus2-2B alleles.
Quantitative trait loci (QTLs) associated with PHS resistance have been found in all chromosomes, except in chromosomes 1D and 4D (
Groos et al. 2002;
Flintham et al. 2002;
Kulwal et al. 2004,
2005,
2012;
Lohwasser et al. 2005;
Mori et al. 2005;
Kottearachchi et al. 2006;
Chen et al. 2008;
Liu et al. 2008;
Ogbonnaya et al. 2008;
Fofana et al. 2009;
Mohan et al. 2009;
Munkvold et al. 2009;
Rasul et al. 2009;
Liu and Bai 2010;
Miao et al. 2013), while QTLs associated with seed dormancy have been identified on chromosomes 1A, 1B, 2A, 2B, 2D, 3A, 3B, 4A, 4B, 4D, 5B, 6B, 7A, 7B and/or 7D (
Kato et al. 2001;
Mares and Mrva 2001;
Osa et al. 2003;
Lohwasser et al. 2005;
Mares et al. 2005,
2009;
Tan et al. 2006;
Chen et al. 2008;
Ogbonnaya et al. 2008;
Torada et al. 2005,
2008;
Zhang et al. 2008;
Munkvold et al. 2009;
Singh et al. 2010;
Rehman et al. 2012). A major QTL has been identified on chromosomes 3A, 3B, 3D and 4A which explained up to 58.0% of phenotypic variation in PHS resistance and 44.8% in seed dormancy (
Groos et al. 2002;
Osa et al. 2003;
Mares et al. 2005;
Kulwal et al. 2004,
2005;
Mori et al. 2005;
Torada et al. 2005;
Liu et al. 2008;
Ogbonnaya et al. 2008; Chen
et al. 2009;
Miao et al. 2013).
Despite the extremely low self-sufficiency of wheat in Korea, the per capita wheat consumption is the second highest following rice. But just recently, wheat production in Korea is improving by settlement of contract farming and demand of domestic wheat products by consumers. The expansion of wheat cultivation has been more important than ever before in Korea. Only a few cultivars, however, have been grown in southern part of Korea and these cultivars have been susceptible to PHS. Therefore, an efficient and reliable molecular markers should be developed to boost programs in improving PHS resistance in Korean wheat cultivars. This study was conducted to understand the genetic basis of improvement in Korean wheat breeding programs through the investigation of QTLs related with PHS and seed dormancy with DH population derived from the Keumkang and Olgeuru cross. Keumkang, the most commonly grown in Korea, is a hard-white grain cultivar susceptible to PHS, while Olgeuru is a soft-red grain cultivar with moderate resistance to PHS (
Kim et al. 2012).
MATERIALS AND METHODS
Plant materials
A population of 122 DH lines was derived from F
1 plants of the Keumkang and Olgeuru cross using the wheat × maize system of
Inagaki and Mujeeb-Kazi (1995) at CIMMYT (El Batan, Mexico). The DH lines were grown at the Upland Crop Experimental Farm of National Institute of Crop Science, RDA (Iksan, Korea) for seed multiplication in 2009. Field trials of DH population were established in 2012/2013 on 50% clay loam soil where seeds were sown in randomized complete blocks with three replications. Twenty-five Korean wheat cultivars were also cultivated at the same conditions for DH population. The seeds were sown on each plot consisted of three 4.0 m rows spaced 25 cm apart. Sowing was carried out on October 25. The plots were combine-harvested on June 20 in three years. Fertilizer was applied at 5: 7: 5kg/10a (N: P: K) before sowing, and weeds, insects and diseases were stringently controlled. No supplemental irrigation was applied. Spikes of each line in the field were harvested at maturity, when all the green color had disappeared from the leaves and stems. Spikes were dried under room conditions for seven days until the moisture content of the grain was ~14% and they were then gently threshed by hand and kept at −20°C to preserve dormancy (Mares 1983).
Pre-harvest sprouting was conducted by mist spray in the humid chamber (PHS-MS) according to the procedure described in
Liu et al. (2008) with some modifications. Ten spikes per line were immediately placed in a mist chamber for sprouting assays. Sprouting assays were conducted with a humidifier (Humidifier HR-25, Faran Industrial Co., Korea) which was sprayed at 3,400 rpm with 2,500 ml of tap water every hour for two weeks at 20 ± 2°C with 100% humidity, After humidification, spikes were air-dried at room temperature for one week. Air-dried spikes were hand-threshed and sprouted and sound kernels were counted. Pre-harvest sprouting was described as the percentage of sprouted kernels in a spike.
Germination index (GI) was measured according to the procedure provided in
Walker-Simmons (1988). Sound grains were incubated on a single layer of filter paper, moistened with distilled water, in the dark condition for seven days at 20°C. Germinated grains were counted daily and removed. Germination index was calculated using the following formula: Germination index = (7 ×
n1 + 6 ×
n2 +···1 ×
n7) / (7 days × total grains), where
n1,
n2,
n3, ···, and
n7 are the number of grains that had germinated on Day 1, Day 2, ···, and Day 7. The maximum index is 1.0 if all grains germinate by Day 1, with lower indices indicating increasing levels of grain dormancy or reduced germinability (
Mares and Mrva 2001).
Grain color was determined by the procedure described in Ram et al. (2002). A total of 30 grains were soaked with 50 ml of 5M NaOH solution for 10 min at 60°C. Red-grained cultivars showed a dark-red color and white-grains exhibited straw yellow color. Statistical analysis of the phenotypic data was performed by SAS software (SAS Institute, NC, USA) using Fisher’s least significant difference test (LSD), analysis of variance (ANOVA) and pair-wise t-test.
PCR Primer
A total of 537 microsatellite markers were used to detect polymorphisms survey between the parents. These markers were developed based on the DNA sequences available at GenBank database (
www.ncbi.nlm.nig.gov). A set of 140 markers successfully produced amplicons, among them,
Xbarc12 primer amplified 203 and 185 bp bands (
Table 1). Another primer,
Xgwm3, amplified 90 and 83 bp bands (
Table 1).
Leaf tissue was collected from a single plant for each DH line after germination for two weeks which was flash-frozen in liquid nitrogen and stored at −80°C until needed. Genomic DNA was extracted from young leaf tissue (100 mg) using a genomic DNA prep kit (Solgent Co., Korea) according to the manufacturer’s instructions. DNA was quantified by Biodrop (Biodrop Ltd, UK). The PCR reactions with simple sequence repeats (SSRs) were performed in a total volume of 15 μL containing 100 ng genomic DNA, 1× PCR buffer, 1.5 mM MgCl2, 0.2 mM dNTPs, 1 unit Taq DNA polymerase, and 0.2 ug/ul each primer. After an initial denaturation at 94°C for 5 min., 10 cycles (1°C-lower per cycle) were performed for 1 min at 94°C, 1 min at 63°C, 1 min at 72°C, followed by 35 cycles of 1 min at 94°C, 1 min at 55°C, 1 min at 72°C and final extension at 72°C for 10 min. The PCR products were analyzed with QIAxcel Advanced system using a 12-capillary QIAxcel DNA high resolution Cartridge (Qiagen Co., USA).
Statistical analysis
Data were analyzed with SAS software (SAS Institute, NC, USA) using Fisher’s least significant difference test (LSD), analysis of variance (ANOVA) and t-test. Analysis of variance was conducted using the general linear model procedure and sources of variation in the model were considered to be fixed effects. Pearson’s correlation analysis was also conducted with significance level of P < 0.05 unless otherwise specified.
QTL analysis
Individual map for initial QTL detection was constructed using MapDisto (
http://mapdisto.free.fr). Composite interval mapping (CIM) analysis (Zeng 1993, 1994) was performed using Windows version QTL Cartographer v2.5 (
Wang et al. 2012) based on a model 6, Forward and Backward Regression method. The walking speed for all QTL was 2.0 cM and the probability in stepwise regression was
p < 0.001. Centimorgan units were calculated using Kosambi mapping function. Empirical logarithm of the odds (LOD) value thresholds were estimated using 1,000 permutations at an experiment-wise
P < 0.01. (Churchill and Doerge 1994). The LOD score for declaring a QTL was significant at 3.0. The additive value and the coefficient of determination (
R2) which is based on the partial correlation of putative QTL with the trait adjusted for cofactors in the multi-locus model, were estimated based on the most significant dataset.
RESULTS
The means and ranges of PHS-MS and GI percentage are shown in
Table 2 and
Fig. 1. Olgeuru was more resistant to pre-harvest sprouting than Keumkang, showing lower percentage of PHS-MS (2.80%) and GI (0.17) than Keumkang (30.20% and 0.41, respectively). The PHS-MS and GI in DH lines ranged from 0.00% to 73.03% and from 0.01 to 0.73, respectively. The frequency distribution of 122 DH lines was continuous, and transgressive segregants were observed in PHS-MS and GI (
Fig. 1). Of the 122 DH lines, 24 had white seed coat and 98 lines showed red color. Red-grained DH lines showed lower GI (0.15) than white-grained (0.30,
Fig. 2A), but there was no significant difference in PHS-MS according to the grain color. PHS-MS correlated positively with GI in DH population (r = 0.732,
P < 0.001,
Fig. 2B). From a total of 537 SSR markers, 140 were polymorphic between Keumkang and Olgeuru. Linkage analysis of the 140 segregating markers identified a partial genetic map spanning 2,340.7 cM over 21 chromosomes.
Three putative QTLs associated with GI and PHS were detected as summarized in
Table 3 and
Fig. 3. Two significant QTLs associated with GI,
Xbarc12 and
Xgwm3, were detected and mapped on chromosomes 3A and 3D with LOD scores of 4.95 and 4.02, respectively. Only
Xbarc12 was associated with PHS with LOD score of 10.43.
Xbarc12 explained the highest phenotypic variation (
R2) in GI and PHS, accounting for 11.99% and 27.25%, respectively.
Xgwm3 explained 9.10% of phenotypic variation in GI. Negative additive effects of
Xbarc12 were −0.12 for GI and −14.38 for PHS-MS, respectively, with Olgeuru alleles causing 12% reduction in GI and 14% lower PHS-MS. Keumkang alleles, on the otherhand, tended to increase GI by 11% at
Xgwm3.
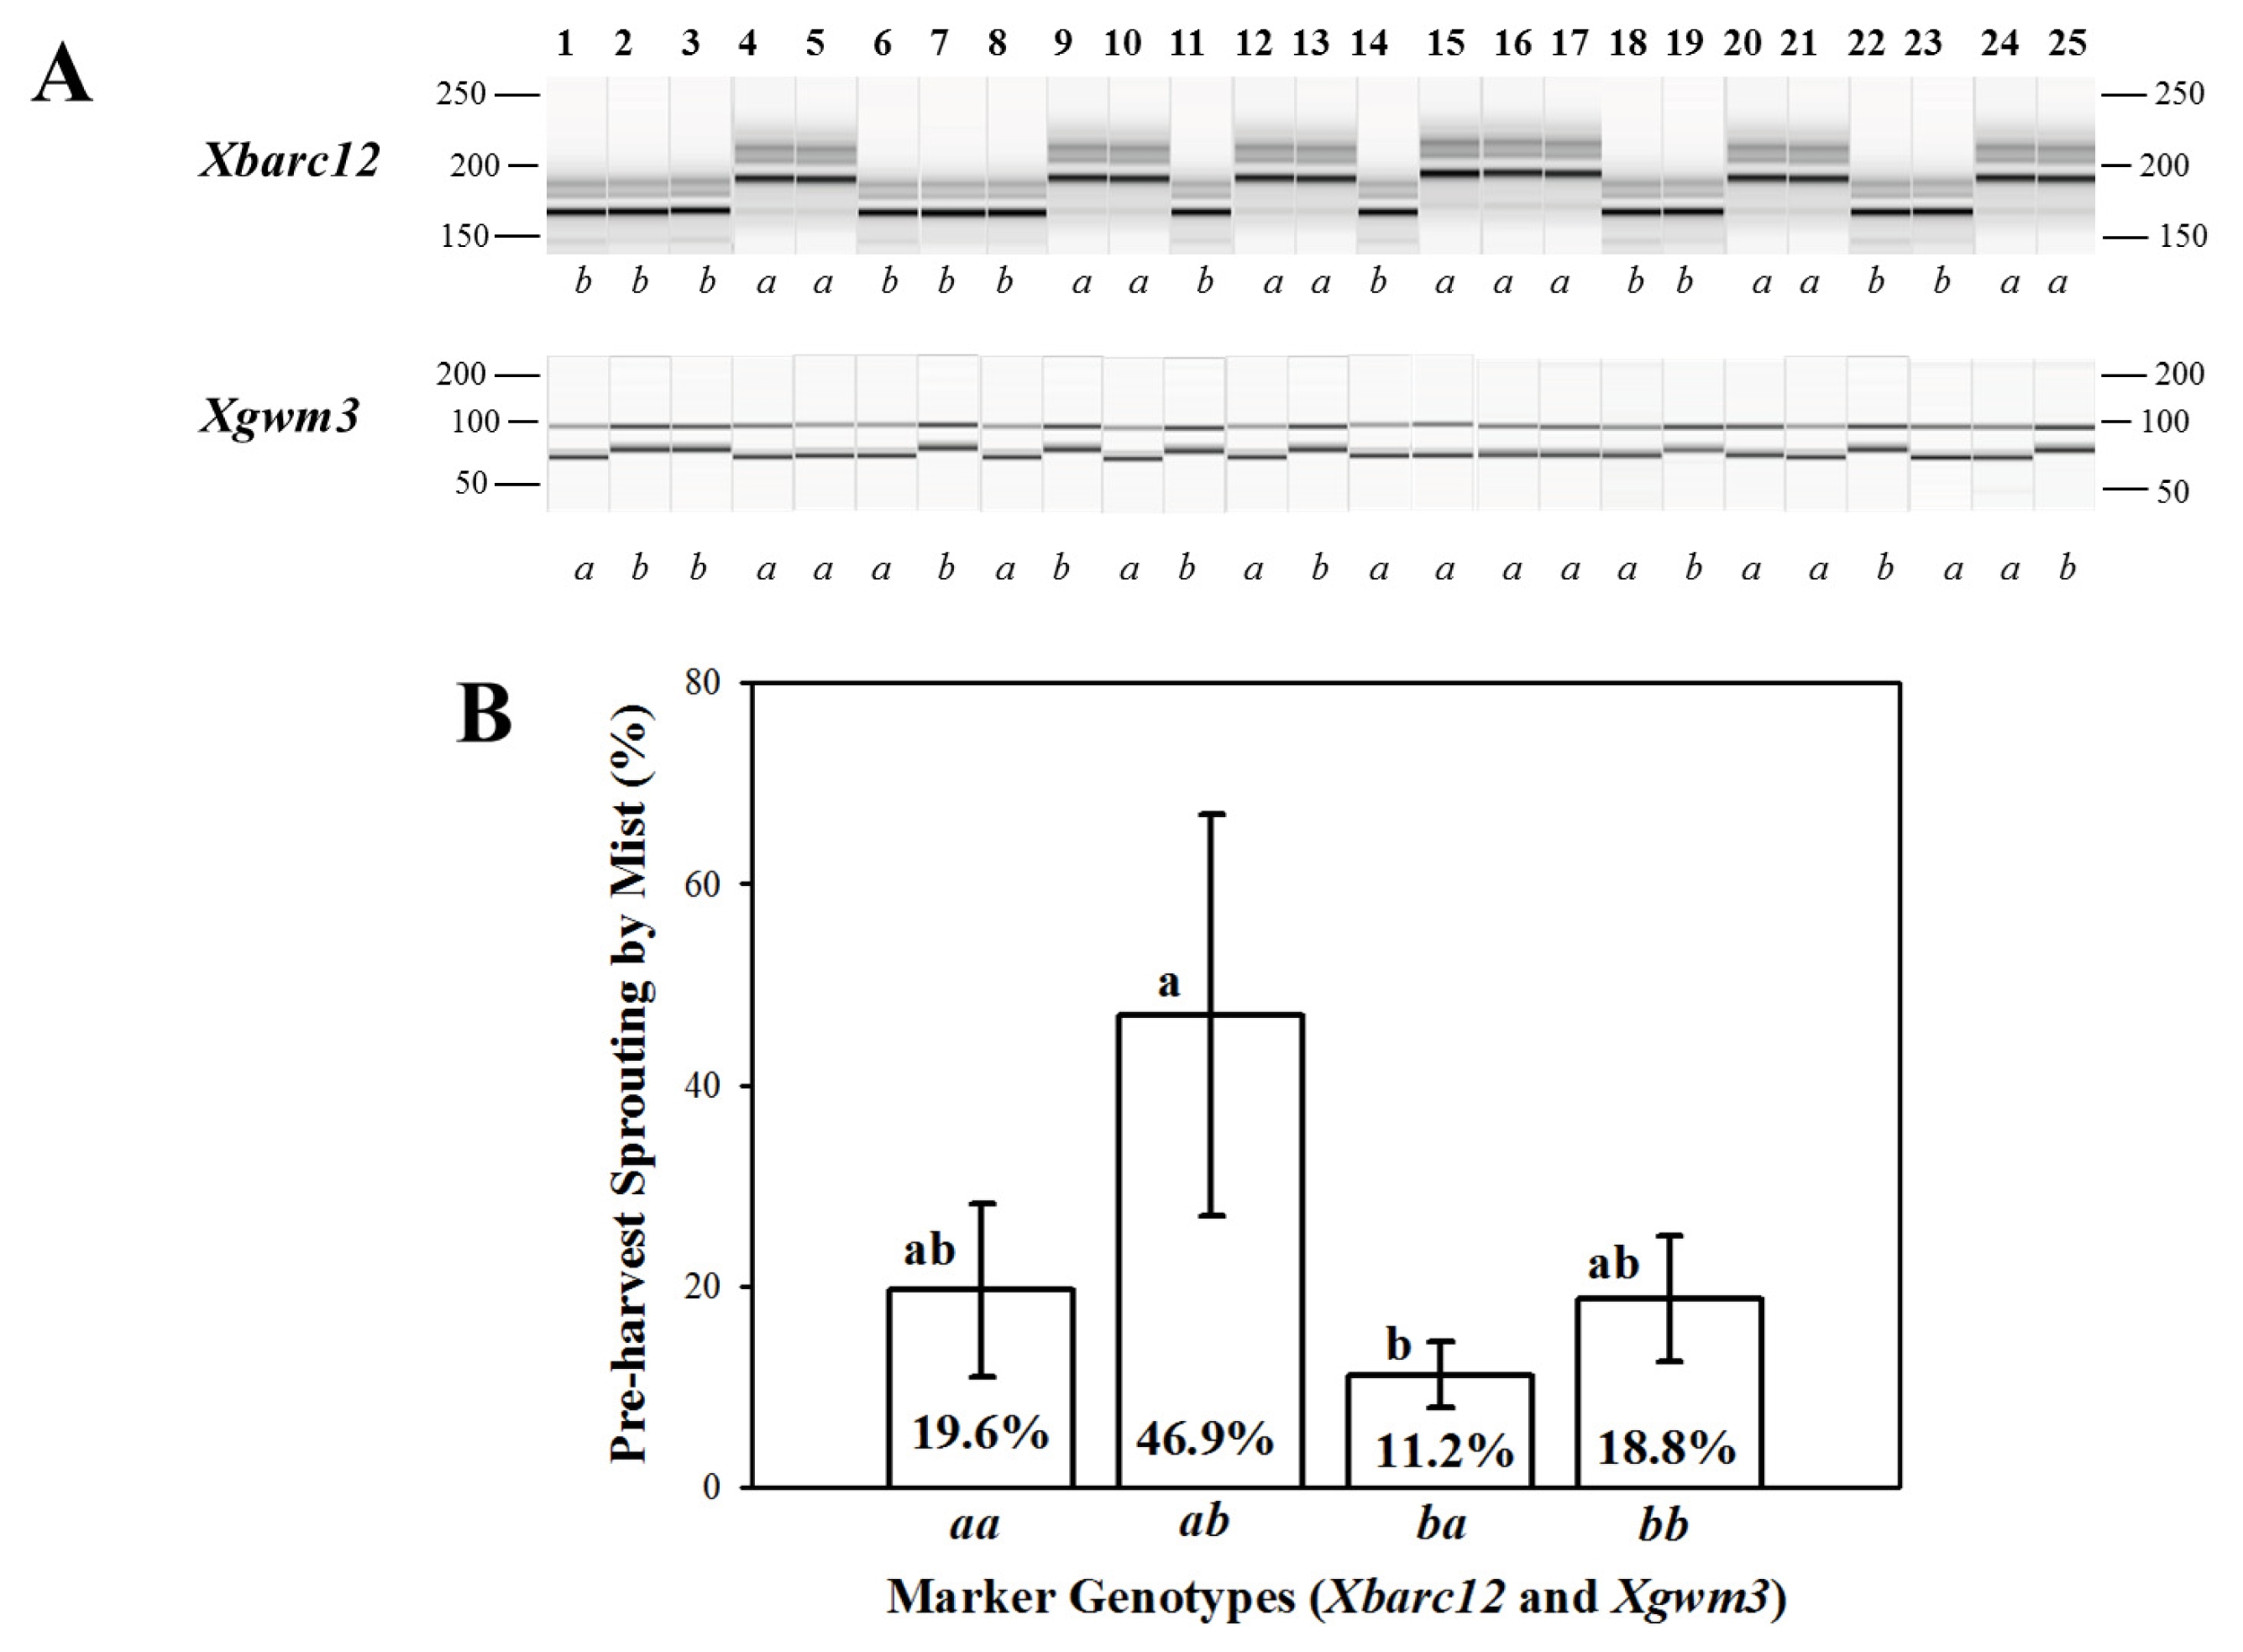
Validation for PHS and GI of 25 Korean wheat cultivars using two QTLs,
Xbarc12 and
Xgwm3 is summarized in
Table 4 and
Fig. 4. The PHS-MS and GI in Korean wheat cultivars ranged from 1.37% to 86.75% and from 0.03 to 0.73, respectively. Korean wheat cultivars carrying Keumkang and Olgeuru alleles at
Xbarc12 and
Xgwm3 loc showed higher percentage of PHS-MS than others (
Fig. 4-B). On the contrary, Olgeuru and Keumkang alleles at respective
Xbarc12 and
Xgwm3 loci showed lower percentage of PHS-MS than others.
DISCUSSION
PHS is the germination of seeds while still on plants when rainfall and high humidity prevail before harvest. PHS has resulted in yield losses and decreased end-used quality of wheat around the world (
Lin et al. 2009). PHS is mainly influenced by seed dormancy and complex traits affected by environmental factors (
Chang et al. 2010;
Singh and Singh 2012). Seed dormancy evaluated by germination index (GI) is generally used to predict PHS resistance because GI is more stable with regard to growing condition including high temperature and drought during the grain filling stage (
Gubler et al. 2005;
Shorter et al. 2005;
Chang et al. 2010). In Korea, the percentage of PHS rate increased up to 30% due to climate change especially during monsoon season. Therefore, resistance to PHS is an important breeding target trait to improve the wheat production in Korea.
The relationship between grain color and PHS resistant was reported in previous studies (
Filintham et al. 1999;
Mares et al. 2005;
Mori et al. 2005). Red grain color controlled by R gene which located on the long arms of chromosomes 3A, 3B and 3D is associated with coat-imposed dormancy. Red-grained wheat is usually more resistant to PHS than white-grained wheat (
Filintham 2000;
Croos et al. 2002;
Liu et al. 2013). Of the 122 DH lines, 24 had white seed coat and 98 showed red color. The red-grained DH lines showed lower GI value (0.15) than white-grained (0.30), however there was no significant difference in PHS-MS according to the grain color. However, PHS-MS correlated positively with GI in DH population (r = 0.732,
P < 0.001,
Fig. 2B). Shin
et al. (2012) also reported that white-grained Korean wheat cultivars have higher flour yields than red grains. But white-grained Korean wheat cultivars were susceptible to PHS than red-grained wheat cultivars. Thus, improvement of PHS resistance in white-grained wheat is important in Korean wheat breeding programs.
PHS has been proved to be controlled by multigenes or quantitative trait loci (QTLs) on chromosomes 2, 3, 4, 6, and 7 from different wheat mapping populations (
Flintham 2000;
Groos et al. 2002;
Chen et al. 2008;
Ogbonnaya et al. 2008;
Depauw et al. 2009;
Chang et al. 2011;
Liu et al. 2013). Major QTLs on chromosomes 2B, 3A, and 4A have demonstrated major effects on PHS resistance (
Mares et al. 2005;
Liu et al. 2008;
Munkvold et al. 2009; Liu
et al. 2011).
Chang et al. (2010) reported six variant alleles of
Vp-1B depending on PHS resistance in Chinese wheat varieties. The two markers,
ZXQ118 and
Xhbe3 on chromosome 4A, were successfully validated on each country’s wheat lines (
Torada et al. 2008;
Zhang et al. 2008). But,
Vp-1B and SSR markers did not correlate with PHS-MS and GI in Korean wheat varieties (
Kim et al. 2012).
Groos et al. (2002) detected that QTLs for grain color located on chromosomes 3A, 3B and 3D included QTLs for seed dormancy (
Osa et al. 2003). Also,
Liu et al. (2013) reported that a QTL on chromosome 3A for
TaPHS1, which is a homolog of flowering time-like gene, is a PHS resistance-linked gene. Linkage analysis of the 140 segregating markers positively correlated with two markers,
Xbarc12 and
Xgwm3, on chromosomes 3A and 3D.
Xbarc12 and
Xgwm3 explained the highest amount of phenotypic variation (
R2) in GI and PHS. These markers will be further fine-mapped to explore their potential uses in Korean wheat breeding programs.
ACKNOWLEDGMENTS
This work was carried out with the support of “Cooperative Research Program for Agriculture Science & Technology Development (Project title: Search for stress tolerance genetic source and investigation of disease in wheat, Project No. PJ008392)” Rural Development Administration, Republic of Korea.
Fig. 1Frequency distributions of pre-harvest sprouting parameters in 122 DH population. (A) Percentage of pre-harvest sprouting induced by the mist spray (PHS-MS); (B) germination index (GI). Arrows indicate PHS-MS and GI of parental cultivars.
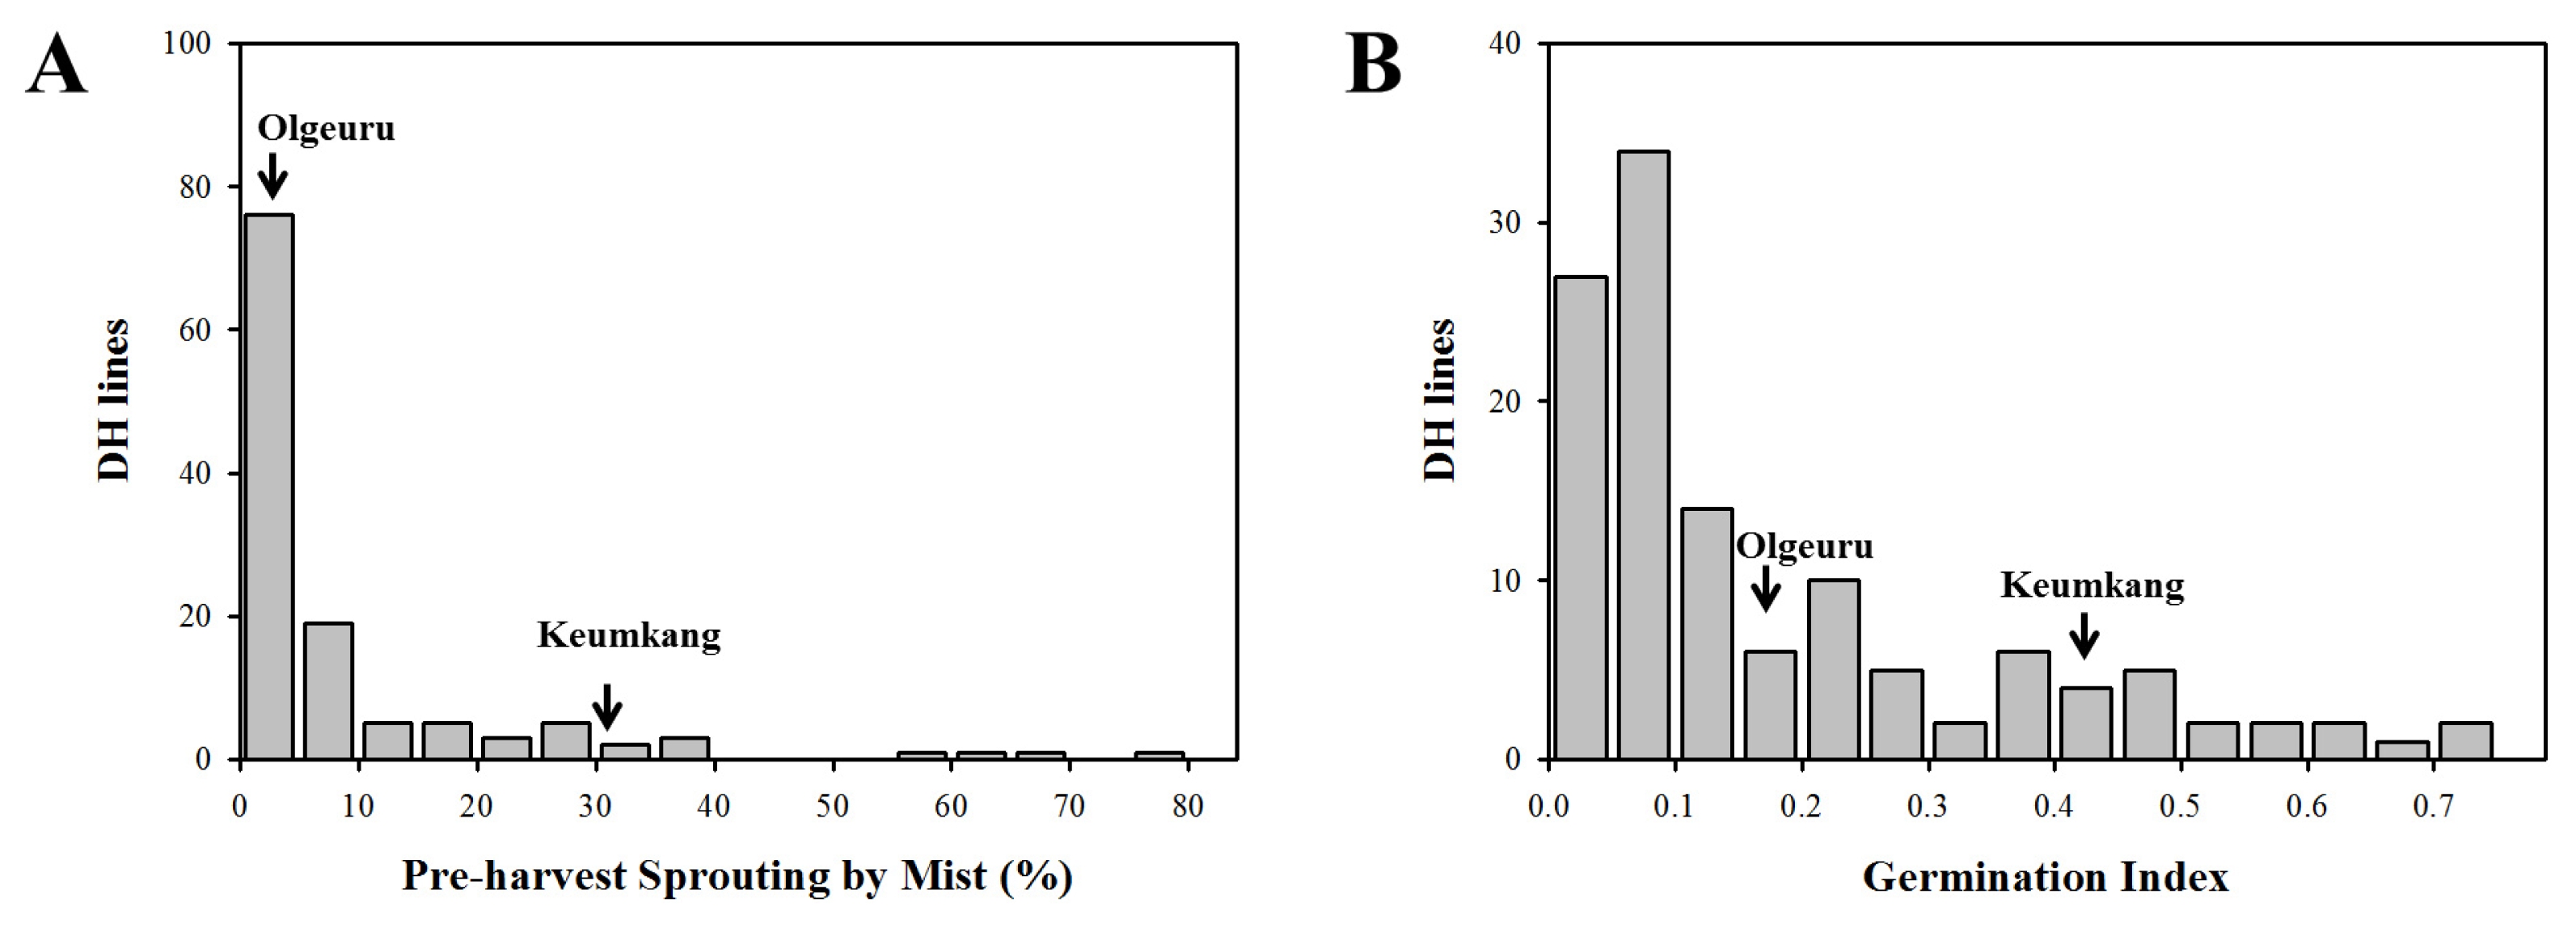
Fig. 2The differences in germination index according to the grain color (A) and relationship between percentage of pre-harvest sprouting induced by the mist spray (PHS-MS) and germination index (GI) in 122 DH population (B). Each bar represents mean ± standard error and values on the bars with different letters are significantly different at p < 0.05. 122 DH population with red grain color (●) and white grain color (○).
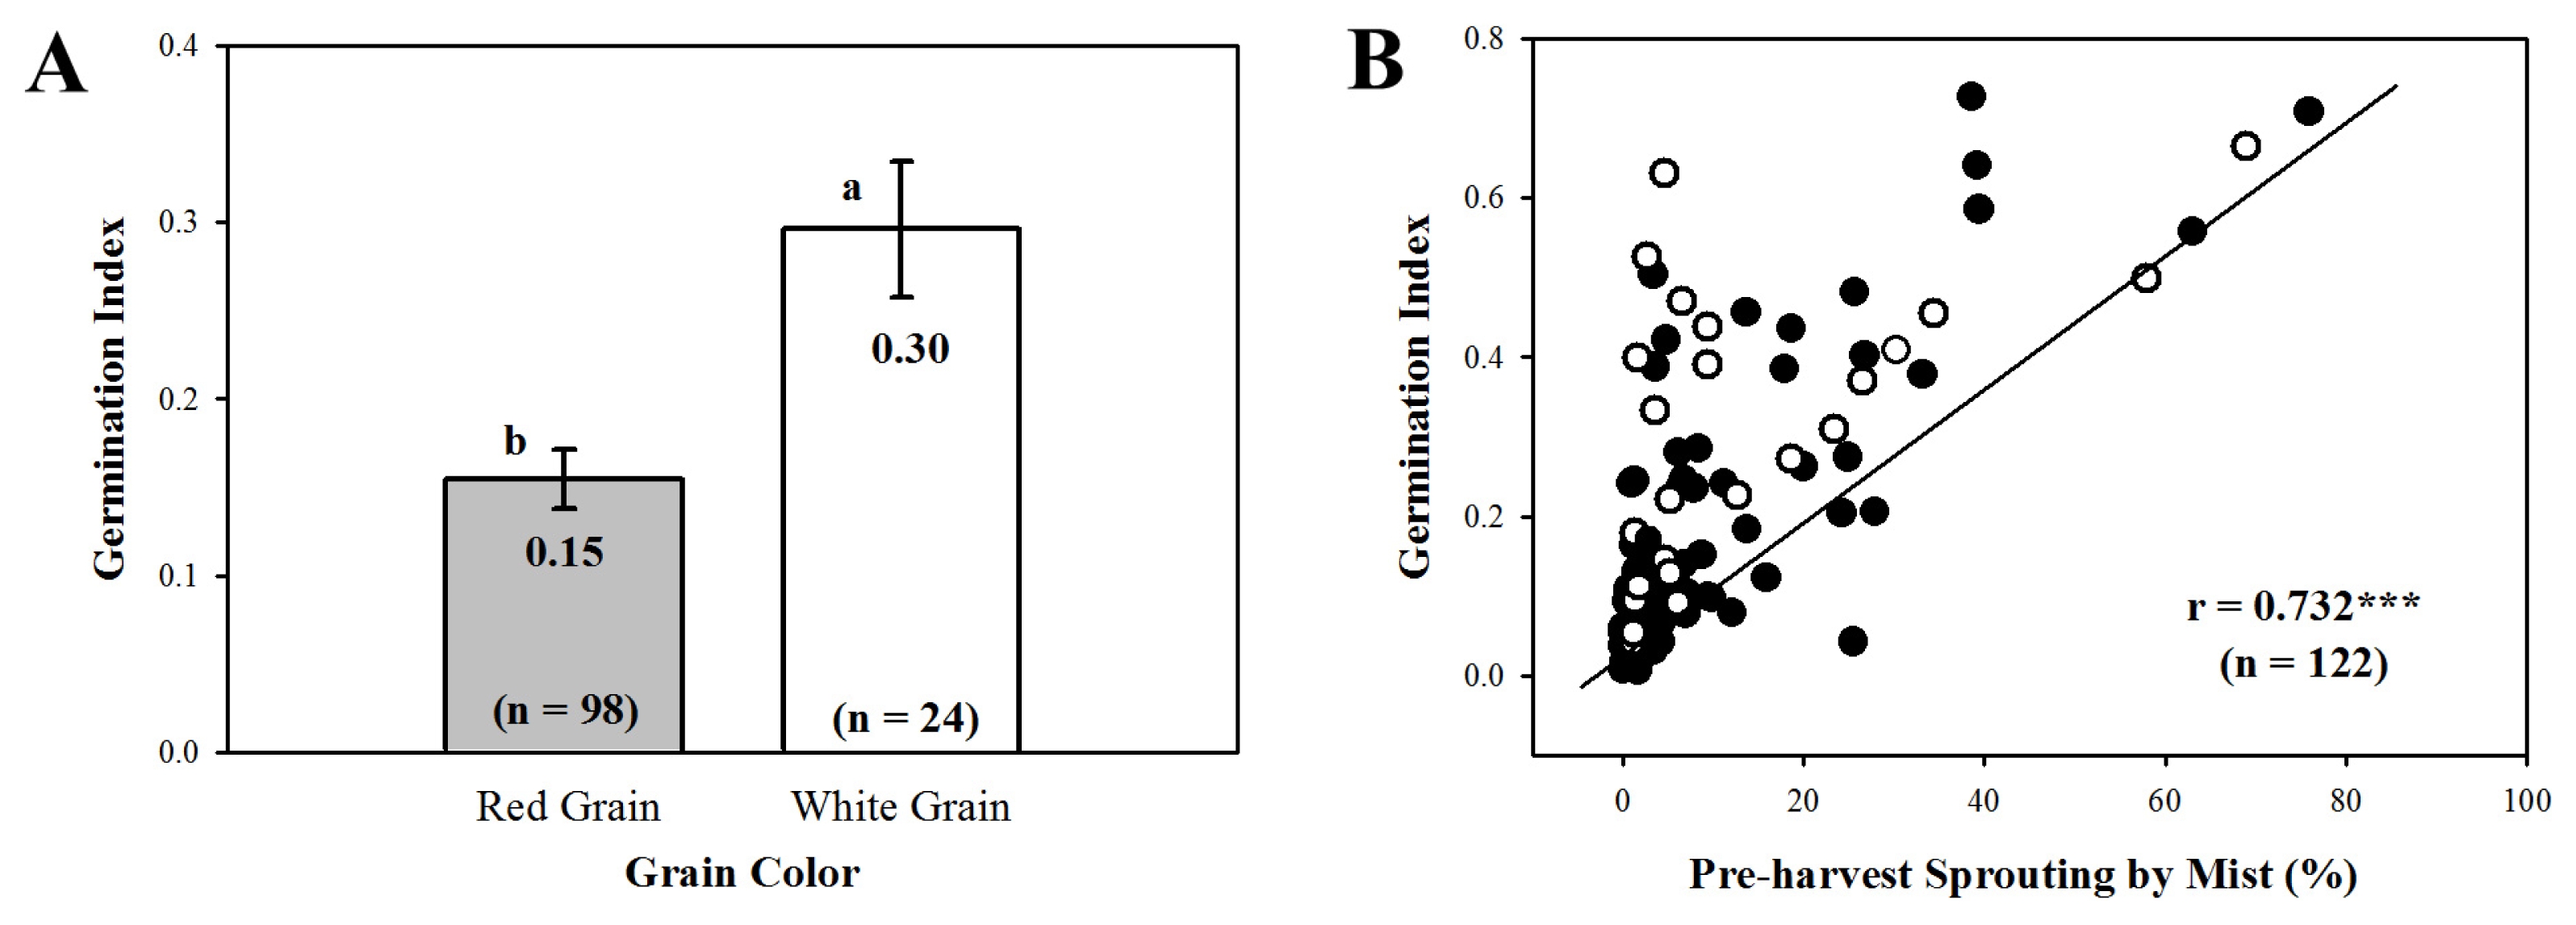
Fig. 3Linkage maps for percentage of pre-harvest sprouting induced by the mist spray (PHS-MS) and germination index (GI) on chromosomes 3A and 3D in 122 DH population. Markers are indicated on the right and genetic distances (cM) are indicated on the left. Markers are underlined by line for GI and dotted line for PHS-MS.
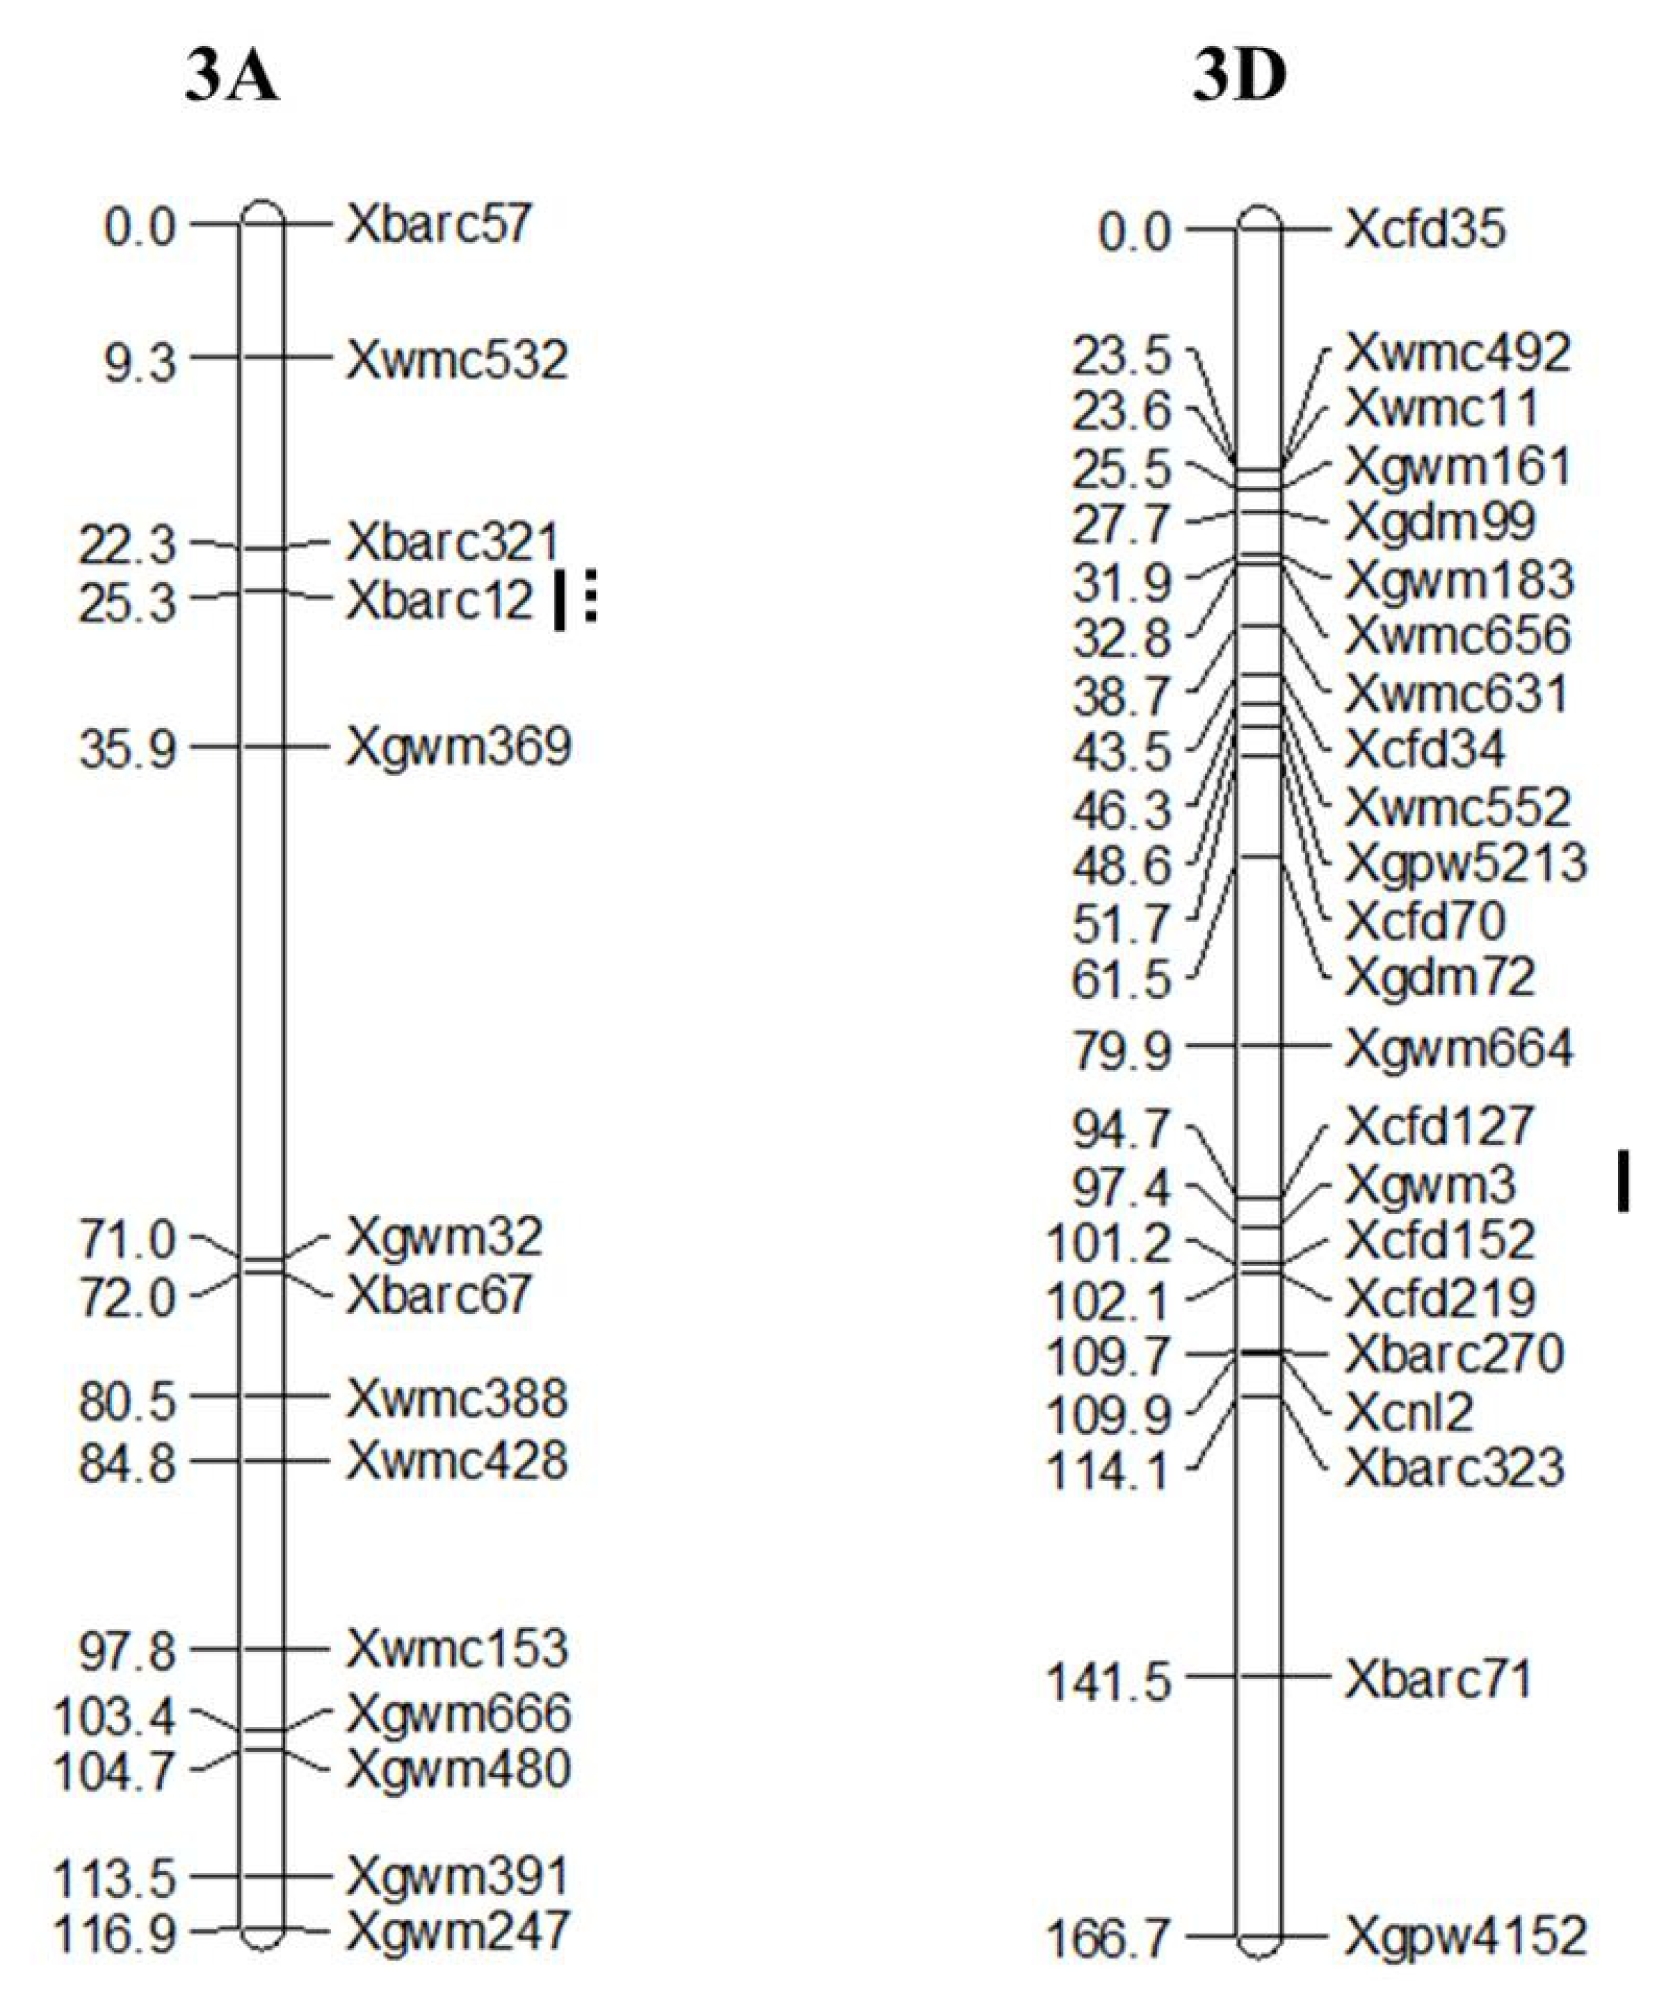
Fig. 4PCR products produced from QIAxcel system of two QTLs, Xbarc12 and Xgwm3 (A) and difference of percentage of pre-harvest sprouting induced by the mist spray (PHS-MS) in Korean wheat cultivars (B). 1, Alchan; 2, Anbaek; 3, Baekjoong; 4, Cheongkye; 5, Dahong; 6, Eunpa; 7, Geuru; 8, Gobun; 9, Jeokjoong; 10, Jinpoom; 11, Joeun; 12, Jokyung; 13, Jonong; 14, Jopoom; 15, Keumkang;16, Milseong; 17, Namhae; 18, Ol; 19, Olgeuru; 20, Saeol; 21, Seodun; 22, Sukang; 23, Tapdong; 24, Uri; 25, Younbaek. a and b represent homozygous to Keumkang and Olgeuru genotypes, respectively, and QTLs order is Xbarc12 and Xgwm3. Error bar denotes standard error. Different letters, a and b, indicate significant difference at P < 0.05.

Table 1The primer sets used for amplification of the genomic sequence and PCR analysis by Xbarc12 and Xgwm3 markers.
Table 1
|
Marker |
Forward and reverse primers (5′→3′) |
Annealing temperature (°C) |
Fragment size (bp) |
|
Xbarc12
|
F: CGACAGAGTGATCACCCAAATATAA
R: CATCGGTCTAATTGTCAATGTA |
52 |
203, 185 |
|
Xgwm3
|
F: GCAGCGGCACTGGTACATTT
R: AATATCGCATCACTATCCCA |
55 |
90, 83 |
Table 2Means, ranges and ANOVA of percentage of pre-harvest sprouting induced by the mist spray (PHS-MS) and germination index (GI) in 122 DH population derived from the cross of white × red seeded cultivar, cvs. Keumkang and Olgeuru.
Table 2
|
Traits |
Parentsz)
|
DH population |
|
|
|
Keumkang |
Olgeuru |
Mean ± SD |
Range |
Mean square |
F-valuey)
|
Root MSEx)
|
|
PHS-MS (%) |
30.20a |
2.80b |
8.62 ± 13.65 |
0.00 – 73.03 |
601.69 |
544.51*** |
1.05 |
|
GI |
0.41a |
0.17b |
0.18 ± 0.18 |
0.01 – 0.73 |
0.10 |
103.06*** |
0.03 |
Table 3QTL for pre-harvest sprouting resistance detected using composite interval mapping in 122 DH population derived from the cross of white × red seeded cultivar, cvs. Keumkang and Olgeuru.
Table 3
|
Traits |
Marker |
Chromosome |
LODz)
|
R2 (%)y)
|
Additive effectx)
|
|
GI |
Xbarc12
|
3A |
4.95 |
11.99*** |
−0.12 |
|
Xgwm3
|
3D |
4.02 |
9.10** |
0.11 |
|
PHS-MS (%) |
Xbarc12
|
3A |
10.43 |
27.25*** |
−14.38 |
Table 4Percentage of pre-harvest sprouting induced by the mist spray (PHS-MS) and germination index (GI) of homozygous recombinants among Xbarc12, and Xgwm3 in 25 Korean wheat cultivars.
Table 4
|
Cultivar |
Genotypez)
|
PHS-MS (%) |
GI |
|
|
Xbarc12
|
Xgwm3
|
|
Alchan |
b
|
a
|
2.17 |
0.07 |
|
Anbaek |
b
|
b
|
25.93 |
0.11 |
|
Baekjoong |
b
|
b
|
41.74 |
0.55 |
|
Cheonggkye |
a
|
a
|
5.96 |
0.03 |
|
Dahong |
a
|
a
|
1.37 |
0.05 |
|
Eunpa |
b
|
a
|
18.44 |
0.26 |
|
Geuru |
b
|
b
|
25.87 |
0.26 |
|
Gobun |
b
|
a
|
19.30 |
0.13 |
|
Jeokjoong |
a
|
b
|
48.79 |
0.59 |
|
Jinpoom |
a
|
a
|
4.99 |
0.12 |
|
Joeun |
b
|
b
|
14.48 |
0.38 |
|
Jokyung |
a
|
a
|
86.75 |
0.43 |
|
Jonong |
a
|
b
|
11.41 |
0.08 |
|
Jopoom |
b
|
a
|
17.60 |
0.12 |
|
Keumkang |
a
|
a
|
30.20 |
0.41 |
|
Milsung |
a
|
a
|
3.14 |
0.05 |
|
Namhae |
a
|
a
|
4.19 |
0.12 |
|
Ol |
b
|
a
|
3.31 |
0.73 |
|
Olgeuru |
b
|
b
|
2.80 |
0.17 |
|
Saeol |
a
|
a
|
14.00 |
0.06 |
|
Seodun |
a
|
a
|
43.20 |
0.35 |
|
Sukang |
b
|
b
|
1.72 |
0.03 |
|
Tapdong |
b
|
a
|
6.09 |
0.08 |
|
Uri |
a
|
a
|
2.12 |
0.05 |
|
Younbaek |
a
|
b
|
80.44 |
0.60 |
|
LSDy)
|
|
|
0.88 |
0.06 |
References
- Chang C, Zhang HP, Feng JM, Yin B, Si HQ, Ma CX. 2010. Identifying alleles of Viviparous-1B associated with pre-harvest sprouting in micro-core collections of Chinese wheat germplasm. Mol Breed. 25: 481-490.
- Chang C, Zhang HP, Zhao QX, Feng JM, Si HQ, Lu J, Ma CX. 2011. Rich allelic variations of Vipiparous-1A and their associations with seed dormancy/pre-harvest sprouting of common wheat. Euphytica. 179: 343-353.
- Chen CX, Cai SB, Bai GH. 2008. A major QTL controlling seed dormancy and pre-harvest sprouting resistance on chromosome 4A in a Chinese wheat landrace. Mol Breed. 21: 351-358.
- DePauw RM, Clarke FR, Fofana B, Knox R, Humphreys G, Cloutier S. 2009. RL4137 contributes preharvest sprouting resistance to Canadian wheats. Euphytica. 168: 347-361.
- Finkelstein R, Reeves W, Ariizumi T, Steber C. 2008. Molecular aspects of seed dormancy. Annu Rev Plant Biol. 59: 387-415.
- Flintham J, Adlam RE, Gale MD. 1999. Seed coat and embryo dormancy in wheat. J Cereal Sci. 21: 1-3.
- Flintham JE. 2000. Different genetic components control coat imposed and embryo-imposed dormancy in wheat. Seed Sci Res. 10: 43-50.
- Flintham JE, Adlam R, Bassoi M, Holdsworth M, Gale M. 2002. Mapping genes for resistance to sprouting damage in wheat. Euphytica. 126: 39-45.
- Fofana B, Humphreys DG, Rasul G, Cloutier S, Brûlé-Babel A, Woods S, Lukow OM, Somers DJ. 2009. Mapping quantitative trait loci controlling pre-harvest sprouting resistance in a red white seeded spring wheat cross. Euphytica. 165: 509-521.
- Gao X, Hu CH, Li HZ, Yao YJ, Meng M, Dong J, Zhao WC, Chen QJ, Li XY. 2013. Factors affecting pre-harvest sprouting resistance in wheat (Triticum aestivum L.) a review. J Anim Plant Sci. 23: 556-565.
- Groos C, Gay G, Perretant MR, Gervais L, Bernard M, Dedryver F, Charmet G. 2002. Study of the relationship between pre-harvest sprouting and grain color by quantitative trait loci analysis in a white × red grain bread wheat cross. Theor Appl Genet. 104: 39-47.
- Gubler F, Millar AA, Jacobsen JV. 2005. Dormancy release, ABA and pre-harvest sprouting. Curr Opin Plant Biol. 8: 183-187.
- Gupta PK, Langridge P, Mir RR. 2010. Marker-assisted wheat breeding: present status and future possibilities. Mol Breed. 26: 145-161.
- Inagaki MN, Mujeeb-Kazi A. 1995. Comparison of polyhaploid production frequencies in crosses of hexaploid wheat with maize, pearl millet and sorghum. Breed Sci. 45: 157-161.
- Kato K, Nakamura W, Tabiki T, Miura H, Sawada S. 2001. Detection of loci controlling seed dormancy on group 4 chromosomes of wheat and comparative mapping with rice and barley genomes. Theor Appl Genet. 102: 980-985.
- Kim KH, Kang CS, Park JC, Shin SH, Hyun JN, Park CS. 2012. Evaluation of Pre-harvest Sprouting in Korean Wheat Cultivar. Kor J Breed Sci. 44: 26-537.
- Kim KH, Shin SH, Lee HS, Kim JY, Son JH, Kang CS, Park JC, Shin SH, Park CS. In press. Relationship between pre-harvest sprouting and functional markers, TaVp-1A, TaSdr-B1 and TaPHS1, in Korean wheat cultivars. Res Crop.
- Kim KH, Shin SH, Park S, Park JC, Kang CS, Park CS. In press. Relationship between pre-harvest sprouting and functional markers associated with grain weight, TaSus2-2B, TaGW2-6A, and TaCwi-A1, in Korean wheat cultivars. SABRAO J Breed Genet.
- Kottearachchi NS, Uchino N, Kato K, Miura H. 2006. Increased grain dormancy in white grained wheat by introgression of preharvest sprouting tolerance QTLs. Euphytica. 152: 421-428.
- Kulwal P, Ishikawa G, Benscher D, Feng Z, Yu L-X, Jadhav A, Mehetre S, Sorrells ME. 2012. Association mapping for pre-harvest sprouting resistance in white winter wheat. Theor Appl Genet. 125: 793-805.
- Kulwal PL, Kumar N, Gaur A, Khurana P, Khurana JP, Tyagi AK, Balyan HS, Gupta PK. 2005. Mapping of a major QTL for pre-harvest sprouting tolerance on chromosome 3A in bread wheat. Theor Appl Genet. 111: 1052-1059.
- Kulwal PL, Singh R, Balyan HS, Gupta PK. 2004. Genetic basis of pre-harvest sprouting tolerance using single-locus and two-locus QTL analyses in bread wheat. Funct Integr Genomics. 4: 94-101.
- Lin R, Horsley RD, Schwarz PB. 2009. Methods to determine dormancy and pre-harvest sprouting resistance in Barley. Crop Sci. 49: 831-840.
- Liu S, Bai G. 2010. Dissection and fine mapping of a major QTL for pre-harvest sprouting resistance in white wheat Rio Blanco. Theor Appl Genet. 121: 1395-1404.
- Liu S, Cai S, Graybosch R, Chen C, Bai G. 2008. Quantitative trait loci for resistance to pre-harvest sprouting in US hard white winter wheat Rio Blanco. Theor Appl Genet. 117: 691-699.
- Liu S, Sehgal SK, Li J, Lin M, Trick HN, Yu J, Gill BS, Bai G. 2013. Cloning and characterization of a critical regulator for pre-harvest sprouting in wheat. Genetics. 195: 263-73.
- Lohwasser U, Roder MS, Borner A. 2005. QTL mapping for the domestication traits pre-harvest sprouting and dormancy in wheat (Triticum aestivum L.). Euphytica. 143: 247-249.
- Mares D, Rathjen J, Mrva K, Cheong J. 2009. Genetic and environmental control of dormancy in white-grained wheat (Triticum aestivum L.). Euphytica. 168: 311-318.
- Mares D, Marv K, Cheong J, Williams K, Watson B, Storlie E, Sutherland M, Zou Y. 2005. . located on chromosome 4A associated with dormancy in white-and red grained wheats of diverse origin. Theor Appl Genet. 111: 1357-1364.
- Mares DJ, Mrva K. 2001. Mapping quantitative trait loci associated with variation in grain dormancy in Australian wheat. Aust J Agric Res. 52: 1257-1265.
- Miao XL, Zhang YJ, Xia XC, He ZH, Zhang Y, Yan J, Chen XM. 2013. Mapping quantitative trait loci for pre-harvest sprouting resistance in white-grained winter wheat line CA 0431. Crop Pasture Sci. 64: 573-579.
- Mohan A, Kulwal P, Singh R, Kumar V, Mir RR, Kumar J, Prasad M, Balyan HS, Gupta PK. 2009. Genome-wide QTL analysis for pre-harvest sprouting tolerance in bread wheat. Euphytica. 168: 319-329.
- Mori M, Uchino N, Chono M, Kato K, Miura H. 2005. Mapping QTLs for grain dormancy on wheat chromosome 3A and group 4 chromosomes, and their combined effect. Theor Appl Genet. 110: 1315-1323.
- Munkvold JD, Tanaka J, Benscher D, Sorrells ME. 2009. Mapping quantitative trait loci for pre-harvest sprouting resistance in white wheat. Theor Appl Genet. 119: 1223-1235.
- Ogbonnaya FC, Imtiaz M, Ye G, Hearnden PR, Hernandez E, Eastwood RF, Van Ginkel M, Shorter SC, Winchester JM. 2008. Genetic and QTL analyses of seed dormancy and pre-harvest sprouting resistance in the wheat germplasm CN10955. Theor Appl Genet. 116: 891-902.
- Osa M, Kato K, Mori M, Shindo C, Torada A, Miura H. 2003. Mapping QTLs for seed dormancy and Vp1 homologue on chromosome 3A of wheat. Theor Appl Genet. 106: 1491-1496.
- Rasul G, Humphrey DG, Brûlé-Babel A, McCartney CA, Knox RE, DePauw RM, Somers DJ. 2009. Mapping QTLs for pre-harvest sprouting traits in the spring wheat cross ‘RL4452/AC Domain’. Euphytica. 168: 363-378.
- Rehman MA, Neumann AK, Nagel M, Kobiljski B, Lohwasser U, Börner A. 2012. An association mapping analysis of dormancy and pre-harvest sprouting in wheat. Euphytica. 188: 409-417.
- Shin SH, Kim KH, Kang CS, Park JC, Hyun JN, Park CS. 2013. Effects of Agronomic Characteristics and Grain Morphology on Pre-harvest Sprouting in Korean Wheat Cultivar. Kor J Breed Sci. 45: 346-357.
- Shorter SC, Munro CA, Hodgkinson J. 2005. Predicting pre-harvest sprouting susceptibility in New Zealand wheat cultivars. Euphytica. 143: 309-312.
- Singh M, Singh J. 2012. Seed development-related expression of ARGONAUTE4_9 class of genes in barley: possible role in seed dormancy. Euphytica. 188: 123-129.
- Singh R, Matus-Cádiz M, Båga M, Pierre Hucl, Chibar RN. 2010. Identification of genomic regions associated with seed dormancy in white-grained wheat. Euphytica. 174: 391-408.
- Tan MK, Sharp PJ, Lu MQ, Howes N. 2006. Genetics of grain dormancy in a white wheat. Aust J Agric Res. 57: 1157-1165.
- Torada A, Ikeguchi S, Koike M. 2005. Mapping and validation of PCR-based markers with a major QTL for seed dormancy in wheat. Euphytica. 143: 251-255.
- Torada A, Koike M, Ikeguchi S, Tsutsui I. 2008. Mapping of a major locus controlling seed dormancy using backcrossed progenies in wheat (Triticum aestivum L.). Genome. 51: 426-432.
- Walker-Simmons MK. 1988. Enhancement of ABA responsiveness in wheat embryos at higher temperature. Plant Cell Environ. 11: 769-775.
- Wang S, Basten CJ, Zeng ZB. 2012. Windows QTL Cartographer 2.5. Department of Statistics, North Carolina State Univ.; Raleigh, NC, http://statgen.ncsu.edu/qtlcart/WQTLCart.htm
- Zhang XQ, Li C, Tay A, Lance R, Mares D, Cheong J, Cakir M, Ma J, Appels R. 2008. A new PCR-based marker on chromosome 4AL for resistance to pre-harvest sprouting in wheat (Triticum aestivum L.). Mol Breed. 22: 227-236.